![]() Sam Seiden
Sam Seiden
Independent Analyst
When it comes to trading and markets, at Online Trading Academy we tend to think different than conventional wisdom. The reason for this is we are focused on reality based trading and investing. One of the things I am always fascinated with his how we are taught to do certain things and how we learn, specifically when it comes to anything that has to do with competing. In the United States for example, we compete for jobs, money, better this and better that… Have you ever realized that in the biggest democracy in history, our school systems don’t teach classes on how to compete? In capitalism, there is typically a winner and, unfortunately, a loser, yet people in this country are rarely taught in school how to compete or think differently. In fact, it’s the opposite. The natural education path of our school systems train everyone to think the same way. This is bad news for those who have herd mentality blinders on and great news for those who focus on the simplicities and opportunities of competition. It all begins with thinking different. If you bring herd mentality mindset to competing in the trading markets, you will likely hand your account over to those who think different and think the markets properly.
The books that teach conventional Technical Analysis tend to teach it the same way which offers little to no edge. Be careful taking the same action the masses do in the markets, they are not the ones who consistently profit. This does not mean throw all your conventional information out the window. Instead, let me help show you some different ways to use some conventional tools.
Trend Analysis
Most people know all about assessing a trend. Typically, people look to see if the market in question is making higher highs and higher lows for up-trends or lower highs and lower lows for down-trends. Others use moving averages to determine whether they are sloping up for up-trends or down for down-trends. These are the two most popular ways to asses a markets trend. Thinking different, another way to assess trend is to look at the pivot lows in up-trends and pivot highs in down-trends. Let’s take the up-trend for our example. Looking back at recent prior data in any market on a price chart, it is easy to see what the current trend is. What is equally important is to assess how healthy the current trend is and when and where it may end. One way to do this is to measure the distance between the lows of the pivots that make up the up-trend. Notice the uptrend in the chart below, the distance between the pullbacks (pivot lows) is decreasing as the trend moves higher. This means the trend is becoming weak and is likely to end soon. The logic behind this is that a strong trending market does not pullback often. If it does, it is not a strong trending market anymore. Keeping with our constant supply and demand theme, remember that a trend on any time frame is really a supply and demand imbalance moving back into a price level of temporary balance. This is a larger time frame chart but the assessment can be done in any market, and any time frame. Lastly, take a look at a current chart of the S&P or any major equity index market on a weekly/monthly chart, they are strongly suggesting a weak market.
Moving Averages
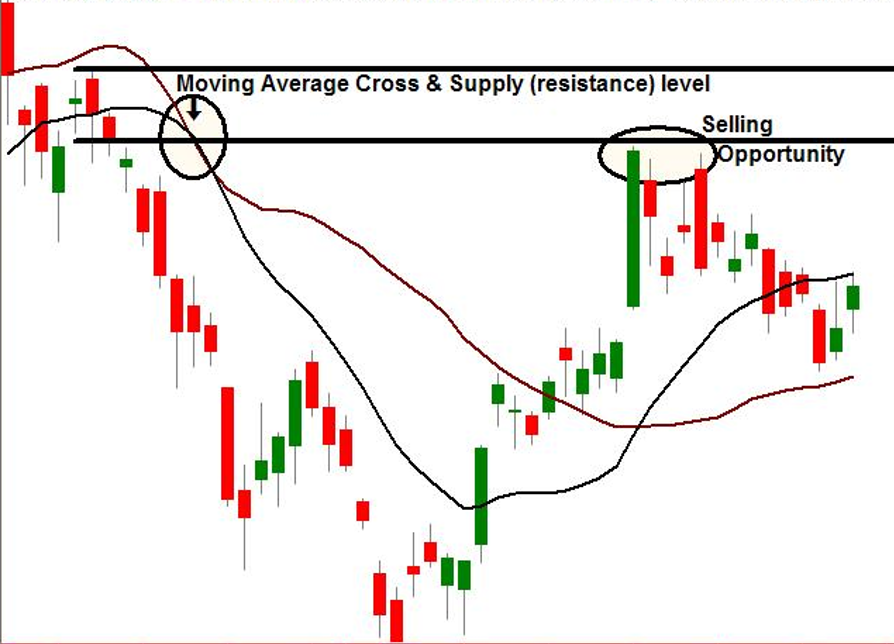
Moving averages (which I don’t use) are another common piece of conventional Technical Analysis (which I don’t use). The two ways most traders use them are first, to determine trend by looking at the slope of the moving average. Second, they use the moving average cross to time an entry (buy or sell signal) into a position or an exit out of a position. This technique is very flawed in that moving averages by definition will lag price; they have to. Adding any tool that lags price to the execution portion of your trading plan adds risk and decreases profit zone and we don’t want that. Again, instead of thinking the same way as your competition, let’s take a slightly different view of moving averages in a way that may help us gain an edge over our competition. Notice in the chart example, I have circled the moving average cross. Moving averages cross because there has been a relatively strong move in price. At the origin of a strong move in price, demand and supply are out of balance. Price levels where demand and supply are out of balance is where we typically find low risk, high reward and high probability trading opportunity. So, try identifying moving average crosses in the past and let that lead you to investigate the price action in that area. Chances are high that you will find a key demand or supply level there. In other words, when you find a moving average cross above or below current price, look slightly to the left of the cross and investigate the price action as that is where the origin of the strong move likely was, which means a demand / supply imbalance.
These are two examples of how you can take conventional Technical Analysis, look at it and use it slightly different than your competition in hopes of attaining an edge. While I don’t use these two examples in my own trading, I make sure that my tools and strategy are VERY different from my competition, almost opposite, but most importantly “reality” based. The purpose of today’s piece was to encourage you to think different and not follow the herd and their very flawed thought process.
Hope this was helpful. Have a great day.

Note: All information on this page is subject to change. The use of this website constitutes acceptance of our user agreement. Please read our privacy policy and legal disclaimer. Opinions expressed at FXstreet.com are those of the individual authors and do not necessarily represent the opinion of FXstreet.com or its management. Risk Disclosure: Trading foreign exchange on margin carries a high level of risk, and may not be suitable for all investors. The high degree of leverage can work against you as well as for you. Before deciding to invest in foreign exchange you should carefully consider your investment objectives, level of experience, and risk appetite. The possibility exists that you could sustain a loss of some or all of your initial investment and therefore you should not invest money that you cannot afford to lose. You should be aware of all the risks associated with foreign exchange trading, and seek advice from an independent financial advisor if you have any doubts.
Editors’ Picks

EUR/USD trims gains, back below 1.1800
EUR/USD now loses some upside momentum, returning to the area below the 1.1800 support as the Greenback manages to regain some composure following the SCOTUS-led pullback earlier in the session.

GBP/USD off highs, recedes to the sub-1.3500 area
Following earlier highs north of 1.3500 the figure, GBP/USD now faces some renewed downside pressure, revisiting the 1.3490 zone as the US Dollar manages to regain some upside impulse in the latter part of the NA session on Friday.

USD/JPY sticks to gains above 155.00, over one-week top ahead of US data
The USD/JPY pair gains positive traction for the third straight day and climbs to over a one-week top, around the 155.35-155.40 region. Data released early today showed that Japan’s key inflation gauge eased to the slowest pace in two years, tempering expectations for an immediate policy tightening by the Bank of Japan.
Editors’ Picks

EUR/USD: US Dollar comeback in the makes? Premium
The US Dollar (USD) stands victorious at the end of another week, with the EUR/USD pair trading near a four-week low of 1.1742, while the USD retains its strength despite some discouraging American data released at the end of the week.

Gold: Escalating geopolitical tensions help limit losses Premium
Gold (XAU/USD) struggled to make a decisive move in either direction this week as it quickly recovered above $5,000 after posting losses on Monday and Tuesday.

GBP/USD: Pound Sterling braces for more pain, as 200-day SMA tested Premium
The Pound Sterling (GBP) crashed to its lowest level in a month against the US Dollar (USD), as critical support levels were breached in a data-packed week.

Bitcoin: No recovery in sight
Bitcoin (BTC) price continues to trade within a range-bound zone, hovering around $67,000 at the time of writing on Friday, and falling slightly so far this week, with no signs of recovery.

US Dollar: Tariffed. Now What? Premium
The US Dollar (USD) reversed its previous week’s decline, managing to stage a meaningful rebound and retesting the area just above the 98.00 barrier when tracked by the US Dollar Index (DXY).
RECOMMENDED LESSONS
Making money in forex is easy if you know how the bankers trade!
I’m often mystified in my educational forex articles why so many traders struggle to make consistent money out of forex trading. The answer has more to do with what they don’t know than what they do know. After working in investment banks for 20 years many of which were as a Chief trader its second knowledge how to extract cash out of the market.
5 Forex News Events You Need To Know
In the fast moving world of currency markets where huge moves can seemingly come from nowhere, it is extremely important for new traders to learn about the various economic indicators and forex news events and releases that shape the markets. Indeed, quickly getting a handle on which data to look out for, what it means, and how to trade it can see new traders quickly become far more profitable and sets up the road to long term success.
Top 10 Chart Patterns Every Trader Should Know
Chart patterns are one of the most effective trading tools for a trader. They are pure price-action, and form on the basis of underlying buying and selling pressure. Chart patterns have a proven track-record, and traders use them to identify continuation or reversal signals, to open positions and identify price targets.
7 Ways to Avoid Forex Scams
The forex industry is recently seeing more and more scams. Here are 7 ways to avoid losing your money in such scams: Forex scams are becoming frequent. Michael Greenberg reports on luxurious expenses, including a submarine bought from the money taken from forex traders. Here’s another report of a forex fraud. So, how can we avoid falling in such forex scams?
What Are the 10 Fatal Mistakes Traders Make
Trading is exciting. Trading is hard. Trading is extremely hard. Some say that it takes more than 10,000 hours to master. Others believe that trading is the way to quick riches. They might be both wrong. What is important to know that no matter how experienced you are, mistakes will be part of the trading process.
The challenge: Timing the market and trader psychology
Successful trading often comes down to timing – entering and exiting trades at the right moments. Yet timing the market is notoriously difficult, largely because human psychology can derail even the best plans. Two powerful emotions in particular – fear and greed – tend to drive trading decisions off course.