Pivot Points, one of the basic and most important technical tools and the important one, is in the was used long before the era of computerized trading. The mathematical calculation of various support and resistance levels, based on the high, the low and the closing prices of the previous period, was initially used by floor traders in order to trade efficiently. The indicator was strong enough to be considered for included in technical analysis, resulting it to be and as a result you can find it present in the majority of trading platform. The basic use purpose of Pivot Points (PP) is to determine the important support and resistance levels. It is also used to determine market sentiment: as during the trending market,when the market is trending prices would will fluctuate from support PP to resistance PP, while in times of whereas when the market is directionless or ranging market, prices usually fluctuate around two PPs until a breakout happens. If prices are trading above the pivot point it is considered to carry bullish sentiment, while trading below the pivot point usually suggests indicates bearish sentiment. Moreover, Pivot Points are also an important technical tool for placing trade orders.
Calculation
Although there are several methods for calculating Pivot Points, the most common of them is the Standard Pivot Point system. It uses the simple arithmetic average of the high, the low and the closing prices of the previous trading period in order to determine the Pivot Point, i.e. the very base for calculating various support (S) and resistance (R) levels. Daily PPs are usually calculated based on the New York closing time, i.e. 16.00 EST (22.00 CEST).
- Pivot point (PP) = (High + Low + Close) / 3
- First resistance (R1) = (2 x PP) – Low
- First support (S1) = (2 x PP) - High
- Second level of support and resistance:
- Second resistance (R2) = PP + (High - Low)
- Second support (S2) = PP - (High - Low)
- Third level of support and resistance:
- Third resistance (R3) = High + 2(PP - Low)
- Third support (S3) = Low - 2(High - PP)
Types of Pivot Points
This mathematical calculation applies only to Standard PPs.. With the invention of computerized trading a lot of other PPs have been developed to assist traders:
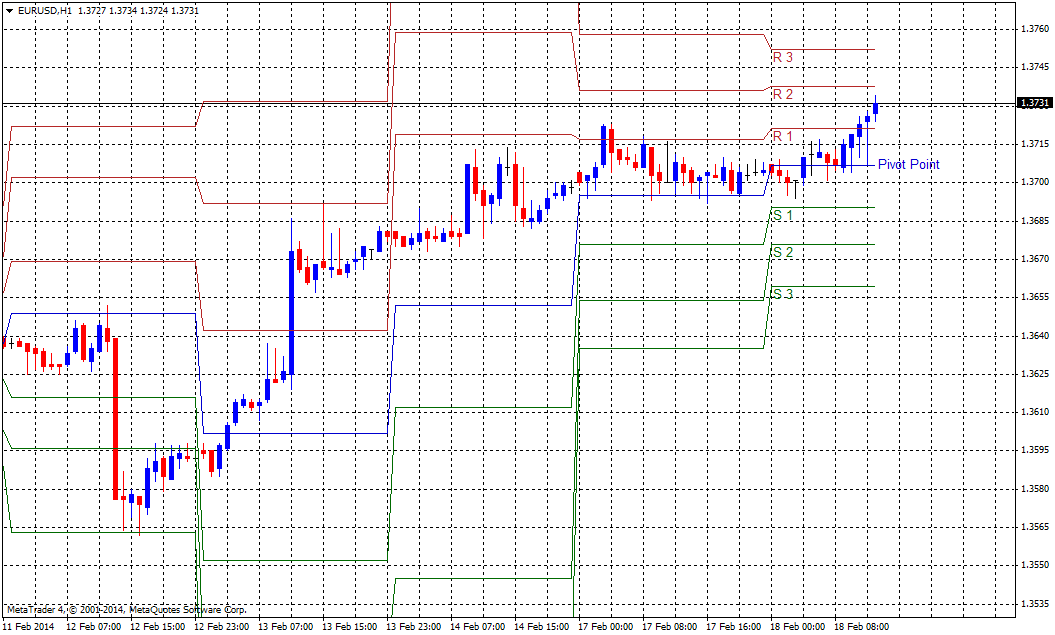
Standard PP indicators: The very basic Pivot Point calculation starts with the Standard PP Indicators that are identical to the ones described above. These Pivot Points are the corner stone for the rest of the PP calculations. Even though the Standard PP is very helpful, it still has its own limitations as it is a mathematical calculation that sometimes misses the important support and resistance levels. In the example below, we can see six potential Standard PPs plotted on a EURUSD H1 chart.
Fibonacci PPs: Fibonacci Pivot Points are an extension of the standard PPs where Fibonacci multiples of the high-low differential are considered to form various support (S) and resistance (R) levels. You can calculate the Fibonacci PPs in the following way:
- Pivot Point (PP) = (High + Low + Close)/3
- Support 1 (S1) = P - {.382 * (High - Low)}
- Support 2 (S2) = P - {.618 * (High - Low)}
- Support 3 (S3) = P - {1 * (High - Low)}
- Resistance 1 (R1) = P + {.382 * (High - Low)}
- Resistance 2 (R2) = P + {.618 * (High - Low)}
- Resistance 3 (R3) = P + {1 * (High - Low)
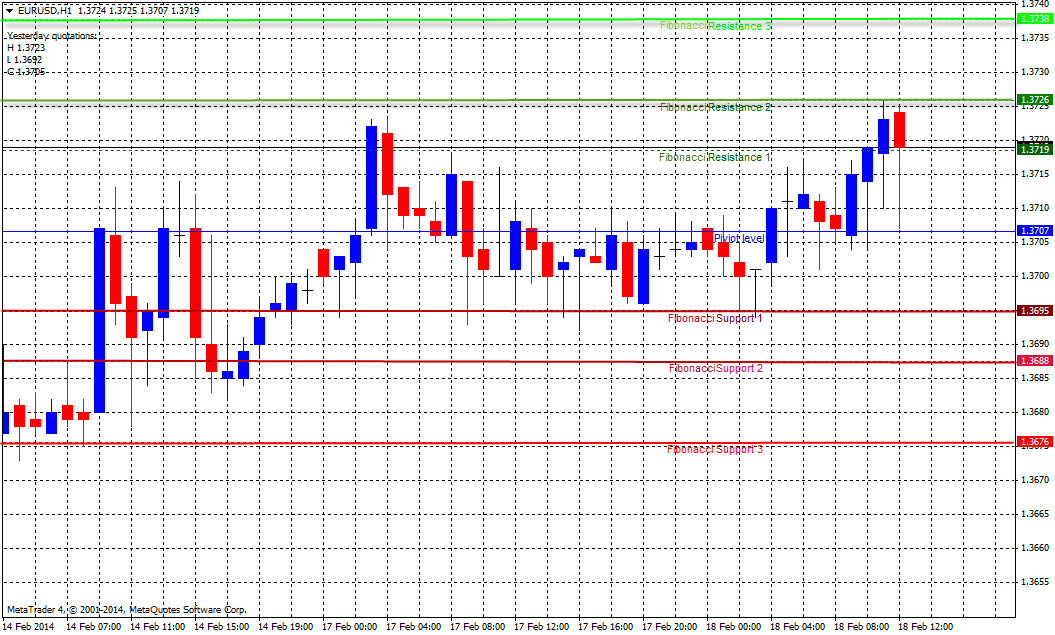
In the example below, we can see six potential Fibonacci PPs plotted on a EURUSD H1 chart. Even though the Fibonacci levels are blend with Pivot Points, these Fibonacci PPs are unable to mark all the important support and resistance levels.
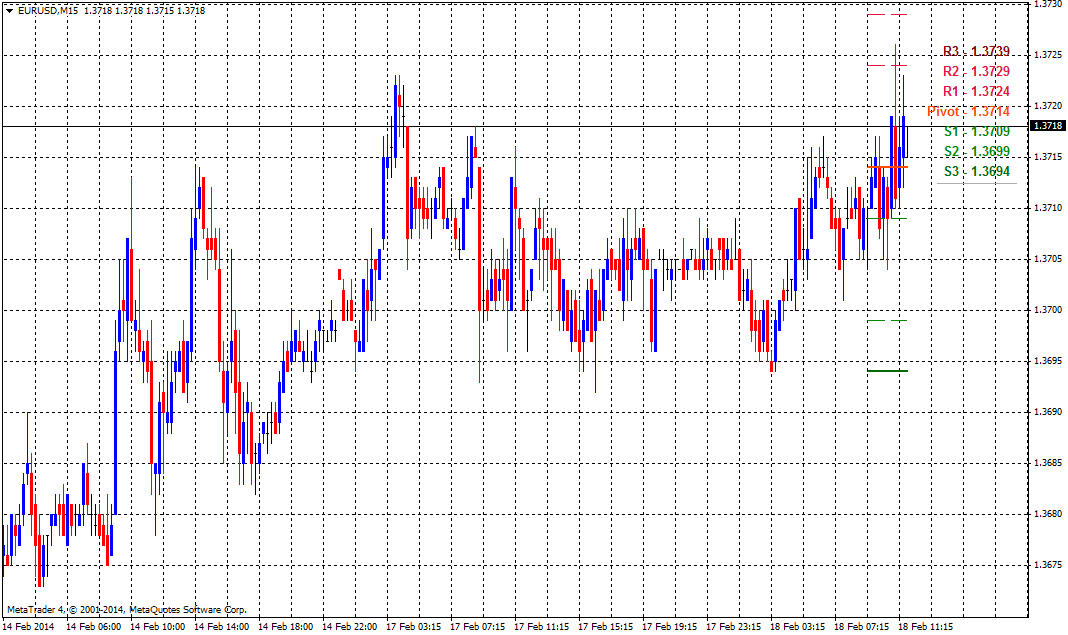
Hourly PP: These pivot levels are accurate enough for smaller time frames and can help traders capitalize on the little movements of the pair. Hence, Hourly Pivot Points are mainly used for Scalping. The Basic Calculations are as simple as the standard time frame but in this case the high, the low and the closing prices of the previous hour are considered in plotting various support and resistance points. In the example below, we can see six potential Hourly PPs plotted on a EURUSD M15 chart. We can see that major supports and resistances took place near the Hourly PPs, which proves the importance of this indicator. Due to the perfection in smaller timeframes, these PPs become less helpful while plotting on higher time frames (Daily, Weekly, Monthly, etc.).
WOODIE Pivot Point: While all the mentioned PPs consider only the high, the low and the closing prices for calculation, Woodie Pivot Points consider all the four indicators for movement: open, high, low and closing prices. High and low prices usually show the extreme moods of traders and hence fail to mark the important levels. Open and closing prices are considered to represent traders’ intentions more accurately, which makes Woodie Pivot Point popular among traders. The following EURUSD M15 chart describes major support and resistance levels covered by the Woodie PP. Despite all the advantages, the simplicity of the Woodie PP makes it less famous than, for example, Camarilla or Murray Math PP. In addition to that the Woodie PP doesn’t propose any strategy as other advanced PP do, which also makes it less useful for big banks and professional traders.

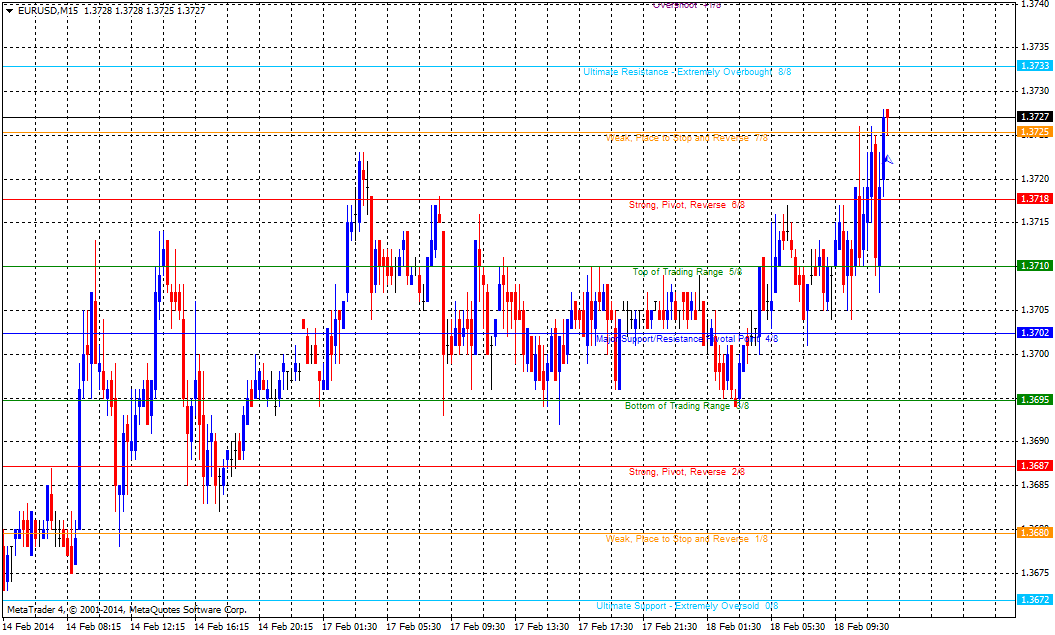
Murrey Math PP: One more technical indicator based on the Pivot Point is Murrey Math. It tackles with a lot of limitations of Standard, Hourly and Fibonacci PPs. and is widely used by professional traders and big banks. The indicator is divided into eight lines that mark multiple support and resistance levels. It also mentions the major reversing point (Line 4/4) and the Ultimate Support and Ultimate Resistance lines (line 0/8 and line 8/8 respectively). As you can notice on a EURUSD M15 chart below, the major support and resistance levels are covered by the Murrey Math PP. The indicator divides the chart in nine equidistant lines, from the bottom are at the levels 0/8, 1/8, 2/8, 3/8, 4/8, 5/8, 6/8, 7/8 and 8/8. The mentioned PP lines can indicate when to go long/short as well as important stop-loss and take profit points.
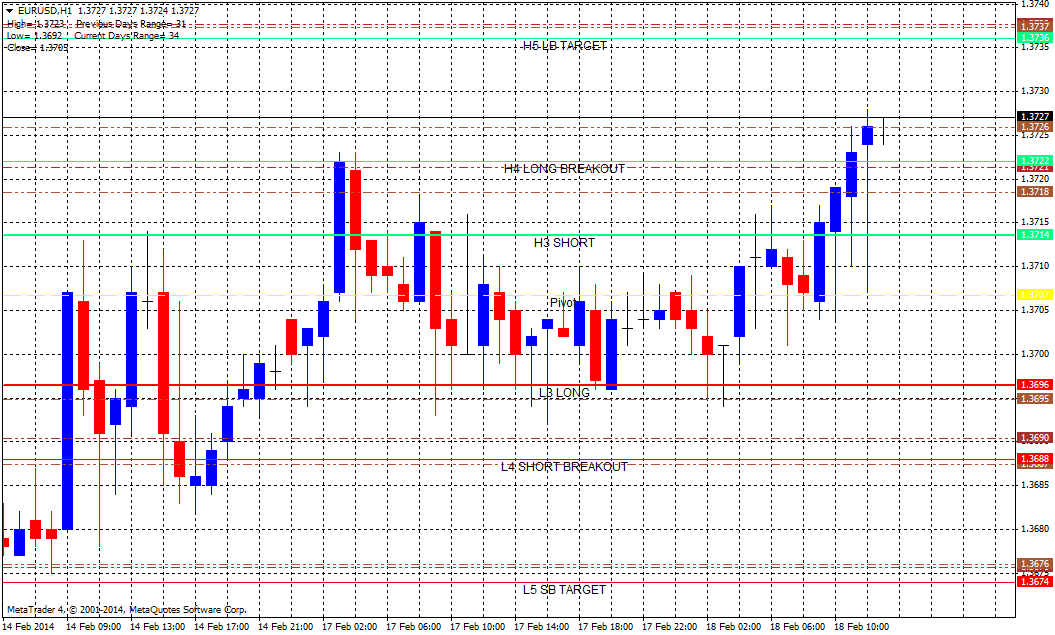
Camarilla: Camarilla is one more advanced PP indicator which helps traders in Scalping and Day trading. It is also one of the renowned technical indicators for professional traders at big financial institutions and banks. It is a price-based indicator for defining the trading levels. Each point calls for specific actions and hence becomes different from the rest of the PPs. The mentioned PP lines can indicate when to go long/short as well as where important stop-loss and take profit points are. You can calculate various levels with Camilla Technical Indicator in the following way:
H5 = (High/Low) × Close
H4 = Close + RANGE × 1.1/2
H3 = Close + RANGE × 1.1/4
L3 = Close – RANGE × 1.1/4
L4 = Close – RANGE × 1.1/2
L5 = Close – (H5 – Close)
The following H1 EURUSD chart describes how Camarilla marked the important support and resistance levels together proposing important trading strategies.
Concluding Remarks
Contrary to the popular perception, pivot points don’t only calculate various support and resistance levels, but also offer some valuable trading strategies. Furthermore, various types of PPs help traders in capitalizing on the movement of different currency pairs. Moreover, using only Pivot Points for confirmation is not enough for making a wise trading decision. It should also be backed by other technical indicators like, moving averages, RSI, MACD, etc.
The analysis and the article presents Nenad's opinion. Remember, financial trading is highly speculative & may lead to the loss of your funds. Proper risk management is the Holy Grail of trading.
Editors’ Picks

EUR/USD bounces off lows, back to 1.1860
EUR/USD now manages to regain some balance, retesting the 1.1860-1.1870 band after bottoming out near 1.1830 following the US NFP data on Wednesday. The pair, in the meantime, remains on the defensive amid fresh upside traction surrounding the US Dollar.

GBP/USD rebounds to 1.3660, USD loses momentum
GBP/USD trades with decent gains in the 1.3660 region, regaining composure following the post-NFP knee-jerk toward the 1.3600 zone on Wednesday. Cable, in the meantime, should now shift its attention to key UK data due on Thursday, including preliminary GDP gauges.

Gold stays bid, still below $5,100
Gold keeps the bid tone well in place on Wednesday, retargeting the $5,100 zone per troy ounce on the back of humble gains in the US Dollar and firm US Treasury yields across the curve. Moving forward, the yellow metal’s next test will come from the release of US CPI figures on Friday.

Ripple Price Forecast: XRP sell-side pressure intensifies despite surge in addresses transacting on-chain
Ripple (XRP) is edging lower around $1.36 at the time of writing on Wednesday, weighed down by low retail interest and macroeconomic uncertainty, which is accelerating risk-off sentiment.

US jobs data surprises to the upside, boosts stocks but pushes back Fed rate cut expectations
This was an unusual payrolls report for two reasons. Firstly, because it was released on Wednesday, and secondly, because it included the 2025 revisions alongside the January NFP figure.
RECOMMENDED LESSONS
Making money in forex is easy if you know how the bankers trade!
I’m often mystified in my educational forex articles why so many traders struggle to make consistent money out of forex trading. The answer has more to do with what they don’t know than what they do know. After working in investment banks for 20 years many of which were as a Chief trader its second knowledge how to extract cash out of the market.
5 Forex News Events You Need To Know
In the fast moving world of currency markets where huge moves can seemingly come from nowhere, it is extremely important for new traders to learn about the various economic indicators and forex news events and releases that shape the markets. Indeed, quickly getting a handle on which data to look out for, what it means, and how to trade it can see new traders quickly become far more profitable and sets up the road to long term success.
Top 10 Chart Patterns Every Trader Should Know
Chart patterns are one of the most effective trading tools for a trader. They are pure price-action, and form on the basis of underlying buying and selling pressure. Chart patterns have a proven track-record, and traders use them to identify continuation or reversal signals, to open positions and identify price targets.
7 Ways to Avoid Forex Scams
The forex industry is recently seeing more and more scams. Here are 7 ways to avoid losing your money in such scams: Forex scams are becoming frequent. Michael Greenberg reports on luxurious expenses, including a submarine bought from the money taken from forex traders. Here’s another report of a forex fraud. So, how can we avoid falling in such forex scams?
What Are the 10 Fatal Mistakes Traders Make
Trading is exciting. Trading is hard. Trading is extremely hard. Some say that it takes more than 10,000 hours to master. Others believe that trading is the way to quick riches. They might be both wrong. What is important to know that no matter how experienced you are, mistakes will be part of the trading process.
The challenge: Timing the market and trader psychology
Successful trading often comes down to timing – entering and exiting trades at the right moments. Yet timing the market is notoriously difficult, largely because human psychology can derail even the best plans. Two powerful emotions in particular – fear and greed – tend to drive trading decisions off course.
