Every morning traders wake up looking at their charts in an effort to find opportunities. They are faced with making decisions on whether to go long or short the particular markets they trade. This can be challenging as the markets are in a constant state of motion. One day up, the next down, and on some days the market can change direction intraday. So, with markets constantly changing it’s important that a trader gain the right perspective to start every day.
One way to do that is to look at the big picture. This means looking at daily, weekly or monthly charts. The objective here is to identify the environment a trader is going to encounter. This will enable them to be better prepared to tackle the day’s trading challenges. If you think about it, the markets can only be in two types of environments: trending or in a range (sideways market).
A common misconception many traders have is that they think the markets tend to trend more often than they’re in a range. Regression studies have actually shown that this not the case. Markets generally have larger spells were they are range bound. In looking at larger timeframe trends (weekly and monthly) in the stock index futures or currencies, what you will find is that these markets spend weeks, sometimes months going sideways before they resume the next leg of the trend. Look at the charts and you will see the sideways market for yourself. If this is indeed the case, then traders need to know where the lowest risk trades are found in this environment.
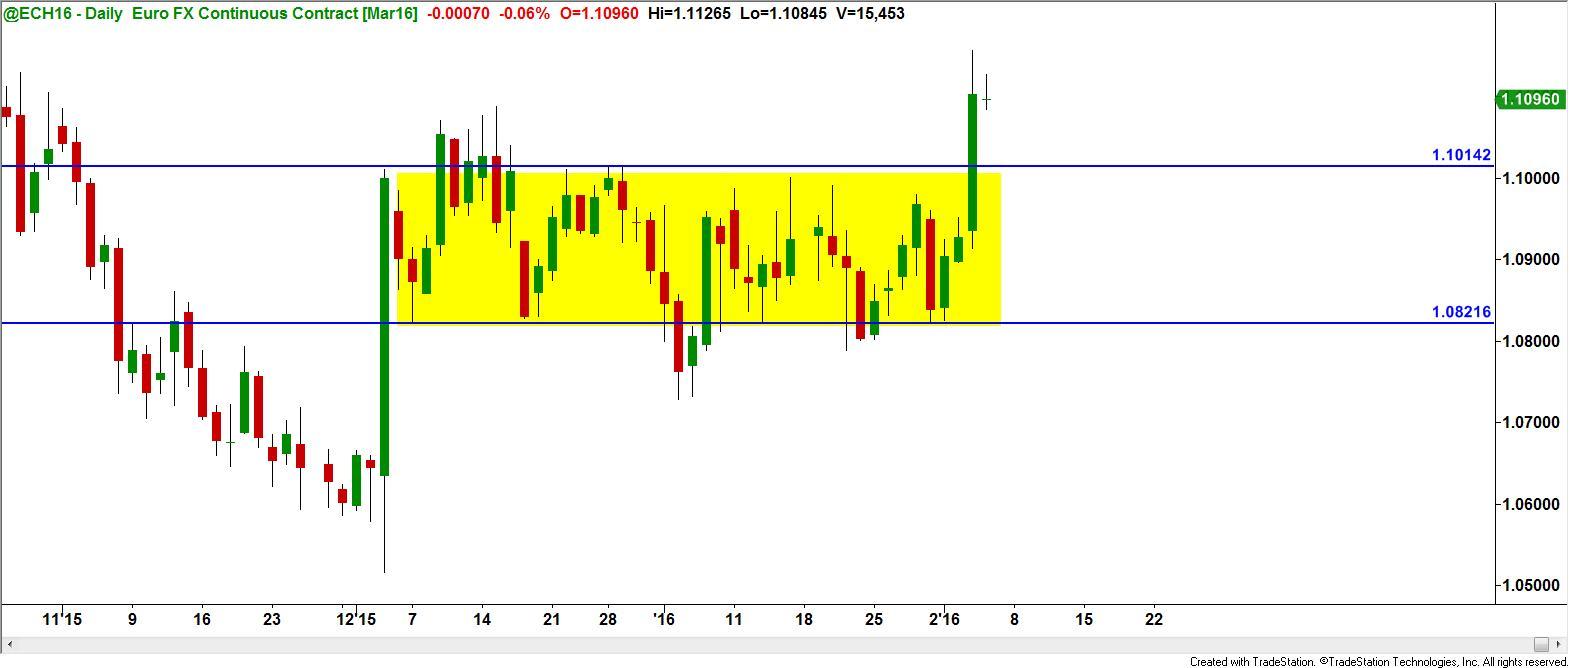
Recently the Euro Currency futures contract has been in a large range for about a month. We can see this on the daily chart below.
In this type of environment the lowest risk, highest probability trades would be at the top and bottom of the range. In other words, look to buy at the bottom of the range and short as we near the top of the range.
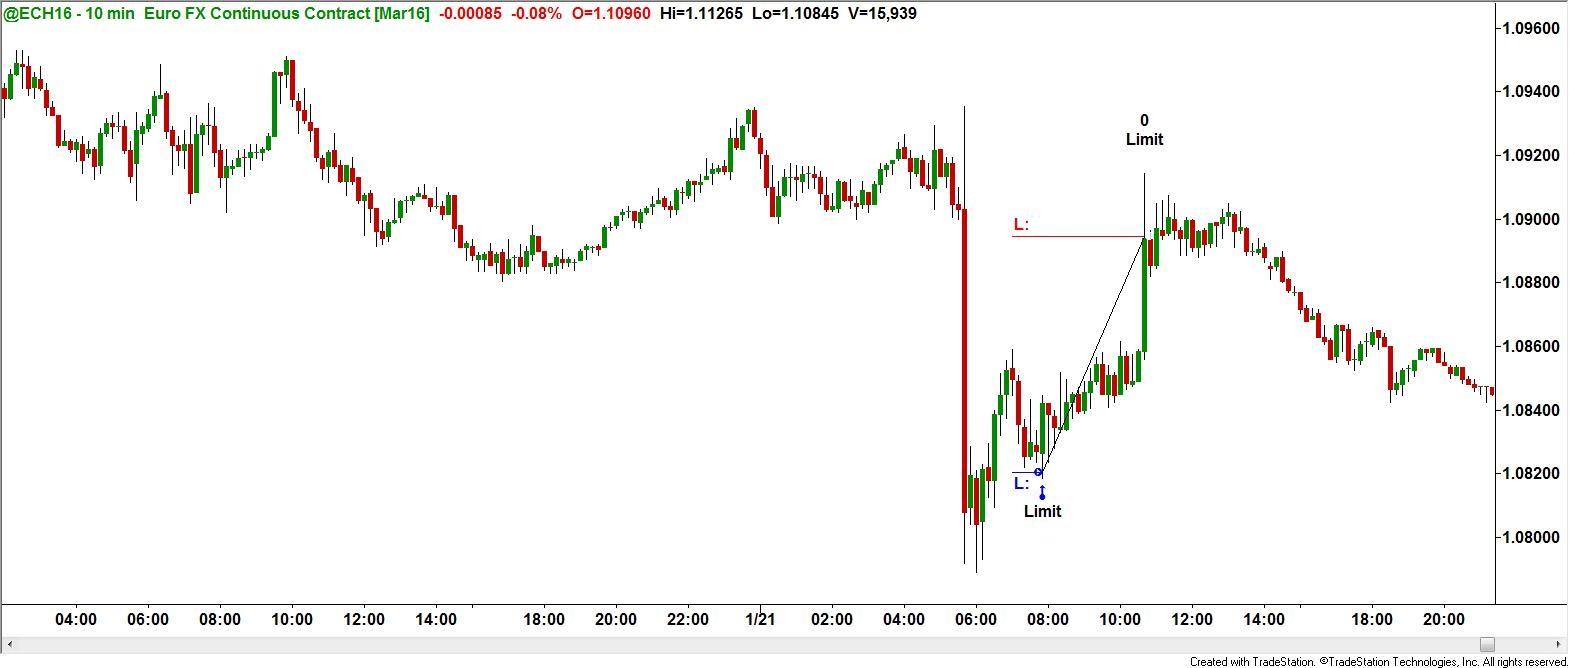
Implementing this strategy, I recently took a trade look in the Euro Futures near the lower part of the range. As we can see from the chart, I took the entry at the origin of a strong move in price (demand) and achieved the profit target right below a supply zone identified by the strong move lower.
Also of note is that the demand zone was located near the lower extremity of the range.
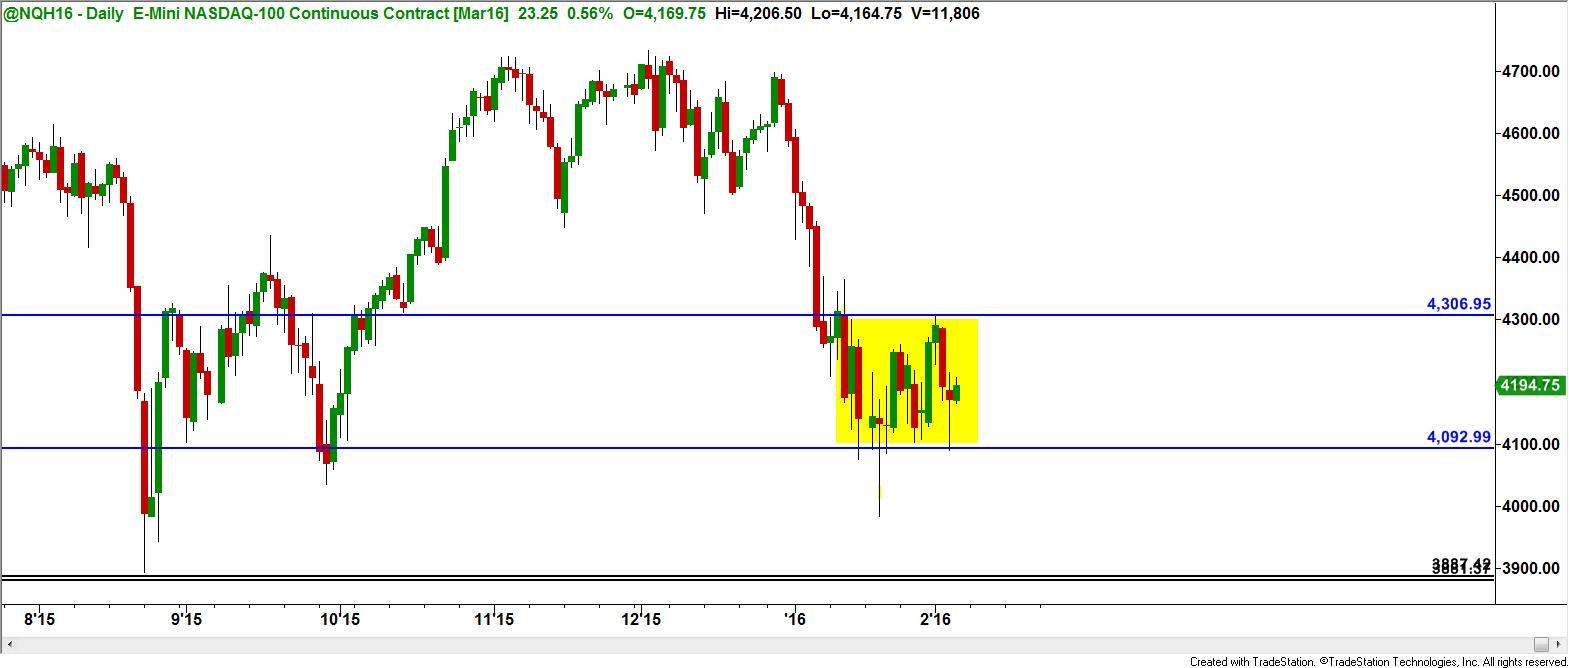
In the next example, we see the Nasdaq mini futures also in a daily range.
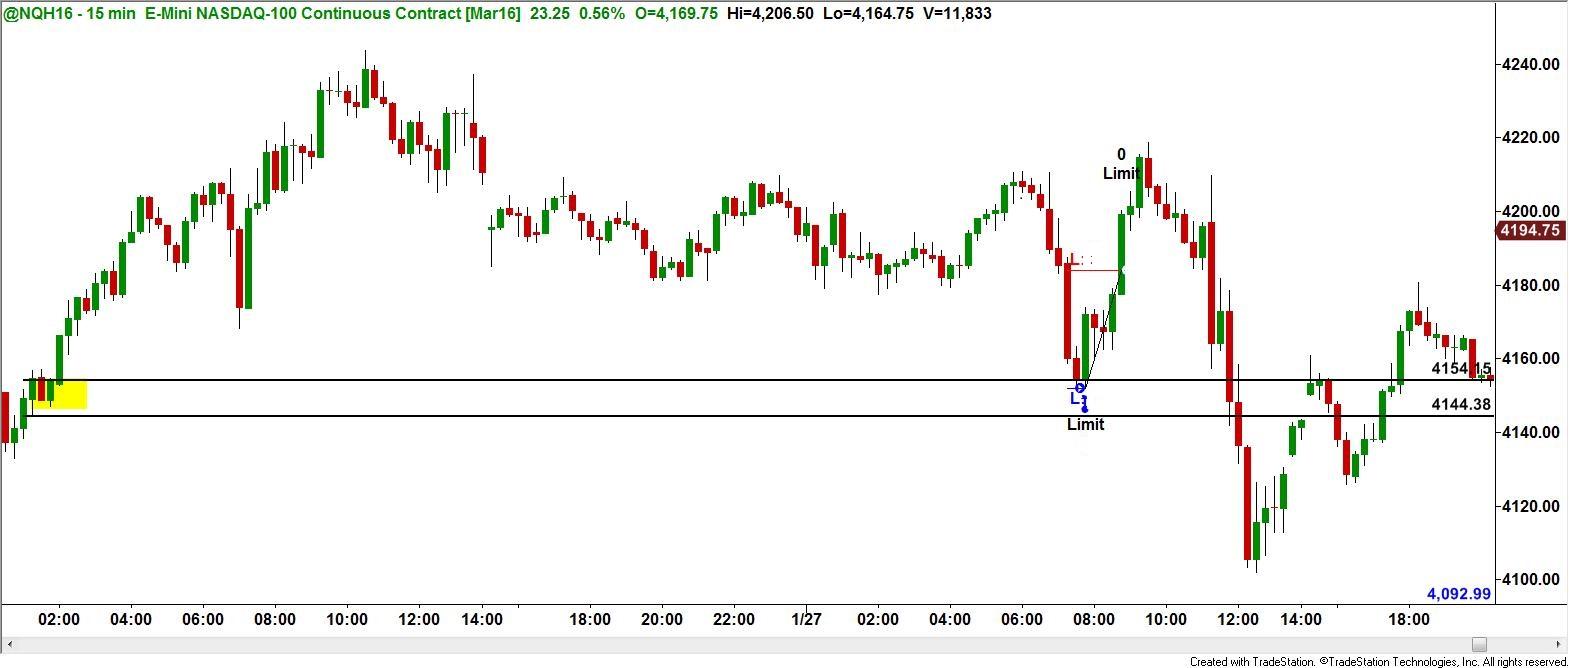
Similarly, an opportunity at the lower part of the sideways market presented itself and I took that trade as well. As we can see from the lower chart, the demand zone (highlighted by the two horizontal lines) was the entry and the target was achieved at the opposing level of supply.
As we can see, having the right perspective can assist us in finding low risk trading opportunities. This requires learning a rules based strategy that is consistent in its approach. In this missive, we focused on range-bound or sideways markets. In the next one, we’ll tackle trending markets and how to trade those. Stay tuned…
Until next time, I hope everyone has a great week.
This content is intended to provide educational information only. This information should not be construed as individual or customized legal, tax, financial or investment services. As each individual's situation is unique, a qualified professional should be consulted before making legal, tax, financial and investment decisions. The educational information provided in this article does not comprise any course or a part of any course that may be used as an educational credit for any certification purpose and will not prepare any User to be accredited for any licenses in any industry and will not prepare any User to get a job. Reproduced by permission from OTAcademy.com click here for Terms of Use: https://www.otacademy.com/about/terms
Editors’ Picks

EUR/USD: US Dollar comeback in the makes? Premium
The US Dollar (USD) stands victorious at the end of another week, with the EUR/USD pair trading near a four-week low of 1.1742, while the USD retains its strength despite some discouraging American data released at the end of the week.

Gold: Escalating geopolitical tensions help limit losses Premium
Gold (XAU/USD) struggled to make a decisive move in either direction this week as it quickly recovered above $5,000 after posting losses on Monday and Tuesday.

GBP/USD: Pound Sterling braces for more pain, as 200-day SMA tested Premium
The Pound Sterling (GBP) crashed to its lowest level in a month against the US Dollar (USD), as critical support levels were breached in a data-packed week.

Bitcoin: No recovery in sight
Bitcoin (BTC) price continues to trade within a range-bound zone, hovering around $67,000 at the time of writing on Friday, and falling slightly so far this week, with no signs of recovery.

US Dollar: Tariffed. Now What? Premium
The US Dollar (USD) reversed its previous week’s decline, managing to stage a meaningful rebound and retesting the area just above the 98.00 barrier when tracked by the US Dollar Index (DXY).
RECOMMENDED LESSONS
Making money in forex is easy if you know how the bankers trade!
I’m often mystified in my educational forex articles why so many traders struggle to make consistent money out of forex trading. The answer has more to do with what they don’t know than what they do know. After working in investment banks for 20 years many of which were as a Chief trader its second knowledge how to extract cash out of the market.
5 Forex News Events You Need To Know
In the fast moving world of currency markets where huge moves can seemingly come from nowhere, it is extremely important for new traders to learn about the various economic indicators and forex news events and releases that shape the markets. Indeed, quickly getting a handle on which data to look out for, what it means, and how to trade it can see new traders quickly become far more profitable and sets up the road to long term success.
Top 10 Chart Patterns Every Trader Should Know
Chart patterns are one of the most effective trading tools for a trader. They are pure price-action, and form on the basis of underlying buying and selling pressure. Chart patterns have a proven track-record, and traders use them to identify continuation or reversal signals, to open positions and identify price targets.
7 Ways to Avoid Forex Scams
The forex industry is recently seeing more and more scams. Here are 7 ways to avoid losing your money in such scams: Forex scams are becoming frequent. Michael Greenberg reports on luxurious expenses, including a submarine bought from the money taken from forex traders. Here’s another report of a forex fraud. So, how can we avoid falling in such forex scams?
What Are the 10 Fatal Mistakes Traders Make
Trading is exciting. Trading is hard. Trading is extremely hard. Some say that it takes more than 10,000 hours to master. Others believe that trading is the way to quick riches. They might be both wrong. What is important to know that no matter how experienced you are, mistakes will be part of the trading process.
The challenge: Timing the market and trader psychology
Successful trading often comes down to timing – entering and exiting trades at the right moments. Yet timing the market is notoriously difficult, largely because human psychology can derail even the best plans. Two powerful emotions in particular – fear and greed – tend to drive trading decisions off course.


