Open Interest is an indicator that calculates the number of Futures contracts that have been entered into, but have not yet been offset or delivered against.
As a day trader you may enter the market with a purchase of a Futures contract. To offset your position you simply need to sell this same Futures contract at a later time in the day. Your transaction will increase volume for that day, but will have no impact on open interest.
For a swing trader or investor they will be holding positions overnight. By creating a Futures contract they will also increase volume for that trading session, but because they have not offset their position yet and will be holding the position overnight they will increase open interest by the number of contracts they are holding.
Open interest gets a little more confusing when calculating the change in this indicator. The following events will have an impact on open interest:
If both traders are initiating a new position (one new buyer and one new seller), open interest will increase by one
If both traders are off-setting their positions (one old buyer and one old seller), then open interest will decrease by one
If a trader exits their old position and a new trader is on the other side (one old seller buys from a new seller) or (one old buyer sells to a new buyer), either of these events will cause open interest to remain unchanged
As an indicator a trader can use open interest to look for divergence in price and open interest after extended periods of a trending market. For example, if the market is trending higher in price and open interest fails to make new highs with the new price highs this could be a divergence that signals the trend may be ending.
Open interest is also used to analyze the weekly Commitment of Traders report (COT) that is released by the Commodity Futures Trading Commission (CFTC).
I would like to discuss the proper way to locate open interest for traders wishing to pursue the understanding of this indicator. This indicator is available on most charting packages. However, most charting packages give us the wrong open interest indicator to use.
The two types of open interest that are available are called:
Contract Specific
Cumulative
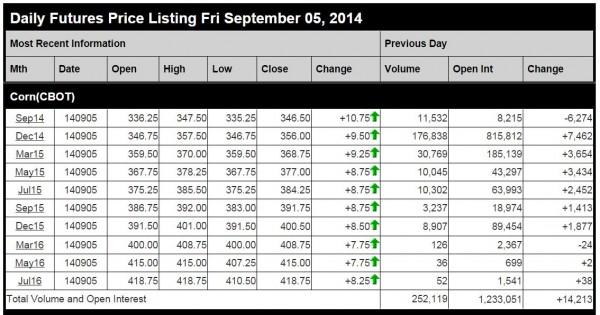
Figure 1 is a snapshot of Moore Research’s (www.mrci.com) end of day prices. These are available for free on their website. I would like to thank MRCI for permission to use their data for this article.
I chose Corn due to the time of the year and contract expiration. Most speculators would not be trading the September contract due to the lower volume each year this contract month has.
To find contract specific open interest you would look across the line where Sep14 is displayed until you come to the column Open Int. The number (8,215) you see is the number of open contracts in the contract expiring in September 2014. Therefore this is only referencing the open interest for this specific month – Contract Specific.
To find cumulative open interest you would look at the bottom of Figure 1 and locate “Total Volume and Open Interest”. Scroll across until you find the Open Int column and you will find the number (1,233,051) representing all of the Corn contracts traded open interest – Cumulative Open Interest.
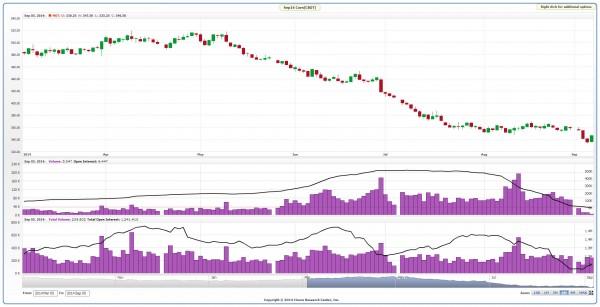
Figure 2 is a free chart that is available from MRCI as well when you click on the link of the contracts listed in Figure 1. For example, if you were to go to their website and click on Sep14 the link will take you to this chart.
With Figure 2 I would like to show you why we only want to use cumulative open interest for our analysis of the markets.
Price for the Sep14 Corn contract is represented by the candles. Below the candles you see two windows. Both have purple vertical bars representing the daily volume and a black line representing the open interest.
The top window is contract specific and the lower window is the cumulative window.
If a trader were going to use open interest to find a divergence in price then the indicator they would want to use is the lower window. Notice how the black line moves up and down with the candles above it. We can see the traders entering the market with new positions as the line ascends and we can see the traders leaving their positions as the black line descends. We can now find potential divergences on this window that could signal a trend change. This is because we are tracking cumulative open interest and not contract specific in the lower window.
The upper window is plotting the contract specific open interest. Notice on the left of the chart how low the volume and open interest are. This is because on those dates there was another front month contract where the majority of volume was trading. As September came closer to being a front month the majority of volume and open interest came into this contract as seen by the rising volume and black line around June 30 when the July14 contract was getting First Notice Day.
But notice on the right side of the chart how the open interest starts to drop off just as fast near the end of August. This is First Notice Day for the September contract and speculators would be forced out of this specific contract or face taking delivery. So the open interest line in a contract specific window is only following the contract as it becomes the new front month and then as it goes into expiration tracks traders leaving that contract. This does not give a trader any valuable information about the strength or weakness of the overall Corn market.
When using the open interest indicator a trader would find it much more beneficial to use the cumulative open interest indicator. Many of our chart packages only give the contract specific open interest. This is why I use the MRCI free website when I want to see the cumulative open interest.
“Happy are those who dream dreams and are ready to pay the price to make them come true.” Lean Suenens
This content is intended to provide educational information only. This information should not be construed as individual or customized legal, tax, financial or investment services. As each individual's situation is unique, a qualified professional should be consulted before making legal, tax, financial and investment decisions. The educational information provided in this article does not comprise any course or a part of any course that may be used as an educational credit for any certification purpose and will not prepare any User to be accredited for any licenses in any industry and will not prepare any User to get a job. Reproduced by permission from OTAcademy.com click here for Terms of Use: https://www.otacademy.com/about/terms
Editors’ Picks

EUR/USD: US Dollar comeback in the makes? Premium
The US Dollar (USD) stands victorious at the end of another week, with the EUR/USD pair trading near a four-week low of 1.1742, while the USD retains its strength despite some discouraging American data released at the end of the week.

Gold: Escalating geopolitical tensions help limit losses Premium
Gold (XAU/USD) struggled to make a decisive move in either direction this week as it quickly recovered above $5,000 after posting losses on Monday and Tuesday.

GBP/USD: Pound Sterling braces for more pain, as 200-day SMA tested Premium
The Pound Sterling (GBP) crashed to its lowest level in a month against the US Dollar (USD), as critical support levels were breached in a data-packed week.

Bitcoin: No recovery in sight
Bitcoin (BTC) price continues to trade within a range-bound zone, hovering around $67,000 at the time of writing on Friday, and falling slightly so far this week, with no signs of recovery.

US Dollar: Tariffed. Now What? Premium
The US Dollar (USD) reversed its previous week’s decline, managing to stage a meaningful rebound and retesting the area just above the 98.00 barrier when tracked by the US Dollar Index (DXY).
RECOMMENDED LESSONS
Making money in forex is easy if you know how the bankers trade!
I’m often mystified in my educational forex articles why so many traders struggle to make consistent money out of forex trading. The answer has more to do with what they don’t know than what they do know. After working in investment banks for 20 years many of which were as a Chief trader its second knowledge how to extract cash out of the market.
5 Forex News Events You Need To Know
In the fast moving world of currency markets where huge moves can seemingly come from nowhere, it is extremely important for new traders to learn about the various economic indicators and forex news events and releases that shape the markets. Indeed, quickly getting a handle on which data to look out for, what it means, and how to trade it can see new traders quickly become far more profitable and sets up the road to long term success.
Top 10 Chart Patterns Every Trader Should Know
Chart patterns are one of the most effective trading tools for a trader. They are pure price-action, and form on the basis of underlying buying and selling pressure. Chart patterns have a proven track-record, and traders use them to identify continuation or reversal signals, to open positions and identify price targets.
7 Ways to Avoid Forex Scams
The forex industry is recently seeing more and more scams. Here are 7 ways to avoid losing your money in such scams: Forex scams are becoming frequent. Michael Greenberg reports on luxurious expenses, including a submarine bought from the money taken from forex traders. Here’s another report of a forex fraud. So, how can we avoid falling in such forex scams?
What Are the 10 Fatal Mistakes Traders Make
Trading is exciting. Trading is hard. Trading is extremely hard. Some say that it takes more than 10,000 hours to master. Others believe that trading is the way to quick riches. They might be both wrong. What is important to know that no matter how experienced you are, mistakes will be part of the trading process.
The challenge: Timing the market and trader psychology
Successful trading often comes down to timing – entering and exiting trades at the right moments. Yet timing the market is notoriously difficult, largely because human psychology can derail even the best plans. Two powerful emotions in particular – fear and greed – tend to drive trading decisions off course.


