Newer traders sometimes struggle when trying to identify supply and demand zones. My best advice is to practice and see if your zones are lining up with those identified by your instructors in the Extended Learning Track or the Pro Picks.
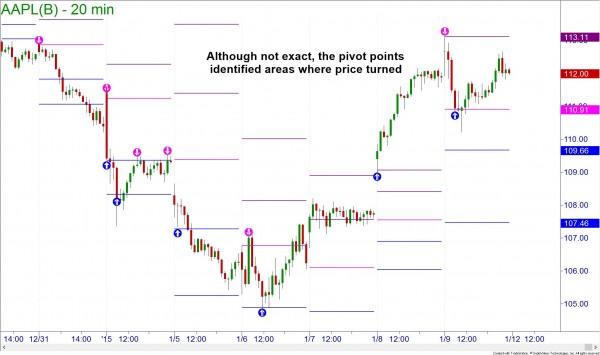
There is also an additional method to identify potential turning points in the markets. This method is not to replace identifying supply and demand, but is rather a way to supplement and perhaps to confirm those levels. This is not a magical tool that will work all the time. The tool/method I am talking about is floor trader pivot points.
The pivot points were created to give professional floor traders at exchanges a way to determine possible support and resistance without having to refer to charts. You may notice that I used the terms support and resistance rather than demand and supply as these are not the same things. The terms support and resistance refer to traditional technical analysis techniques and have been shown by many traders not to be as accurate as the patented supply and demand strategy from Online Trading Academy.
That being said, the support and resistance of pivot points may help to identify or even strengthen supply and demand zones found in your charts. The pivot point itself is simply the previous day’s high + the previous day’s low + the previous day’s close divided by three. This pivot point can act as a support or resistance level for price and can be applied to equities, Forex, and futures charts. Wait a minute! Not so fast, don’t the futures and Forex trade 24 hours a day? How can we get a close price? Actually, the trade price at 5:00PM New York time (EST) is used as the “closing time” for our calculations.
By using this pivot point number and some additional mathematical calculations, we can derive several additional support and resistance numbers. In fact, there are calculations for four support and resistance levels. We can use these pivot support and resistance as possible entry and target points for trading.
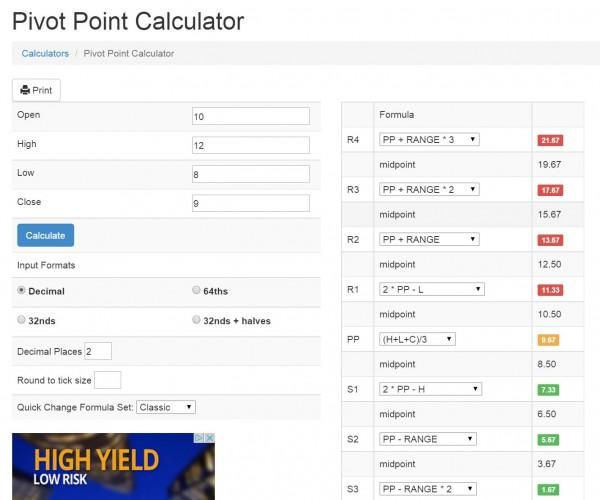
Some trading platforms automatically draw pivot points on your chart for you, but if you are creating your trading plans the night before you can easily add the pivots to your chart. There are several websites that will give you the pivot points. One that I like is www.mypivots.com. On the site there is a pivot point calculator where you can enter the numbers and receive the pivot points for any security.
Although the main use for the pivot points is intraday charting, you could plug in the weekly or even the monthly high, low, and close to determine the future support and resistance for swing and position trading. Remember, these pivot points should not take the place of the supply and demand zones that you visually identify on your charts. Those turning points were caused by the emotions of investors and traders and therefore carry more weight. These people will remember how they triumphed or were hurt at those price levels. Since pivot points do not carry those same emotions with them, they only work if traders believe they work and act in the same manner when price reached those levels.
Fortunately, they have gained enough popularity that they are almost a self-fulfilling prophecy on many stocks and markets. So, while not the end all, pivot points could help you determine the turning points of a stock, sector, index, currency, etc. This can be a valuable tool in your trading arsenal. So until next time, may all your trades be green and your losses small!
Neither Freedom Management Partners nor any of its personnel are registered broker-dealers or investment advisers. I will mention that I consider certain securities or positions to be good candidates for the types of strategies we are discussing or illustrating. Because I consider the securities or positions appropriate to the discussion or for illustration purposes does not mean that I am telling you to trade the strategies or securities. Keep in mind that we are not providing you with recommendations or personalized advice about your trading activities. The information we are providing is not tailored to any individual. Any mention of a particular security is not a recommendation to buy, sell, or hold that or any other security or a suggestion that it is suitable for any specific person. Keep in mind that all trading involves a risk of loss, and this will always be the situation, regardless of whether we are discussing strategies that are intended to limit risk. Also, Freedom Management Partners’ personnel are not subject to trading restrictions. I and others at Freedom Management Partners could have a position in a security or initiate a position in a security at any time.
Editors’ Picks
AUD/USD hovers around 0.6500 amid light trading, ahead of US GDP

AUD/USD is trading close to 0.6500 in Asian trading on Thursday, lacking a clear directional impetus amid an Anzac Day holiday in Australia. Meanwhile, traders stay cautious due ti risk-aversion and ahead of the key US Q1 GDP release.
USD/JPY finds its highest bids since 1990, near 155.50

USD/JPY keeps breaking into its highest chart territory since June of 1990 early Thursday, testing 155.50 for the first time in 34 years as the Japanese Yen remains vulnerable, despite looming Japanese intervention risks. Focus shifts to Thursday's US GDP report and the BoJ decision on Friday.
Gold price lacks firm intraday direction, holds steady above $2,300 ahead of US data

Gold price remains confined in a narrow band for the second straight day on Thursday. Reduced Fed rate cut bets and a positive risk tone cap the upside for the commodity. Traders now await key US macro data before positioning for the near-term trajectory.
Injective price weakness persists despite over 5.9 million INJ tokens burned

Injective price is trading with a bearish bias, stuck in the lower section of the market range. The bearish outlook abounds despite the network's deflationary efforts to pump the price. Coupled with broader market gloom, INJ token’s doomed days may not be over yet.
Meta Platforms Earnings: META sinks 10% on lower Q2 revenue guidance Premium

This must be "opposites" week. While Doppelganger Tesla rode horrible misses on Tuesday to a double-digit rally, Meta Platforms produced impressive beats above Wall Street consensus after the close on Wednesday, only to watch the share price collapse by nearly 10%.
RECOMMENDED LESSONS
Making money in forex is easy if you know how the bankers trade!
Discover how to make money in forex is easy if you know how the bankers trade!
5 Forex News Events You Need To Know
In the fast moving world of currency markets, it is extremely important for new traders to know the list of important forex news...
Top 10 Chart Patterns Every Trader Should Know
Chart patterns are one of the most effective trading tools for a trader. They are pure price-action, and form on the basis of underlying buying and...
7 Ways to Avoid Forex Scams
The forex industry is recently seeing more and more scams. Here are 7 ways to avoid losing your money in such scams: Forex scams are becoming frequent. Michael Greenberg reports on luxurious expenses, including a submarine bought from the money taken from forex traders. Here’s another report of a forex fraud. So, how can we avoid falling in such forex scams?
What Are the 10 Fatal Mistakes Traders Make
Trading is exciting. Trading is hard. Trading is extremely hard. Some say that it takes more than 10,000 hours to master. Others believe that trading is the way to quick riches. They might be both wrong. What is important to know that no matter how experienced you are, mistakes will be part of the trading process.


