CRYPTOCURRENCIES INDICATOR: CONFLUENCES


What is the Technical Confluences Detector?

The FXS Technical Confluences Detector is an in-house tool, developed by FXStreet experts, that allows you to identify those price levels where congestion of indicators like moving averages, Fibonacci levels, Pivot Points occurs. Knowing where these congestion points are located is very helpful as it allows the trader to see these areas of support and resistance easily.

This tool is customizable so you can choose the asset selectors and the time frame that are more suitable for your trading operations.

Read more about the Technical Confluences Detector


Lorenzo Stroe

Litecoin has been trading sideways in a consolidation pattern after reaching its 2021 top at $185. LTC bulls are trying to defend a crucial support level and push Litecoin price towards $140.

Litecoin price can quickly rise to $140 with this rebound

On the 12-hour chart, Litecoin established a descending triangle pattern with a support trendline located at $121. It seems that bulls have defended this level once again and LTC price has rebounded by 6% in just two hours after touching $118.

This rebound could push Litecoin towards the upper trendline at $140. On the 2-hour chart, the TD Sequential indicator has just presented a buy signal giving credence to the bullish rebound.

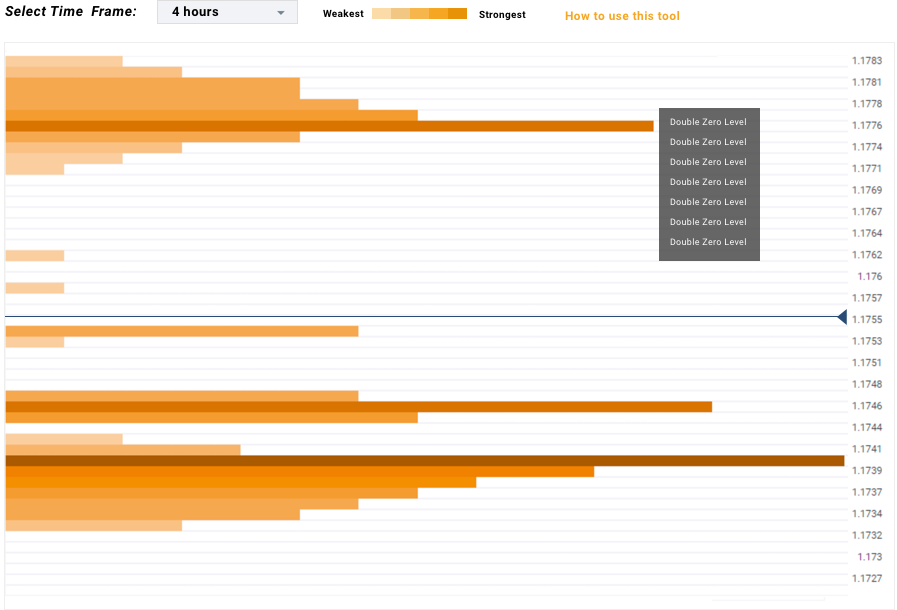
The In/Out of the Money Around Price (IOMAP) chart shows the most significant resistance area to be located between $136 and $140, which coincides with our price target above.

Read Full Report

Preferred brokers in your location


Cryptos


Commodities

Forex


What are the Technical Confluences Detector?

HOW DOES IT WORK?

CONFLUENCE OF TECHNICAL LEVELS

This tool assigns a certain "weight" to each indicator according to its class and time range. This "weight" is propagated to adjacent price levels – even if those levels do not contain any indicator – to highlight the influence of the force of attraction generated by the presence of important indicators such as a simple moving average or a Pivot Point level in a daily range. The algorithm's logical structure intensifies the signal's strength in those areas where several indicators converge – so-called technical confluence zones.

HOW TO READ THE CHART?

The tool detects and draws the price levels where indicators are placed, highlighting those levels where several indicators converge simultaneously. The length of each bar indicates the intensity of the resistance or support levels generated by the technical indicators. We have also implemented a color gradient to intensify the bars' tonality where the Technical Confluences Detector finds more resistance to price advance. The white lines represent areas where no technical indicator is detected and where the price can move with ease.

TOOLTIP

You can see which indicators are within each price level by placing the cursor over the bar price level. The explanation uses a code that indicates:

HOW TO USE IT?

With the FXS Technical Confluences Detector tool, you can quickly locate the areas where the price can find a support or resistance zone and make trading decisions. If you are a short-term trader, you will find entry points for counter-trend strategies and hunt a few points at a time. If you are a medium-to-long-term trader, this tool will allow you to know in advance the price levels where a medium-to-long-term trend may stop and rest, where to unwind positions, or where to increase your position size.

Key Technical Levels Key Technical Levels