![]() Nick Mastrandrea
Nick Mastrandrea
Market Tea Leaves
Good Morning Traders,
As of this writing 4 AM EST, here’s what we see:
US Dollar: Sept. USD is Down at 94.590.
Energies: October Crude is Up at 47.39.
Financials: The Sept 30 year bond is Up 6 ticks and trading at 171.29.
Indices: The Sept S&P 500 emini ES contract is 5 ticks higher and trading at 2174.75.
Gold: The October gold contract is trading Up at 1324.30. Gold is 31 ticks higher than its close.
Initial Conclusion
This is not a correlated market. The dollar is Down- and crude is Up+ which is normal but the 30 year bond is trading Higher. The Financials should always correlate with the US dollar such that if the dollar is lower then bonds should follow and vice-versa. The indices are Up and Crude is trading Higher which is not correlated. Gold is trading Up which is correlated with the US dollar trading Down. I tend to believe that Gold has an inverse relationship with the US Dollar as when the US Dollar is down, Gold tends to rise in value and vice-versa. Think of it as a seesaw, when one is up the other should be down. I point this out to you to make you aware that when we don’t have a correlated market, it means something is wrong. As traders you need to be aware of this and proceed with your eyes wide open.
Asia traded mixed with half the exchanges trading lower and the other half higher. As of this writing Europe is trading lower at this hour.
Possible Challenges To Traders Today
– Prelim GDP q/q is out at 8:30 AM EST. This is major.
– Prelim GDP Price Index q/q is out at 8:30 AM. This is major.
– Goods Trade Balance is out at 8:30 AM. This is major.
– Fed Chair Yellen Speaks at 10 AM EST. This is major.
– Revised UoM Consumer Sentiment is out at 10 AM EST. This is not major.
– Revised UoM Inflation Expectations is out at 10 AM EST. This is not major.
– Jackson Hole Symposium – All Day. This is major.
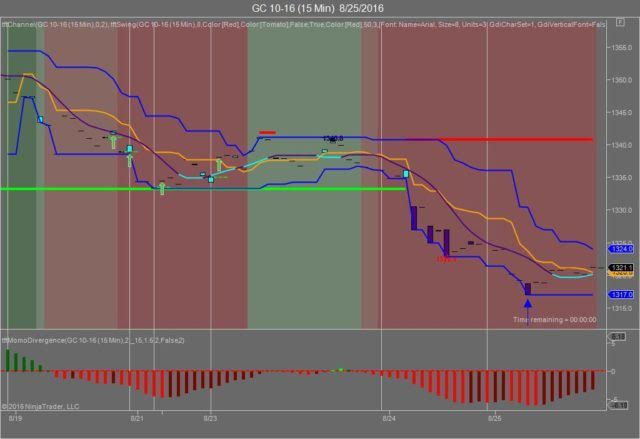
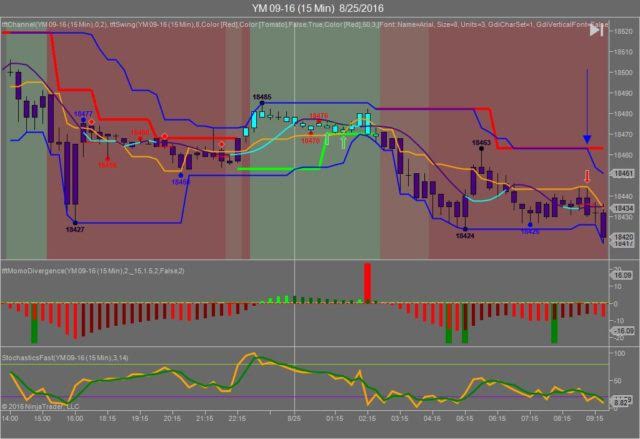
We’ve elected to switch gears a bit and show correlation between Gold and The YM futures contract. The YM contract is the DJIA and the purpose is to show reverse correlation between the two instruments. Remember it’s liken to a seesaw, when up goes up the other should go down and vice versa.
Yesterday Gold made it’s move at around 8:45 AM EST after the 8:30 economic news was reported. Gold hit a low at around that time and the YM hit a high. If you look at the charts below Gold gave a signal at around 8:45 AM EST and the YM was moving lower at the same time. Look at the charts below and you’ll see a pattern for both assets. Gold hit a low at around 8:45 AM EST and the YM hit a high. These charts represent the latest version of Trend Following Trades and I’ve changed the timeframe to a 15 minute chart to display better. This represented a long opportunity on Gold, as a trader you could have netted about 30 plus ticks per contract on this trade. Each tick is worth $10. We added a Donchian Channel to the charts to show the signals more clearly.
Charts Courtesy of Trend Following Trades built on a NinjaTrader platform
Bias
Yesterday we gave the markets a downside bias as both Crude and the Bonds were trading higher yesterday morning and this does bode well for a upside day. The markets didn’t disappoint as the Dow dropped 33 points and the other indices lost ground as well. Today we aren’t dealing with a correlated market and our bias is neutral.
Could this change? Of Course. Remember anything can happen in a volatile market.
Commentary
Yesterday we received good economic news but unlike other days this week where we received good economic news; this did not go according to plan. Durable Goods, Core Durable Goods came in better than expected and the Unemployment Claims were down but this was not enough to propel the markets forward. All week long we’ve been waiting for some sign from the Fed as to what the future holds for rate hikes and thus far we’ve received nothing. Today Jane Yellen speaks at 10 AM EST and it is hoped that she can provide some measure of assurance or stability to an already unstable market.
Trading performance displayed herein is hypothetical. The following Commodity Futures Trading Commission (CFTC) disclaimer should be noted.
Hypothetical performance results have many inherent limitations, some of which are described below. No representation is being made that any account will or is likely to achieve profits or losses similar to those shown.
In fact, there are frequently sharp differences between hypothetical performance results and the actual results subsequently achieved by any particular trading program. One of the limitations of hypothetical performance trading results is that they are generally prepared with the benefit of hindsight.
In addition, hypothetical trading does not involve financial risk, and no hypothetical trading record can completely account for the impact of financial risk in actual trading. For example, the ability to withstand losses or to adhere to a particular trading program in spite of trading losses are material points which can also adversely affect actual trading results.
There are numerous other factors related to the markets in general or to the implementation of any specific trading program which cannot be fully accounted for in the preparation of hypothetical performance results and all of which can adversely affect actual trading results.
Trading in the commodities markets involves substantial risk and YOU CAN LOSE A LOT OF MONEY, and thus is not appropriate for everyone. You should carefully consider your financial condition before trading in these markets, and only risk capital should be used.
In addition, these markets are often liquid, making it difficult to execute orders at desired prices. Also, during periods of extreme volatility, trading in these markets may be halted due to so-called “circuit breakers” put in place by the CME to alleviate such volatility. In the event of a trading halt, it may be difficult or impossible to exit a losing position.
Recommended Content
Editors’ Picks
EUR/USD holds below 1.0750 ahead of key US data

EUR/USD trades in a tight range below 1.0750 in the European session on Friday. The US Dollar struggles to gather strength ahead of key PCE Price Index data, the Fed's preferred gauge of inflation, and helps the pair hold its ground.
USD/JPY stays firm above 156.00 after BoJ Governor Ueda's comments

USD/JPY stays firm above 156.00 after surging above this level on the Bank of Japan's decision to leave the policy settings unchanged. BoJ Governor said weak Yen was not impacting prices but added that they will watch FX developments closely.
Gold price oscillates in a range as the focus remains glued to the US PCE Price Index

Gold price struggles to attract any meaningful buyers amid the emergence of fresh USD buying. Bets that the Fed will keep rates higher for longer amid sticky inflation help revive the USD demand.
Bitcoin Weekly Forecast: BTC’s next breakout could propel it to $80,000 Premium

Bitcoin’s recent price consolidation could be nearing its end as technical indicators and on-chain metrics suggest a potential upward breakout. However, this move would not be straightforward and could punish impatient investors.
US core PCE inflation set to signal firm price pressures as markets delay Federal Reserve rate cut bets

The core PCE Price Index, which excludes volatile food and energy prices, is seen as the more influential measure of inflation in terms of Fed positioning. The index is forecast to rise 0.3% on a monthly basis in March, matching February’s increase.