Jack Steiman, On Bears Can't Get Market Rocking Lower ... Yet! (SwingTradeOnline.com)
So we finally got some news that would help the market take a deeper plunge -- the makings of something to help us really unwind those overbought oscillators on the daily, weekly, and monthly index charts. The futures recovered a little bit pre-market, but we were down approximately 100 points early in the day with the Nasdaq down over 1%. Now the question became, once the retail crowd bought up the early dip as usual, would the market head down late in the day? The answer was yes and no.
Unfortunately for the bears, they couldn't get the market rocking lower late. However, the bulls couldn't get the usual green candle stick late either. The bears helped things change character, even if just a bit. Not a day of celebration for the bears, but a day of at least saying they could do something they haven't been able to do for many months, and that's to sell things a bit late, even if it was just with a little bit of force. Maybe this change of trend will allow the market to continue selling for a while longer. We can only hope as this would be very good news for the stock market.
Getting a market to fall from high levels, even extreme levels of overbought across the many different important time frames, can take a long time. You wonder why it simply won't fall hard for a while. It makes sense after all. The problem is the small retail player. Understand that in a bull market you're not going to see big money sell things off very much as they're looking to hold longer-term, or as long as they think the bull will move along. However, they also know when to stop buying when things get too overbought. The not-so-smart money, or the retail trader, wants to keep buying at all times. Get in while the market is strong -- thus they don't allow too much selling initially. They buy up the dips, much as we saw again today early on.
However, at some point they finally give that up when they see it takes more and more to keep it up. Only when the retail trader gets a little frustrated because things don't go up as easily for a while do they give up, which eventually allows the market to have its unwinding pullback. It's possible that started today on some level, but we can't know for sure yet. The next few days will be telling. Getting another 2-3% down would be awesome in terms of getting new plays.
Some of the sentiment issues are still in pretty bad shape, although keep in mind that none of them are in bearish shape. Just red light warning shape. We do have too few bears. 18.8% is not good. The report this Wednesday may actually show even fewer than that as last week wasn't bad. It doesn't take in any of the action from this week. It's possible that bears will be lower still and running too far away from 20%, which is the area one looks for when wondering when the bears are too few in nature. In theory, we are going to need to have fear move up in the market in order to get the bears rocking back in.
Staying under 20% for long periods of time just isn't what you normally see. With this in mind, it makes you play the market from a more safety first approach as you know that at any time things can fall hard in terms of price. It doesn't mean to short and it doesn't mean you can't have some long exposure. It simply means to keep things appropriate and understand the risk involved. We saw many leaders take big hits today. Try to keep it light and stay away from too many heavy beta plays.
Avi Gilburt, On Whipsaws As Promised (ElliottWaveTrader.net)
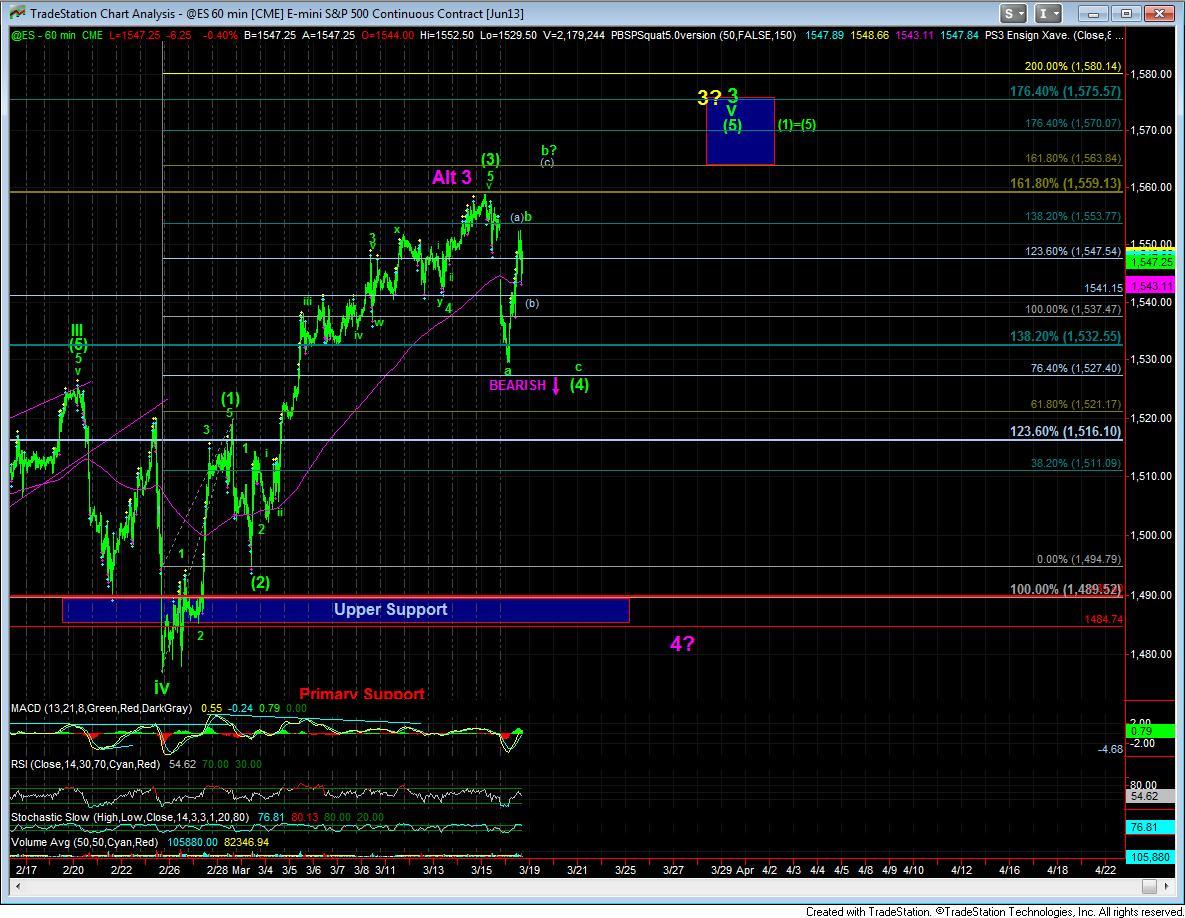
As I said over the weekend, prepare for some market whipsaws for quite some time now. Overnight, we saw the market spike just below the support target region we were watching in the 1532ES region, and immediately move back up over. Since we really wanted to see the 1532ES level hold, the break is an initial warning. But, I think another pattern may be playing out.
I said this morning that I would like to see some kind of wave (4) flat in this region. With the market moving up as expected today, the question we are left with now is if green wave b has completed, or if it will be more complex. I am preferably expecting a more complex b-wave. This would make today's top the (a) wave of wave b, with a drop ideally to the .500 retrace at 1541ES the (b) wave of wave b, and a rally to a new high around the 1564ES region the (c) wave of wave b, and completing the b-wave for an irregular 4th wave flat.
Clearly, this is based upon a certain amount of conjecture. But, as noted earlier today, when we do not hit the ideal target high in the market - as we topped out just shy of the 1564ES ideal target region - the market will often attempt to hit it in a higher b-wave high. Furthermore, with the slight break down below the 1532ES support level, and a b-wave high at 1564ES, we would have a c-wave of (4) project right to our 1532ES target region to complete wave (4) at our initial target level. Interesting how this little scenario ties up a lot of loose ends.
So, we will see how we follow through tomorrow, as this is only based upon conjecture at this time, and we know that 4th wave can take many different potential paths to complete, as there is no one set pattern that they must take. So, we will remain on our toes and ever vigilant.
Mike Paulenoff, On Recovery Rally the Start of New Up-Leg? ( MPTrader.com)
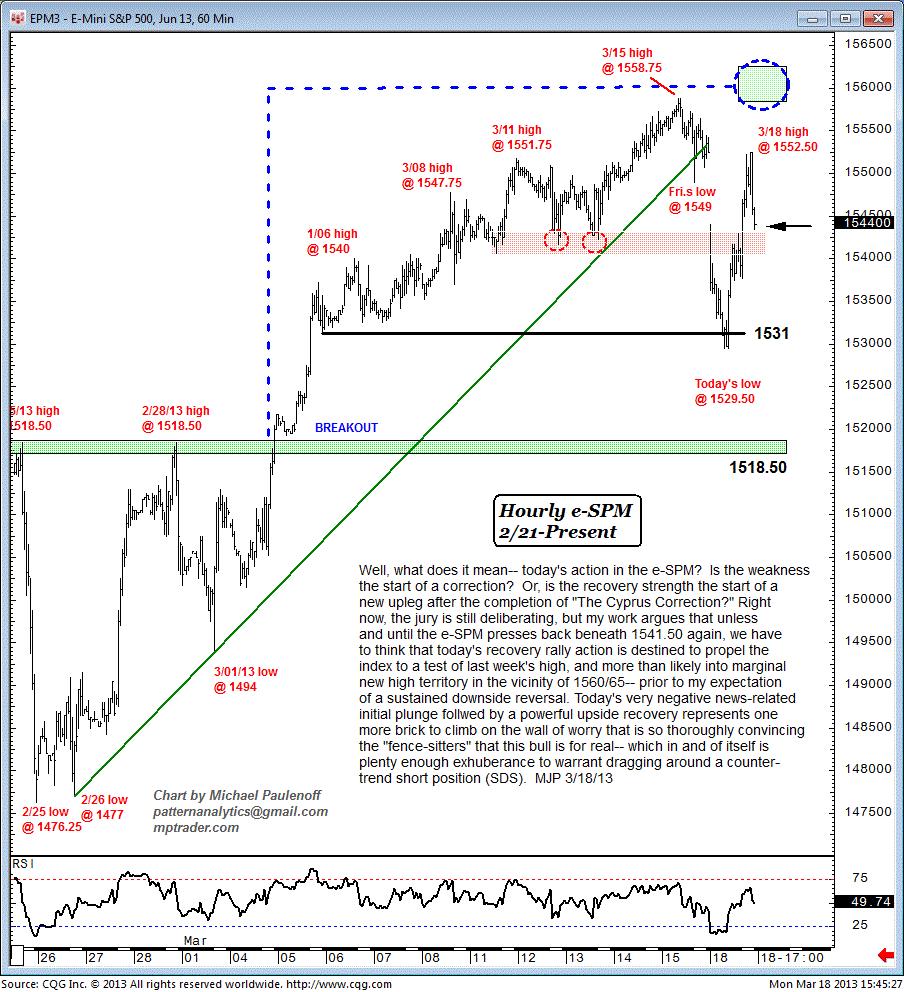
What does Monday's action in the Emini S&P 500 mean? Is the weakness the start of a correction? Or, is the recovery strength the start of a new up-leg after the completion of "The Cyprus Correction"?
Right now, the jury is still deliberating, but my work argues that unless and until the e-SPM presses back beneath 1541.50 again, we have to think that Monday's recovery rally action is destined to propel the index to a test of last week's high, and more than likely into marginal new high territory in the vicinity of 1560/65 -- prior to my expectation of a sustained downside reversal.
Monday's very negative news-related initial plunge followed by a powerful upside recovery represents one more brick to climb on the wall of worry that is so thoroughly convincing the "fence-sitters" that this bull is for real -- which in and of itself is plenty enough exuberance to warrant dragging around a counter-trend short position (SDS).
Harry Boxer, On 2 Longs & 2 Shorts to Watch (TheTechTrader.com)
The stock market had a rough morning on Monday, with a big gap down, and then they came back with a roar. They had a very strong move until the last half hour. They rolled them back down, and closed firmly in the red column. If we're not seeing what we want on Tuesday, then we're going lower. For now, we're going to take a look at both longs and shorts here.
Atossa Genetics, Inc. (ATOS) has a very interesting pattern. After the big pop in February, it coiled, popped, pulled back, popped again, and this time it held, up 1.81 to 9.21, or 24.5%, on nearly a half million shares. It was only 3 cents off its high on a range of nearly two dollars. Let's see if it follows through. The spike high last week was 9.45. If it gets through that, it could see 10-11 intermediate-term.
TravelCenters of America LLC (TA) was the chart of the day on Monday. It spiked up 1.44 to 9.01, or 19%, on 3.1 million shares. That's by far the biggest volume in a very long time, a year or better. It ran up early, formed a coil, broke out and went from 8.50 to 9.14, pulled back, formed a failing wedge, and midday, it spited back up. It looks like it could go higher. Look for something near the 2011 spike high at 2 1/2.
Stocks on the Short Side....
Lululemon Athletica Inc. (LULU) may have broken a key wedge on Monday with a breakaway gap to the downside, down 2.58 to 65.90, or 3.7%, on 3.9 million shares. It could start to accelerate lower and get into the high 50's, low 60's.
Elizabeth Arden, Inc. (RDEN) has an interesting chart. After breaking hard in February, it formed a bear flag, broke down, dropping 1.02 to 38.39, or 2.6%. It may very well retest the lows around 35.
Other stocks on Harry's Charts of the Day are Atossa Genetics, Inc. (ATOS), Caesars Entertainment Corporation (CZR), Glu Mobile, Inc. (GLUU), J. C. Penney Company, Inc. (JCP), Meru Networks, Inc. (MERU), PetroChina Co. Ltd. (PTR), and Swift Transportation Company (SWFT). Altisource Portfolio Solutions S.A. (ASPS), ccl, Liquidity Services, Inc. (LQDT), Elizabeth Arden, Inc. (RDEN), Rentech Nitrogen Partners, L.P. (RNF), Stratasys Inc. (SSYS), Teck Resources Limited (TCK), and Weight Watchers International, Inc. (WTW).a
This Web site is published by AdviceTrade, Inc. AdviceTrade is a publisher and not registered as a securities broker-dealer or investment advisor either with the U.S. Securities and Exchange Commission or with any state securities authority. The information on this site has been obtained from sources considered reliable but we neither guarantee nor represent the completeness or accuracy of the information. In addition, this information and the opinions expressed are subject to change without notice. Neither AdviceTrade nor its principals own shares of, or have received compensation by, any company covered or any fund that appears on this site. The information on this site should not be relied upon for purposes of transacting securities or other investments, nor should it be construed as an offer or solicitation of an offer to sell or buy any security. AdviceTrade does not assess, verify or guarantee the suitability or profitability of any particular investment. You bear responsibility for your own investment research and decisions and should seek the advice of a qualified securities professional before making any investment.
Recommended Content
Editors’ Picks
USD/JPY holds above 155.50 ahead of BoJ policy announcement

USD/JPY is trading tightly above 155.50, off multi-year highs ahead of the BoJ policy announcement. The Yen draws support from higher Japanese bond yields even as the Tokyo CPI inflation cooled more than expected.
AUD/USD extends gains toward 0.6550 after Australian PPI data

AUD/USD is extending gains toward 0.6550 in Asian trading on Friday. The pair capitalizes on an annual increase in Australian PPI data. Meanwhile, a softer US Dollar and improving market mood also underpin the Aussie ahead of the US PCE inflation data.
Gold price keeps its range around $2,330, awaits US PCE data

Gold price is consolidating Thursday's rebound early Friday. Gold price jumped after US GDP figures for the first quarter of 2024 missed estimates, increasing speculation that the Fed could lower borrowing costs. Focus shifts to US PCE inflation on Friday.
Stripe looks to bring back crypto payments as stablecoin market cap hits all-time high

Stripe announced on Thursday that it would add support for USDC stablecoin, as the stablecoin market exploded in March, according to reports by Cryptocompare.
US economy: Slower growth with stronger inflation

The US Dollar strengthened, and stocks fell after statistical data from the US. The focus was on the preliminary estimate of GDP for the first quarter. Annualised quarterly growth came in at just 1.6%, down from the 2.5% and 3.4% previously forecast.

