EUR/USD Technical analysis Dec 15th - Dec 19th
What is happening to EURO? This has been confusing many traders for the last few days.
EUR/USD started the week with relative bearish bias due to the previous week’s massive NFP data announcements; however the bias were changed by the end of the day. Despite making yet another daily low, the pair closed Monday’s daily candle above its resistance level of 1.2310 which previously had acted as a sensitive support zone. On Tuesday, the Risk aversion took on stage with the Chinese & Greek stocks plunging down, pushing USD lower and EUR/USD to its new highs
Despite last week’s bullish push with the global risk aversion, EUR/USD failed to break above its monthly pivot level, finding its weekly resistance just below 1.2500 psychological level.
Towards the end of the week all eyes were on the ECB’s TLTRO announcement, where the central bank announced the second TLTRO at EUR 129.8bn a little below the expectations, meanwhile markets had a surprise interest rate cut from Norway (Norges), an expected rate hike from Russia (CBR) and USD supporting news from the US. All together the trend seemed to ease on USD on Thursday.
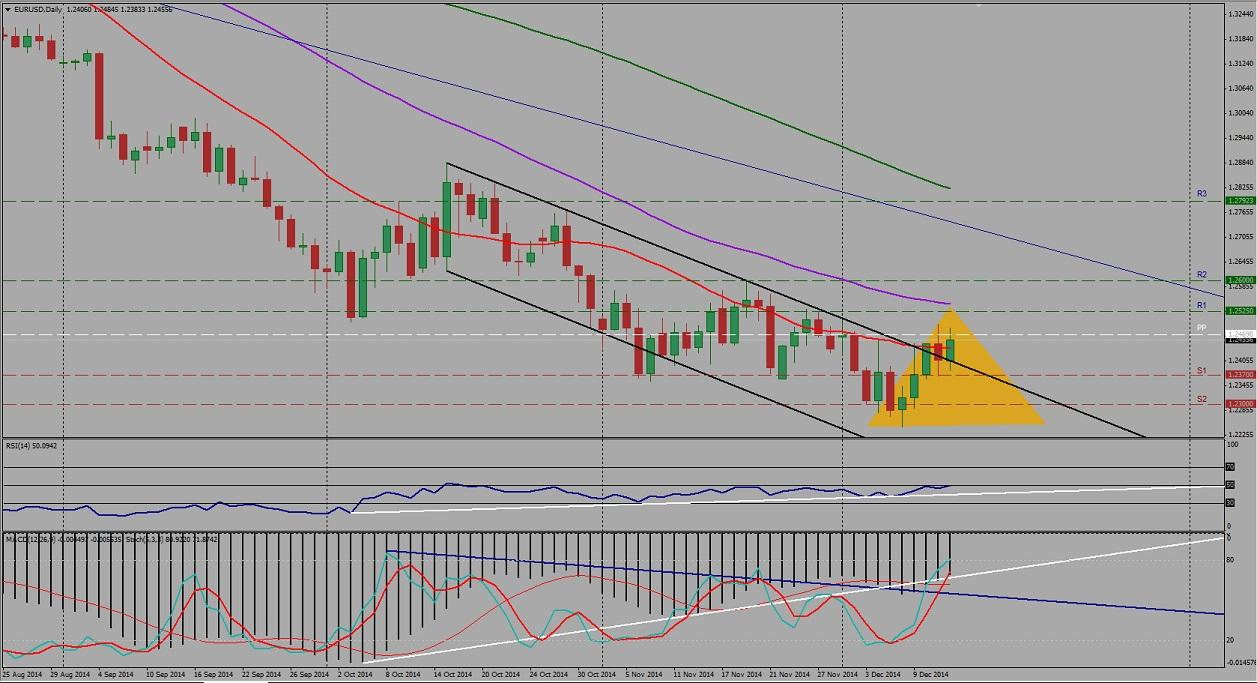
On the daily chart, the price structure still remains lower peaks and lower troughs. Current rate remains below both the 50- and the 100-day moving averages, but slightly above the 20-day moving averages and just above the upper boundary of the bearish channel. The overall bearish price action still can not be concluded to be over with further bearish targets remaining intact towards 1.2200 support zone and the anticipated 1.2000 psychological barrier.
Expectations for the upcoming week (Dec 15th - Dec 19th):
From smaller 4 hour time frame point of view, we can see bullish trend developments as the pair has broken above all three of the SMAs, MACD and RSI both supports bullish trend development.
On Daily time frame all three of our MAs are sloping downwards, RSI is pushing above its 50 Neutral zone towards bullish territories, MACD still in its bearish zone. Additionally on daily timeframe both RSI and MACD indicate bullish divergence.
As long as the rate stays below the monthly pivot point preferences are based on bearish bias. However as we are moving towards the end of the year we may expect the pair to consolidate between 1.2525 resistance and the 1.2300 psychological support levels.
Resistance levels: 1.2469 (MPP), 1. 2525 (R1), 1.2600 (R2), and 1.2793 (R3)
Support levels: 1.2370 (S1), 1.2300 (S2) and 1.2200 (S3)
GBP/USD Technical analysis Dec 15th - Dec 19th
After 7 weeks of bearishness GBP/USD finally had a bullish weekly development last week. The pair found its support at its weekly 1.5555 support zone before bouncing up towards its monthly pivot point last week.
After the previous week’s massive NFP figures pound sterling opened the week at 1.5570 however could not sustain its bearish power. Despite its bearish attempt right after the market opening, cable moved higher on Monday gaining back all the loss we had over the NFP figures announcement.
On Tuesday the pair tested its weekly resistance at 1.5710 level before falling back to 1.5670 levels. The indecisive movement of the pair was due to the UK industrial production falling 0.1% mom in October, from its +0.7% mom previously revised figure.
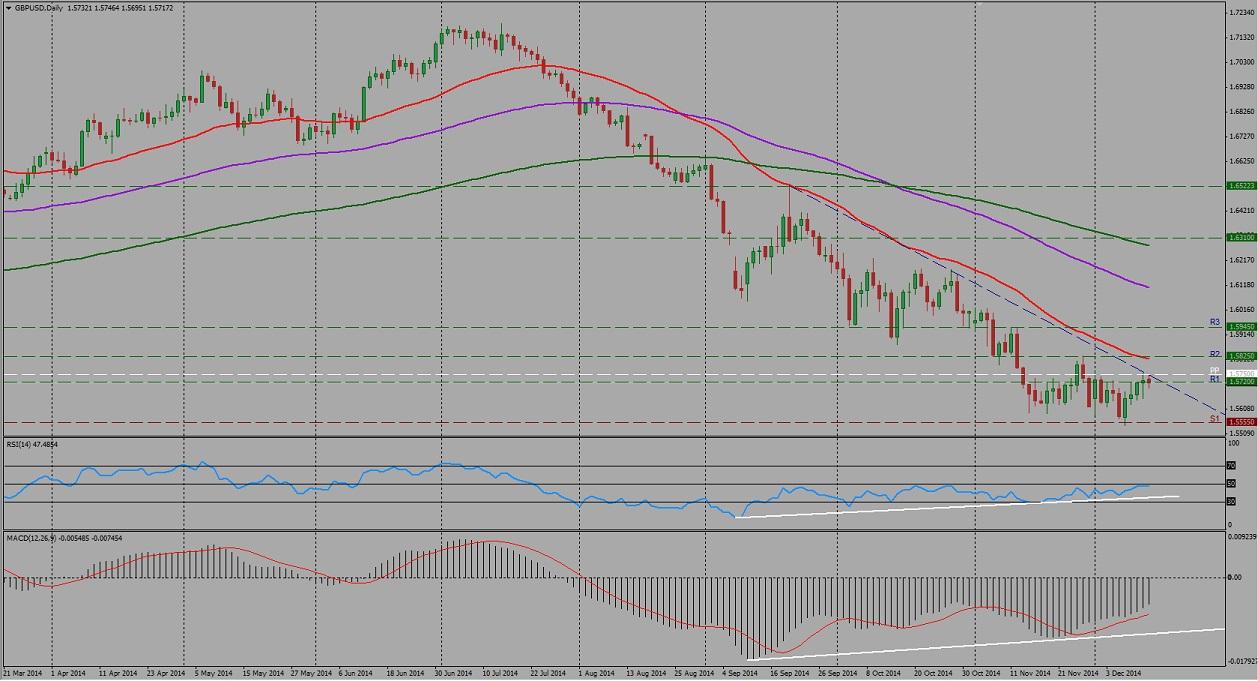
Despite cable’s weekly bullish price development, on the daily chart, the price structure still remains lower peaks and lower troughs. With last Monday’s 65 week low at 1.5542 level the overall bearish price action still can not be concluded to be over and the main monthly bearish target of 1.5300 still carries its importance.
Expectations for the upcoming week (Dec 15th - Dec 19th):
At the time of analysis the pair is trading just below its monthly pivot point of 1.5750 as well as its weekly trend line.
On Daily time frame all three of our MAs are sloping downwards, however the scenario has changed in H1 and H4 timeframes. ON H4 timeframe SMA20 is sloping upwards, SMA50 becoming flat while SMA100 sloping southwards and the price is moving just between SMA50 and SMA100 which is a sideway market development indication.
Meanwhile on weekly timeframe RSI is trying to break above its 30 level, passing into neutral territory, MACD indicating further downside developments. On daily timeframe there is uncertainty in our oscillators; RSI is bouncing off the 50 Neutral zone, MACD in bearish zone. Additionally on daily timeframe both RSI and MACD indicate bullish divergence.
Especially this week’s UK Bank stress tests will bring complete new approach for cable with the bears looking to take over last week’s bulls.As long as the daily candles stay below the monthly pivot the long-term trend can still be concluded as bearish.
Resistance levels: 1.5720 (R1), 1.5750 (MPP), 1.5825(R2), and 1.5945(R3)
Support levels: 1.5555 (S1), 1.5400 (S2), 1.5300 (S3)
This market forecast is for general information only. It is not an investment advice or a solution to buy or sell securities.
Authors' opinions do not represent the ones of Orbex and its associates. Terms and Conditions and the Privacy Policy apply.
Trading foreign exchange on margin carries a high level of risk, and may not be suitable for all investors. Before deciding to trade foreign exchange, you should carefully consider your investment objectives, level of experience, and risk appetite. There is a possibility that you may sustain a loss of some or all of your investment and therefore you should not invest money that you cannot afford to lose. You should be aware of all the risks associated with foreign exchange trading, and seek advice from an independent financial advisor if you have any doubts.
Recommended Content
Editors’ Picks
EUR/USD holds above 1.0700 ahead of key US data

EUR/USD trades in a tight range above 1.0700 in the early European session on Friday. The US Dollar struggles to gather strength ahead of key PCE Price Index data, the Fed's preferred gauge of inflation, and helps the pair hold its ground.
USD/JPY stays above 156.00 after BoJ Governor Ueda's comments

USD/JPY holds above 156.00 after surging above this level with the initial reaction to the Bank of Japan's decision to leave the policy settings unchanged. BoJ Governor said weak Yen was not impacting prices but added that they will watch FX developments closely.
Gold price oscillates in a range as the focus remains glued to the US PCE Price Index

Gold price struggles to attract any meaningful buyers amid the emergence of fresh USD buying. Bets that the Fed will keep rates higher for longer amid sticky inflation help revive the USD demand.
Sei Price Prediction: SEI is in the zone of interest after a 10% leap

Sei price has been in recovery mode for almost ten days now, following a fall of almost 65% beginning in mid-March. While the SEI bulls continue to show strength, the uptrend could prove premature as massive bearish sentiment hovers above the altcoin’s price.
US core PCE inflation set to signal firm price pressures as markets delay Federal Reserve rate cut bets

The core PCE Price Index, which excludes volatile food and energy prices, is seen as the more influential measure of inflation in terms of Fed positioning. The index is forecast to rise 0.3% on a monthly basis in March, matching February’s increase.

