EUR/USD
Remains near its recent lows.
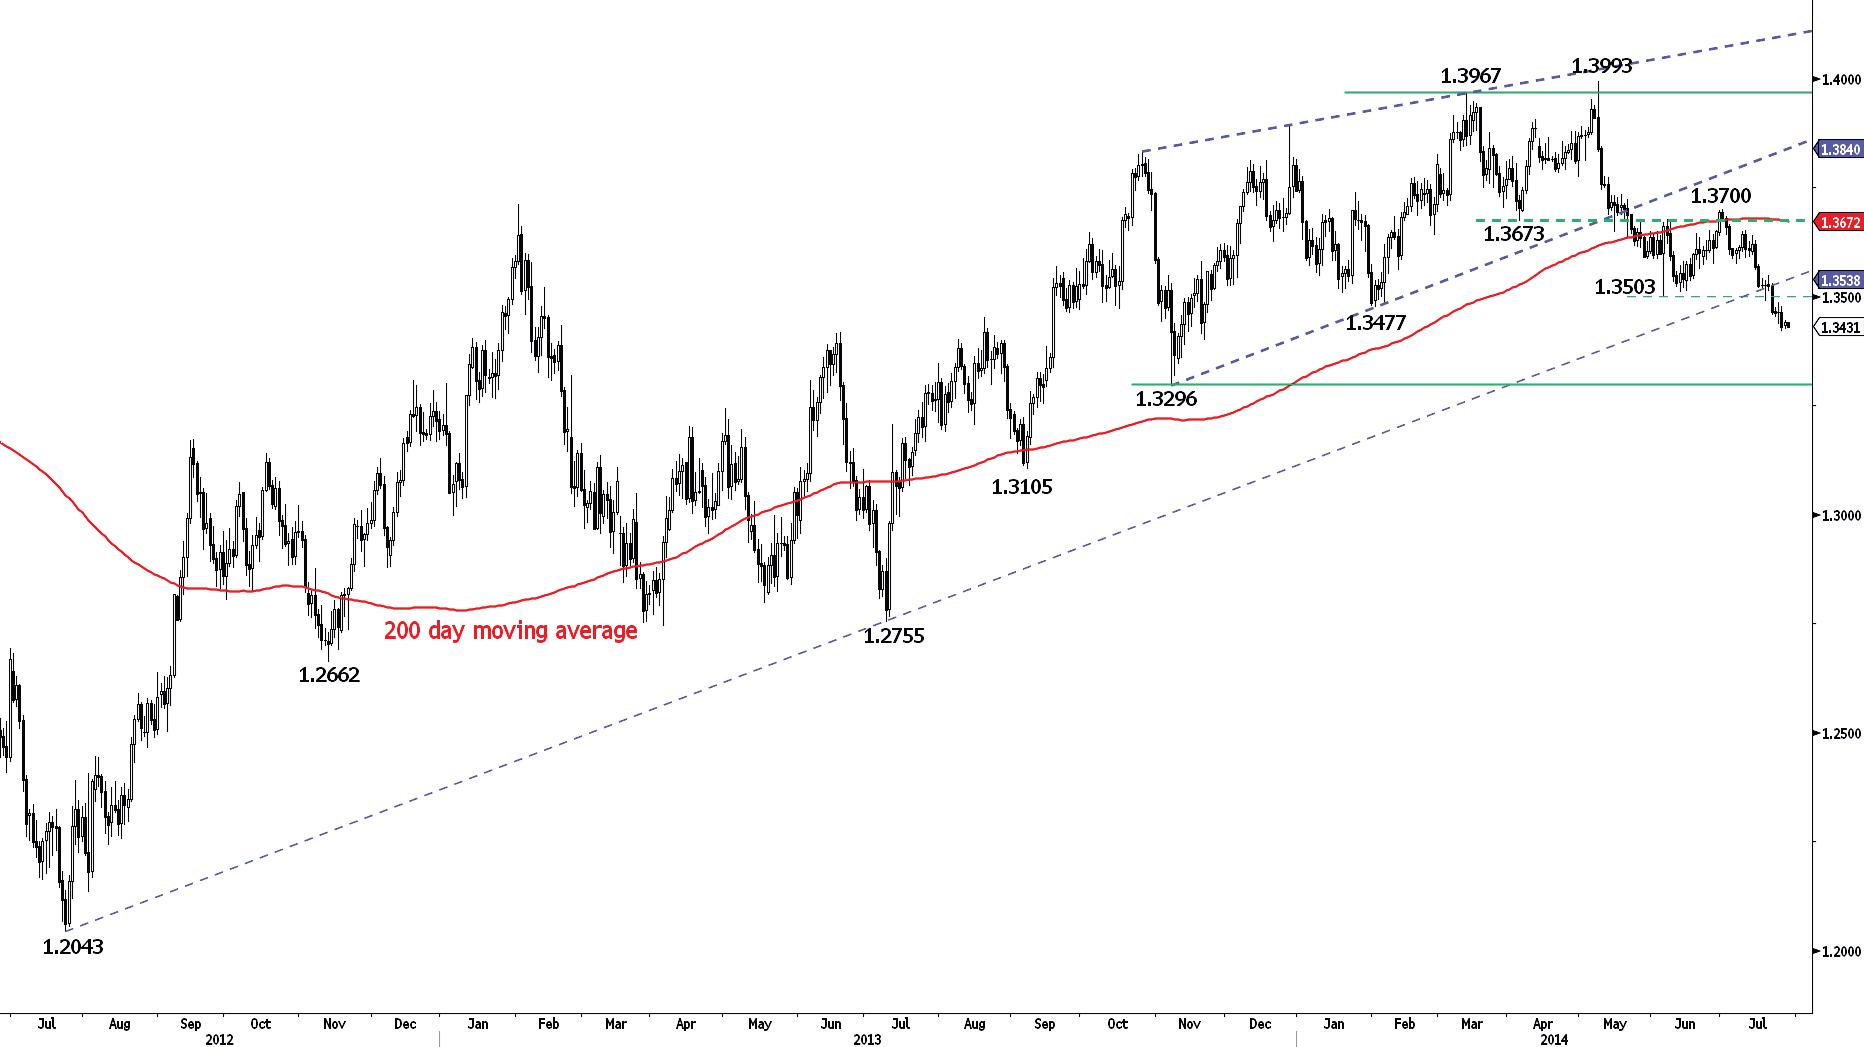
EUR/USD has broken the key support area defined by 1.3503 (see also the long-term rising trendline from the July 2012 low) and 1.3477 (03/02/2014 low), confirming an underlying downtrend. The bounce is thus far unimpressive, as prices remain near their recent lows. Hourly resistances can be found at 1.3485 (24/07/2014 high) and 1.3513 (21/07/2014 low).
In the longer term, EUR/USD is in a succession of lower highs and lower lows since May 2014. Downside risks are given by 1.3379 (implied by the double-top formation) and 1.3210 (second leg lower after the rebound from 1.3503 to 1.3700). A strong support stands at 1.3296 (07/11/2013 low). A resistance lies at 1.3549 (21/07/2014 high).
Await fresh signal.
GBP/USD
Consolidating.
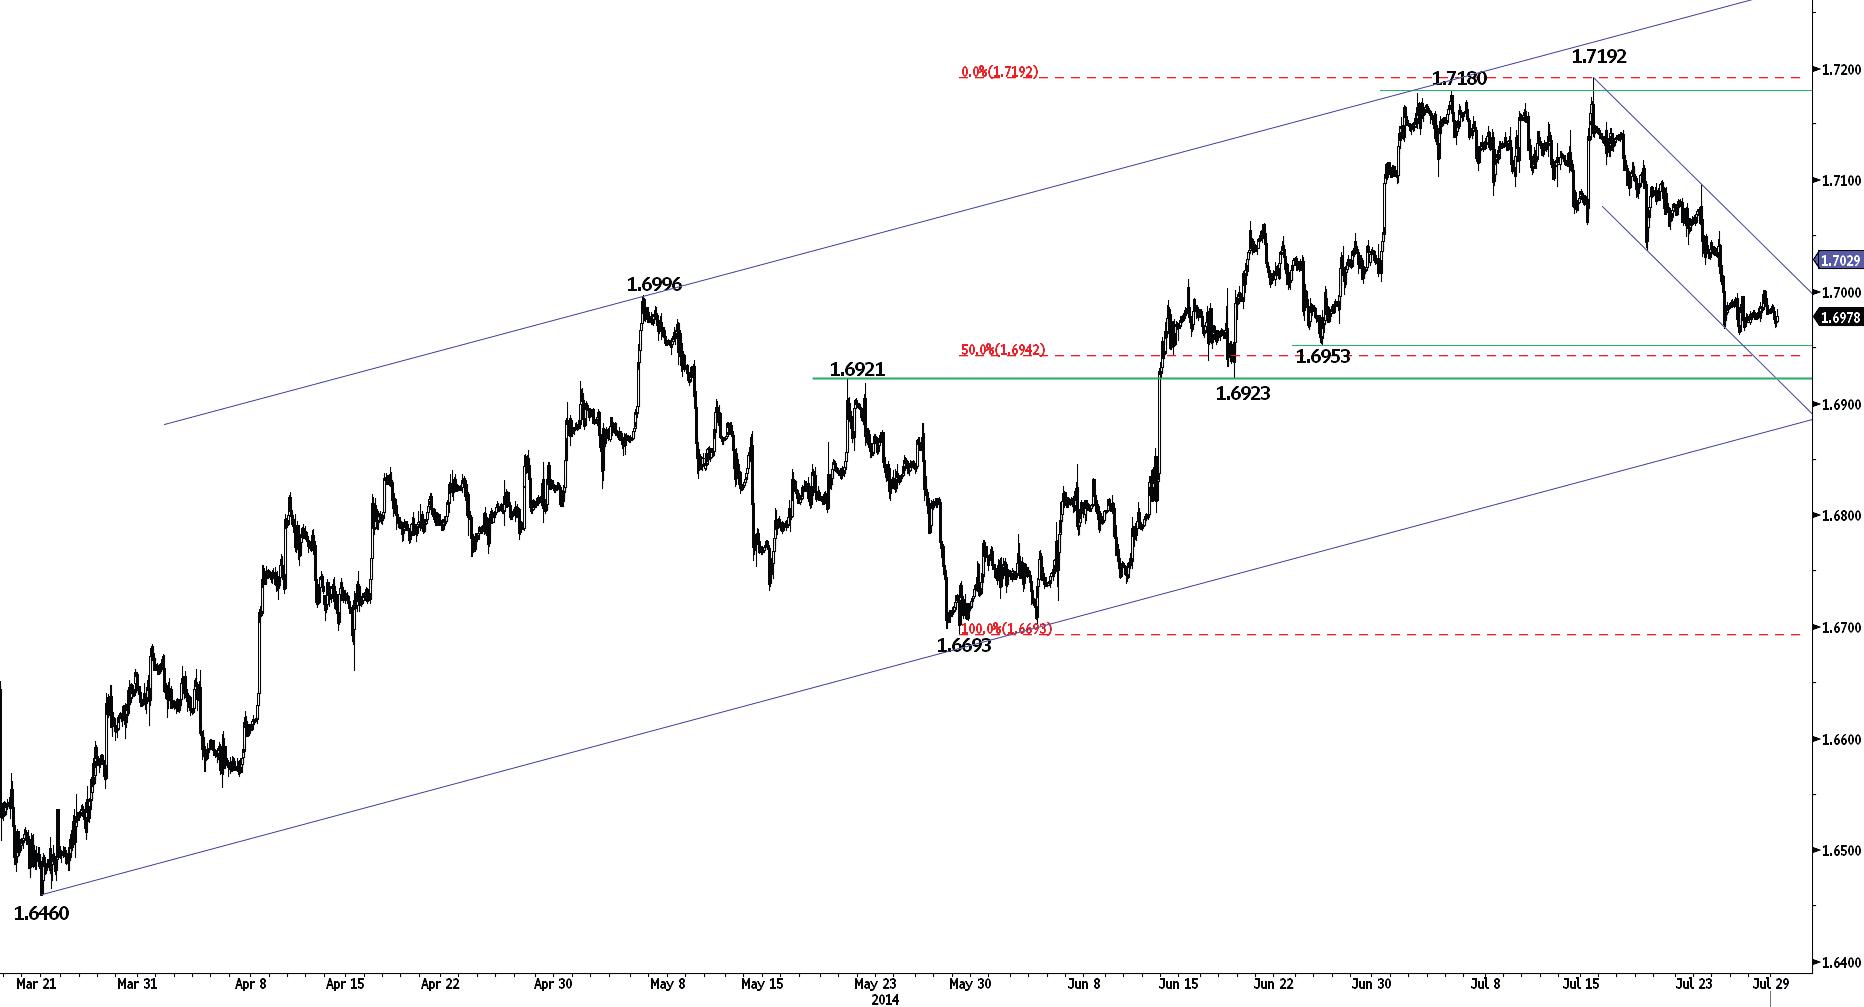
GBP/USD is moving sideways near the significant support area defined by 1.6953 and 1.6923. Even though the failure to hold above the resistance at 1.6998 (25/07/2014 high) suggests persistent selling pressures, the aforementioned support area is expected to hold in the short-term. Hourly resistances can be found at 1.7054 (24/07/2014 high, see also the declining channel) and 1.7118 (18/07/2014 high).
In the longer term, the break of the major resistance at 1.7043 (05/08/2009 high) calls for further strength. Resistances can be found at 1.7332 (see the 50% retracement of the 2008 decline) and 1.7447 (11/09/2008 low). A support lies at 1.6923 (18/06/2014 low).
Buy stop 2 units at 1.7008, Obj: Close 1 unit at 1.7167, remaining at 1.7435, Stop: 1.6943.
USD/JPY
Pushing higher.
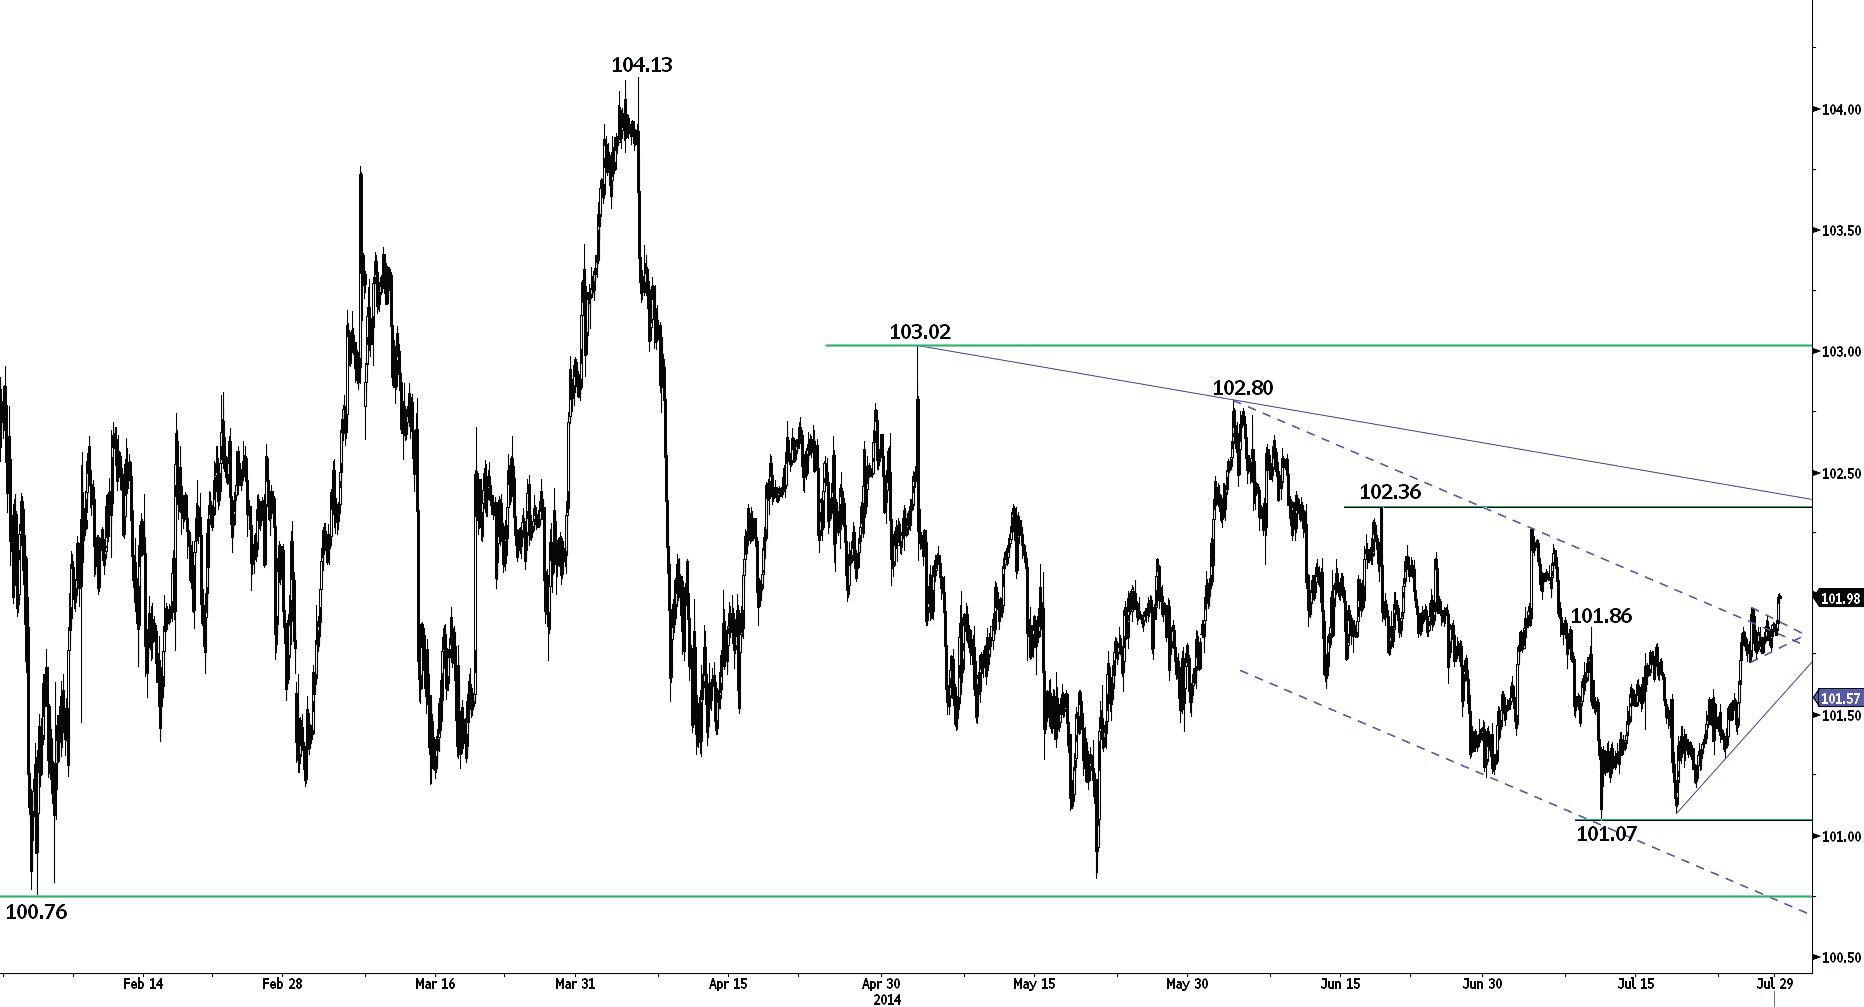
USD/JPY continues to improve after the break of the resistance at 101.86 (see also the declining channel), as can be seen by the break of the short-term symmetrical triangle. Hourly supports can be found at 101.72 (25/07/2014 low) and 101.60 (22/07/2014 high, see also the rising trendline). Other resistances stand at 102.27 (03/07/2014 high) and 102.36.
A long-term bullish bias is favoured as long as the key support 99.57 (19/11/2013 low) holds. However, a break to the upside out of the current consolidation phase between 100.76 (04/02/2014 low) and 103.02 is needed to resume the underlying bullish trend. A major resistance stands at 110.66 (15/08/2008 high).
Await fresh signal.
USD/CHF
Selling pressures remain muted thus far.
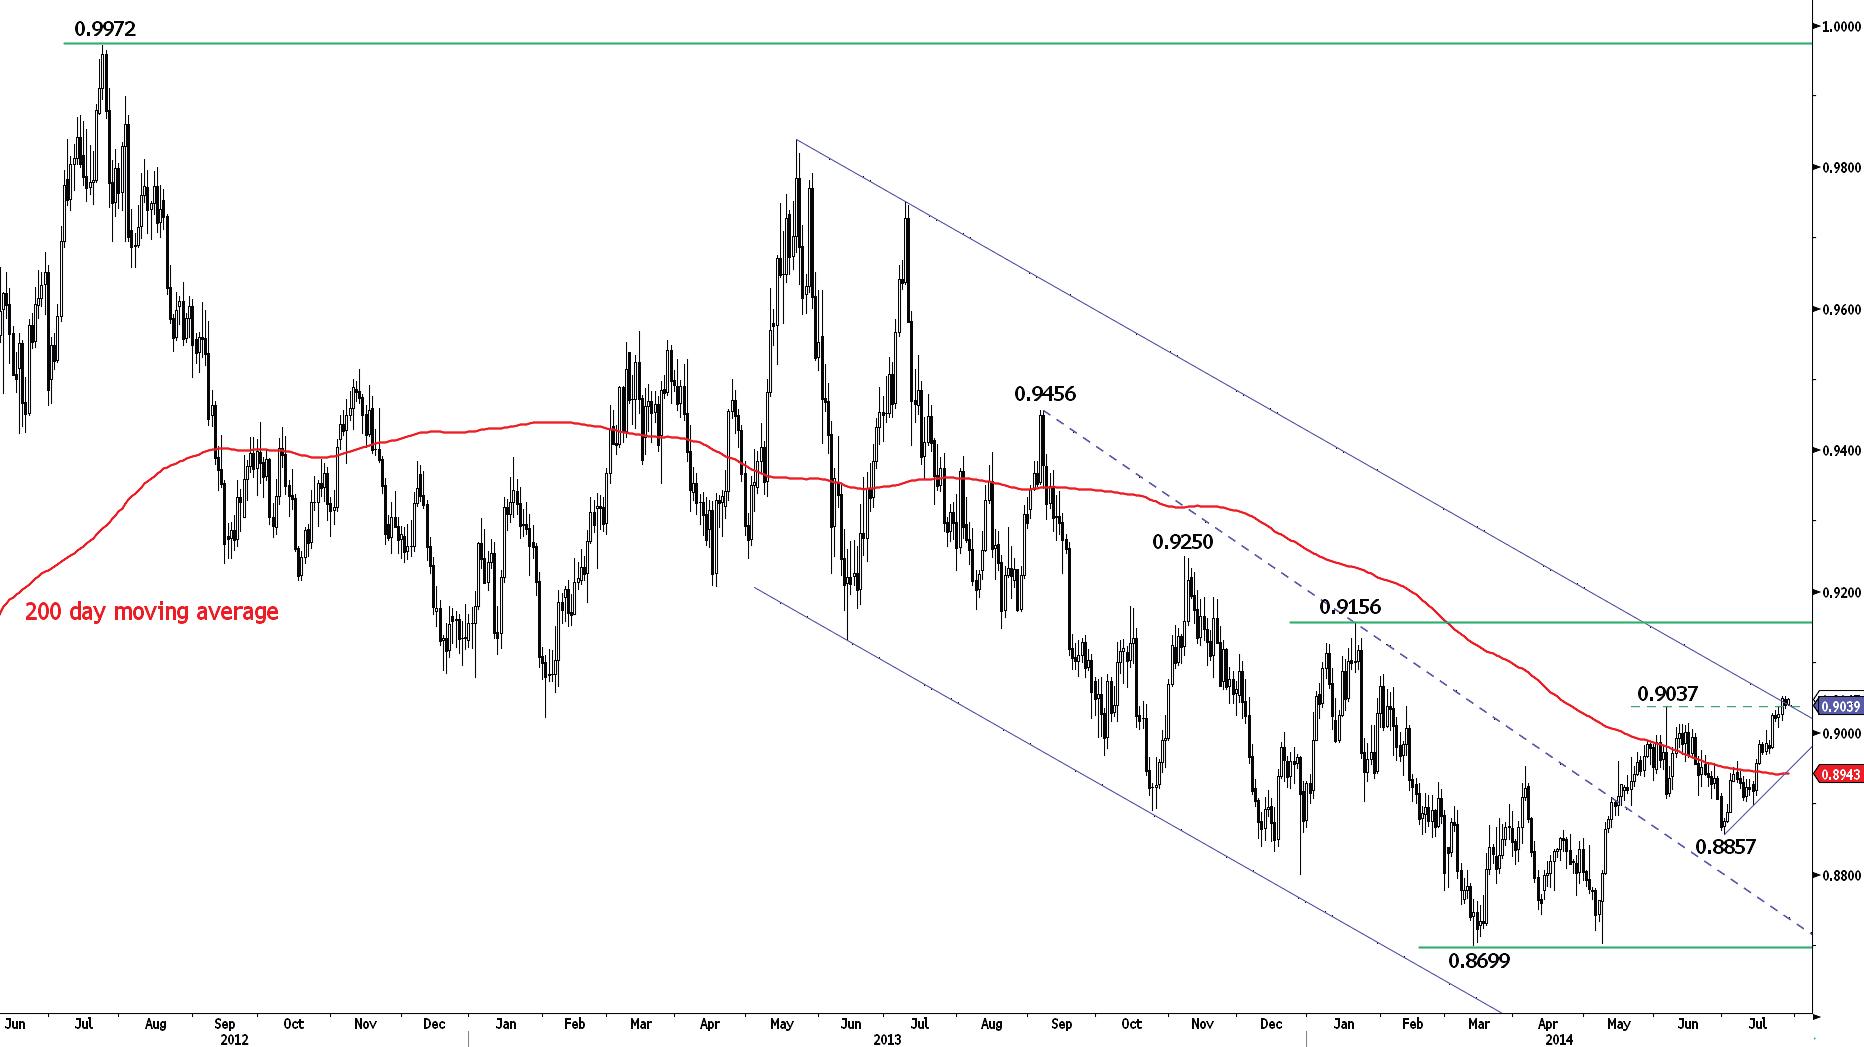
USD/CHF has broken the key resistance at 0.9037, suggesting persistent buying interest. Hourly supports can be found at 0.9031 (intraday low) and 0.9001 (intraday low). Another resistance lies at 0.9082 (03/02/2014 low).
From a longer term perspective, the bullish breakout of the key resistance at 0.8953 (04/04/2014 high) suggests the end of the large corrective phase that started in July 2012. The long-term upside potential implied by the double-bottom formation is 0.9207. Furthermore, a break of the resistance at 0.9037 would favour a second leg higher (echoing the one started on 8 May) with an upside potential at 0.9191. A strong resistance stands at 0.9156 (21/01/2014 high).
Await fresh signal.
USD/CAD
Challenging the resistance at 1.0814.
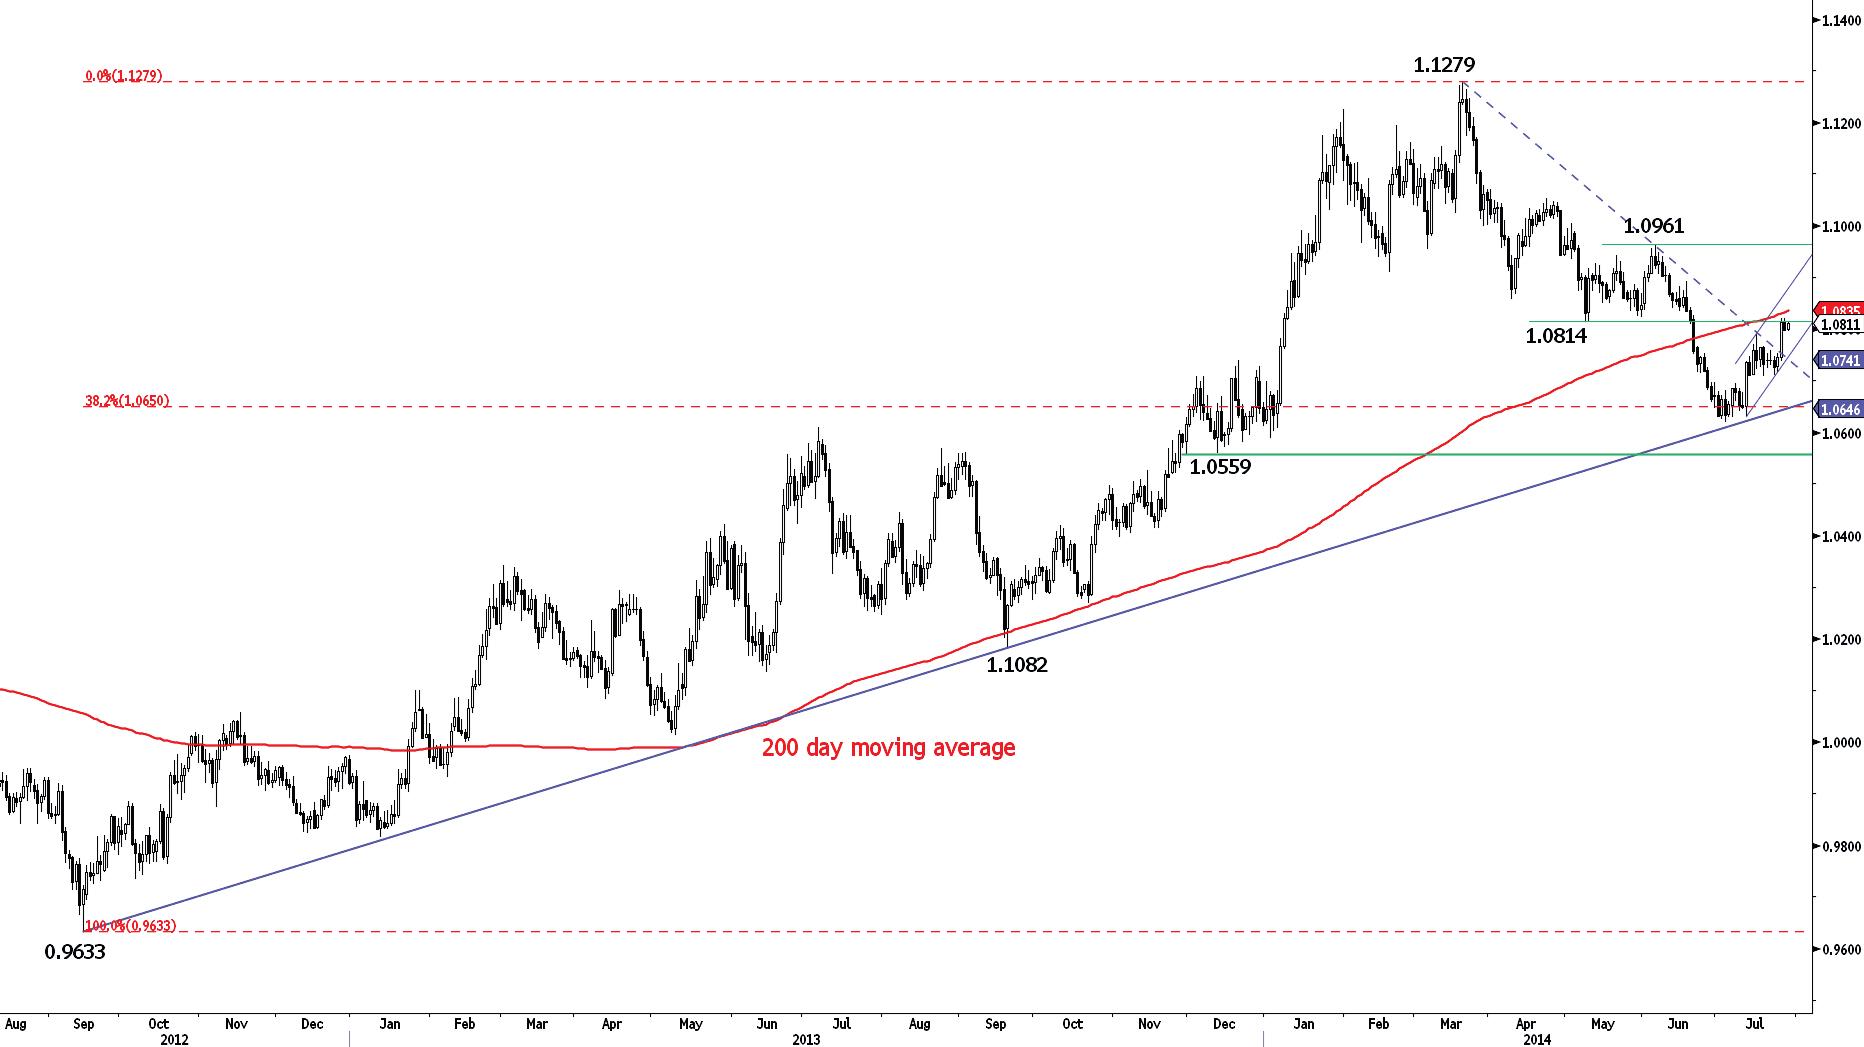
USD/CAD has improved after days of consolidation near the support at 1.0710 (14/07/2014 low). Monitor the test of the key resistance at 1.0814 (previous support, see also the 200 day moving average). Another resistance can be found at 1.0892 (18/06/2014 high). An initial support lies at 1.0794 (16/07/2014 high), while an hourly support can be found at 1.0766 (18/07/2014 high).
In the longer term, the technical structure looks like a rounding bottom whose minimum upside potential is at 1.1725. However, a break of the support area implied by the long-term rising trendline (around 1.0637) and 1.0559 (29/11/2013 low) would invalidate this long-term bullish configuration.
Await fresh signal.
AUD/USD
The support at 0.9380 has held thus far.
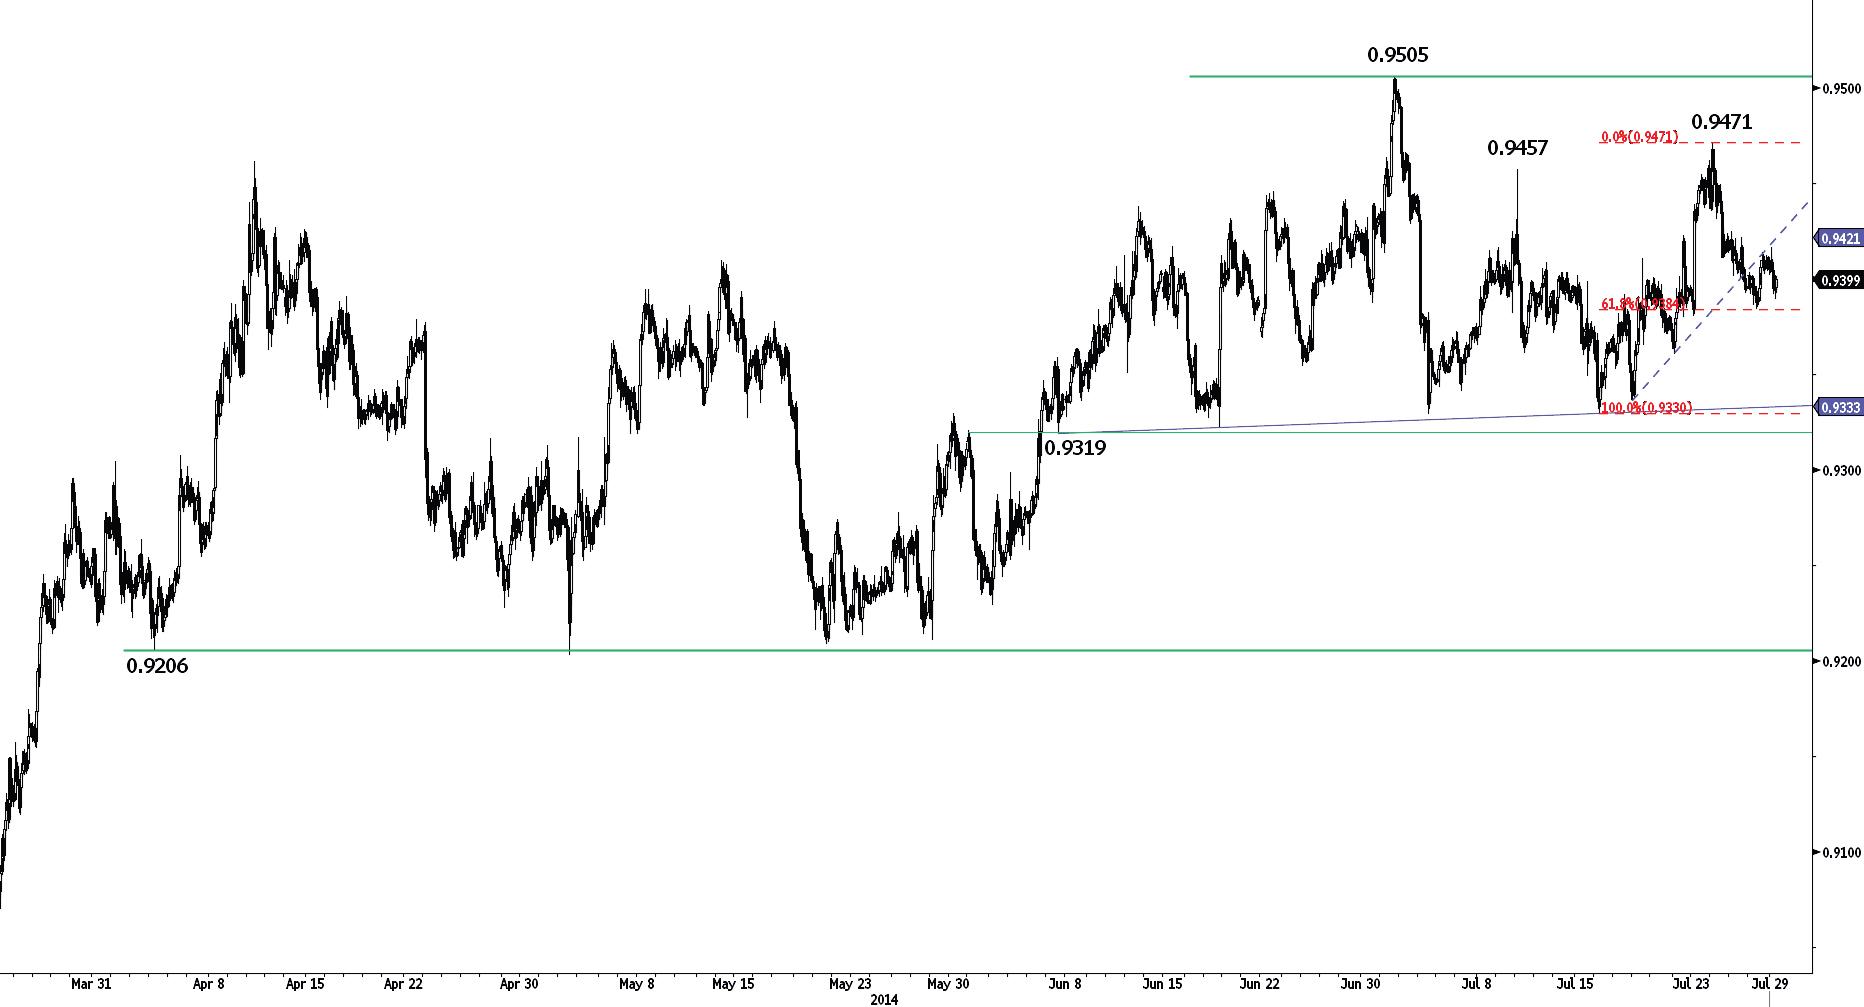
AUD/USD has weakened after its false breakout at 0.9457. Monitor the test of the support at 0.9380 (intraday low, see also the 61.8% retracement). An hourly resistance can be found at 0.9425 (25/07/2014 high). A key support stands at 0.9319.
In the longer term, prices are consolidating within the range defined by the key support at 0.9206 and the key resistance at 0.9461 (10/04/2014 high)/0.9505. A break of the support at 0.9319 is needed to suggest significant exhaustion in the buying interest.
Sell stop 2 units at 0.9309, Obj: Close 1 unit at 0.9212, remaining at 0.9007, Stop: 0.9348.
GBP/JPY
Exhaustion in selling pressures?
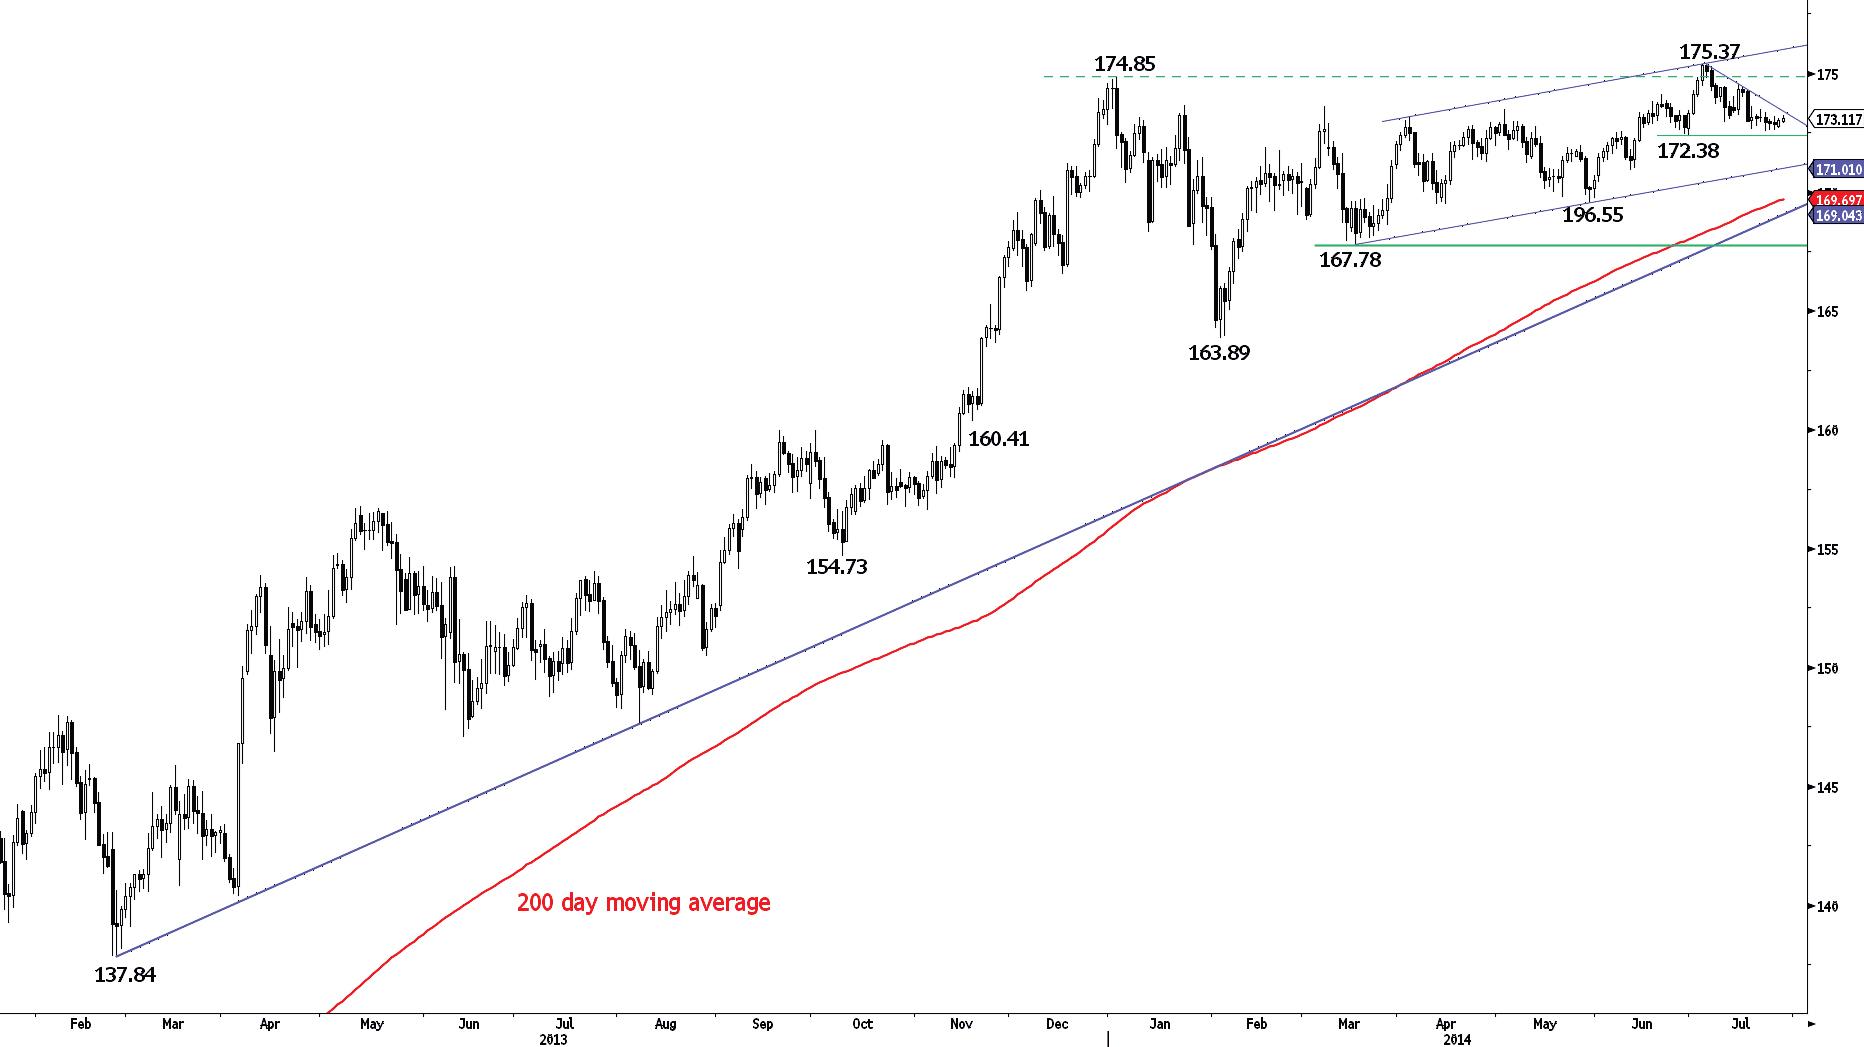
GBP/JPY has recently displayed small daily real bodies (dojis) indicating short-term indecision. A break of the hourly resistance at 173.59 (18/07/2014 high, see also the declining trendline) would suggest exhaustion in selling pressures. Another resistance stands at 174.57. A support stands at 172.38.
In the long-term, the break of the major resistance at 163.09 (07/08/2009 high) calls for further strength towards the resistance at 179.17 (15/08/2002 low). The long-term technical structure remains supportive as long as the key support at 167.78 (18/03/2014 low) holds.
Buy stop 2 units at 173.69, Obj: Close 1 unit at 175.24, remaining at 179.80, Stop: 173.00.
EUR/JPY
Bouncing.
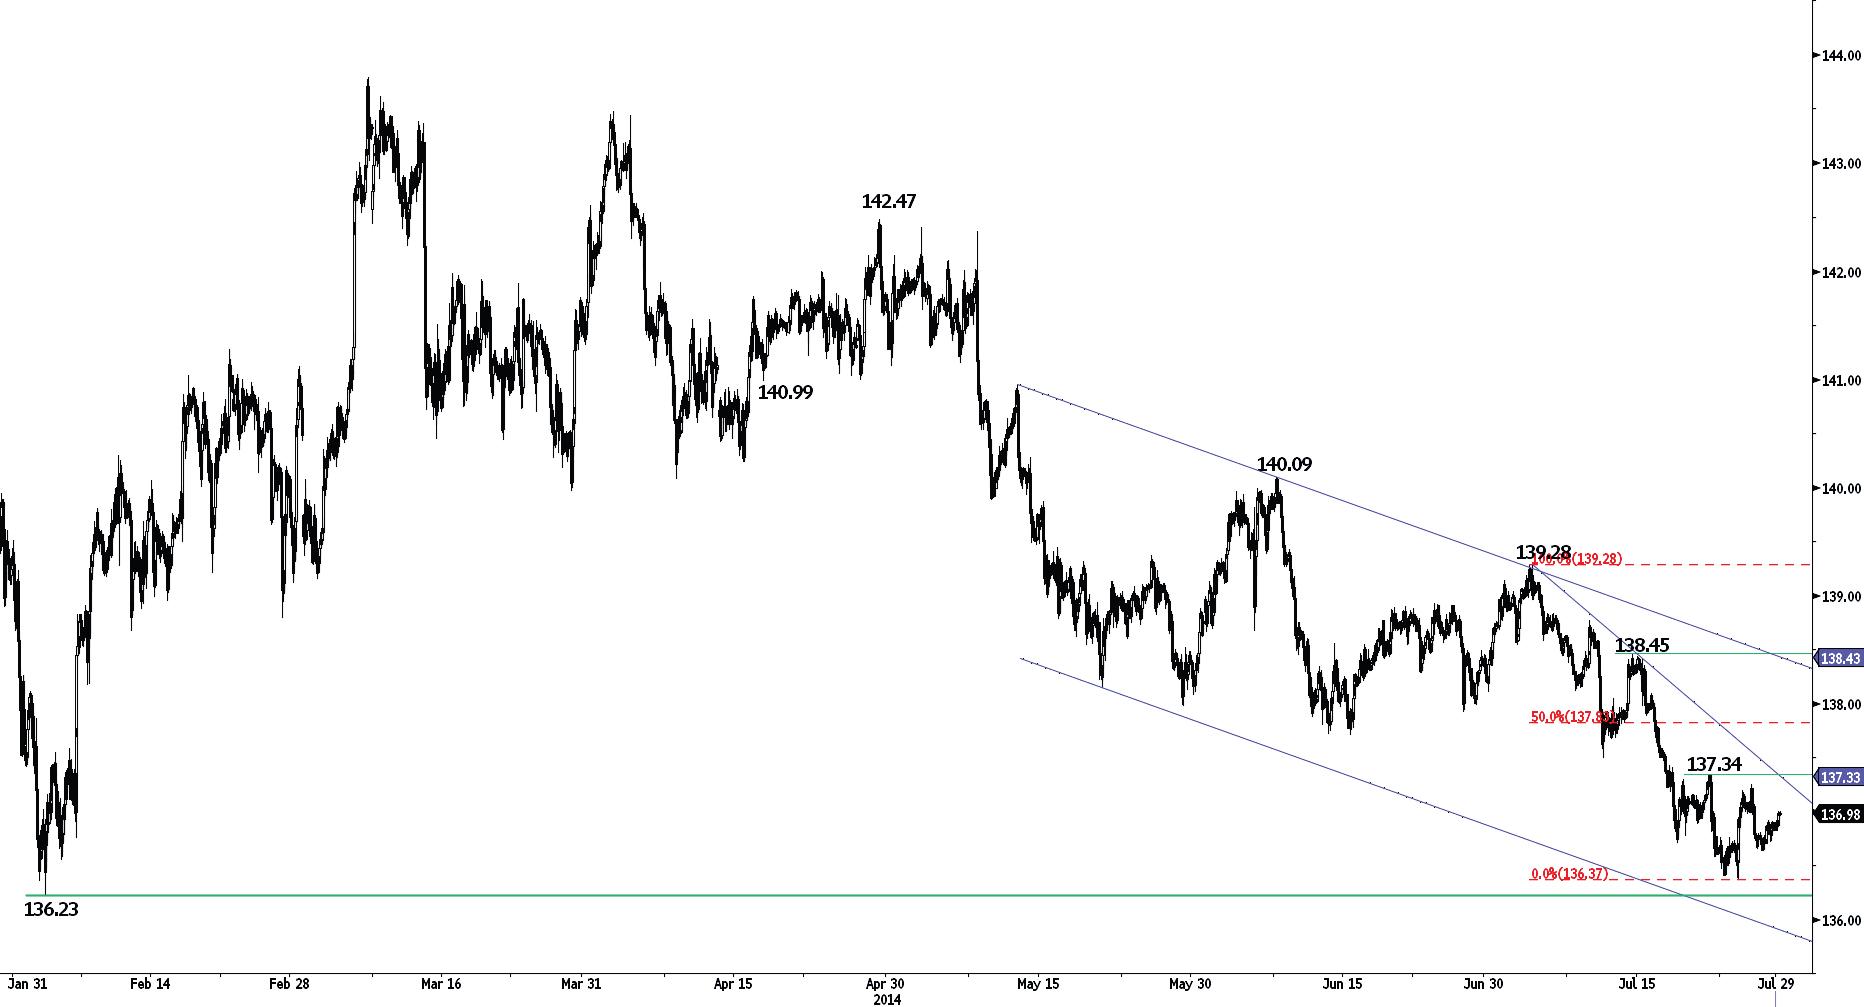
EUR/JPY is trying to bounce near the key support at 136.23. Hourly resistances are given by 137.34 (22/07/2014 high, see also the declining trendline) and 137.83 (50% retracement).
The bearish breakout of the 200 day moving average confirms a deterioration of the mediumterm technical structure. A key support stands at 136.23 (04/02/2014 low), while a strong resistance lies at 104.09 (09/06/2014 high).
The long-term technical structure remains positive as long as the support at 134.11 (20/11/2013 low) holds.
Await fresh signal.
EUR/GBP
Down trendlines remain intact.
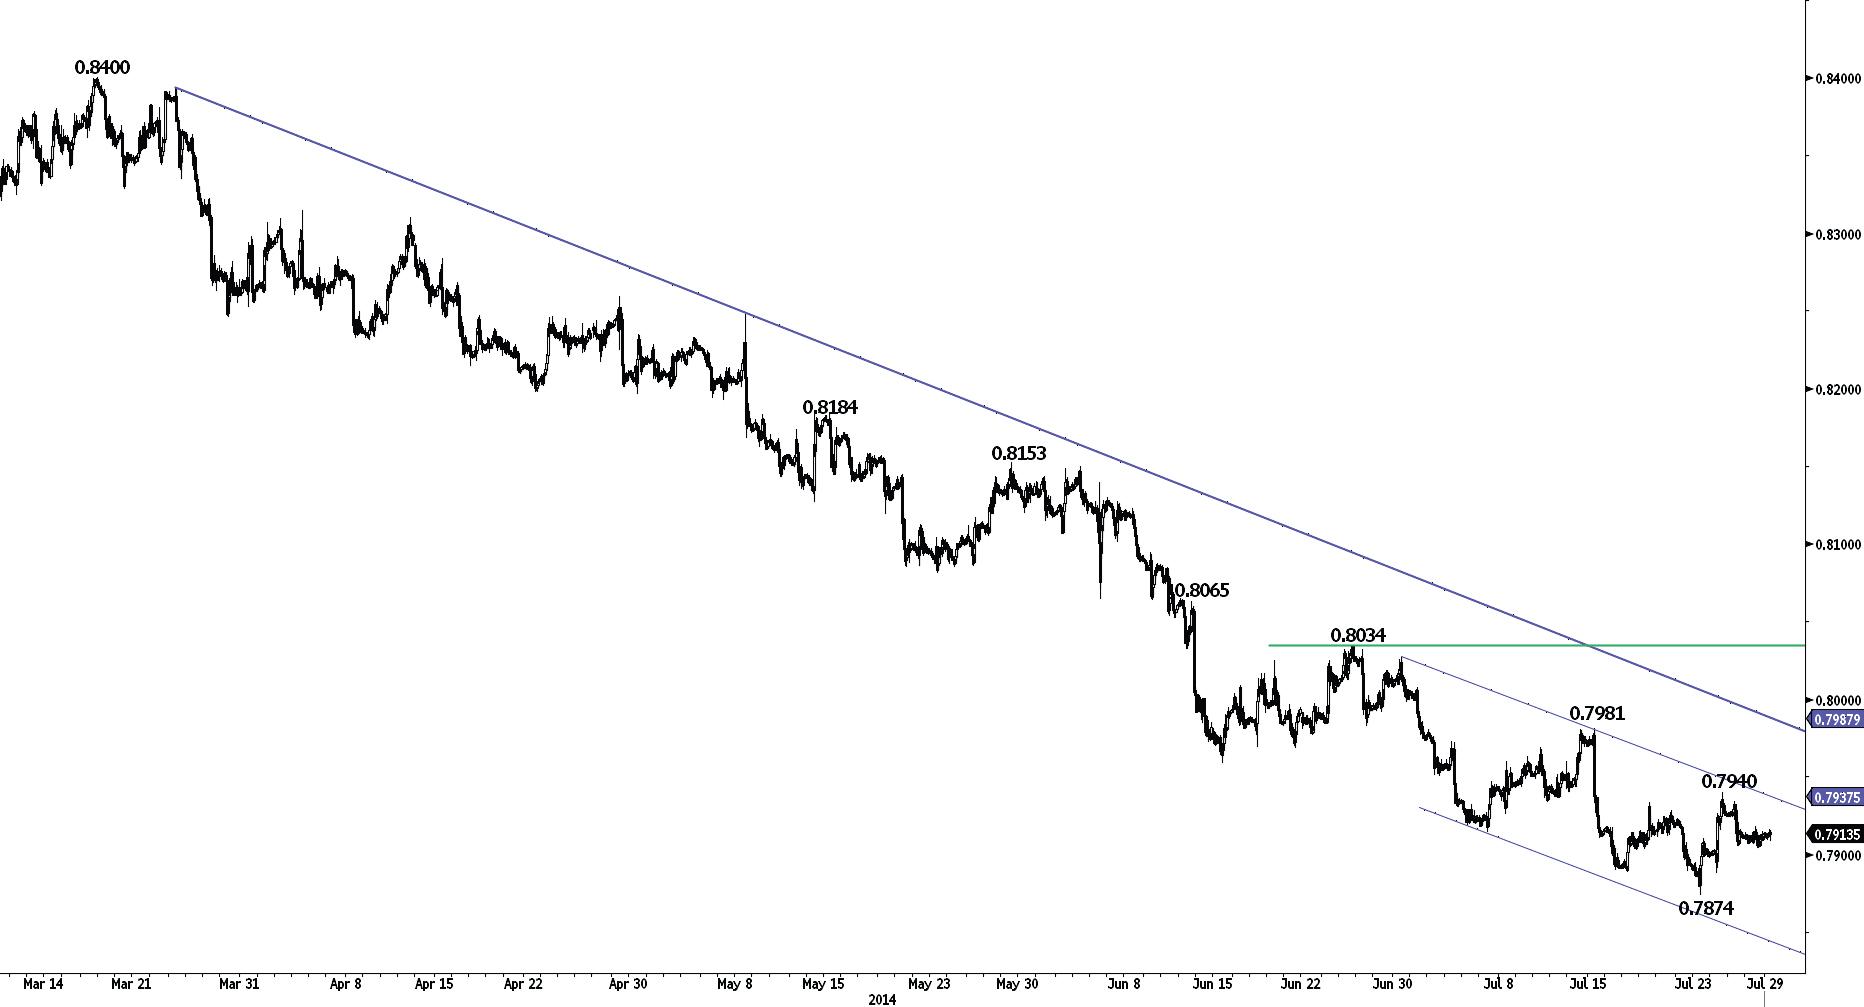
EUR/GBP is bouncing. However, the resistance implied by the top of the declining channel (around 0.7940) remains intact. Another resistance lies at 0.7981 (see also the declining trendline). An initial support can be found at 0.7904 (28/07/2014 low), while an hourly support stands at 0.7874.
In the longer term, the break of the key support area between 0.8082 (01/01/2013 low) and 0.8065 (05/06/2014 low) opens the way for a full retracement of the rise that started at 0.7755 (23/07/2012 low). Another strong support stands at 0.7694 (20/10/2008 low). A break of the resistance at 0.8034 (25/06/2014 high) is needed to suggest some exhaustion in the medium-term selling pressures.
Await fresh signal.
EUR/CHF
The resistance at 1.2158 has held thus far.
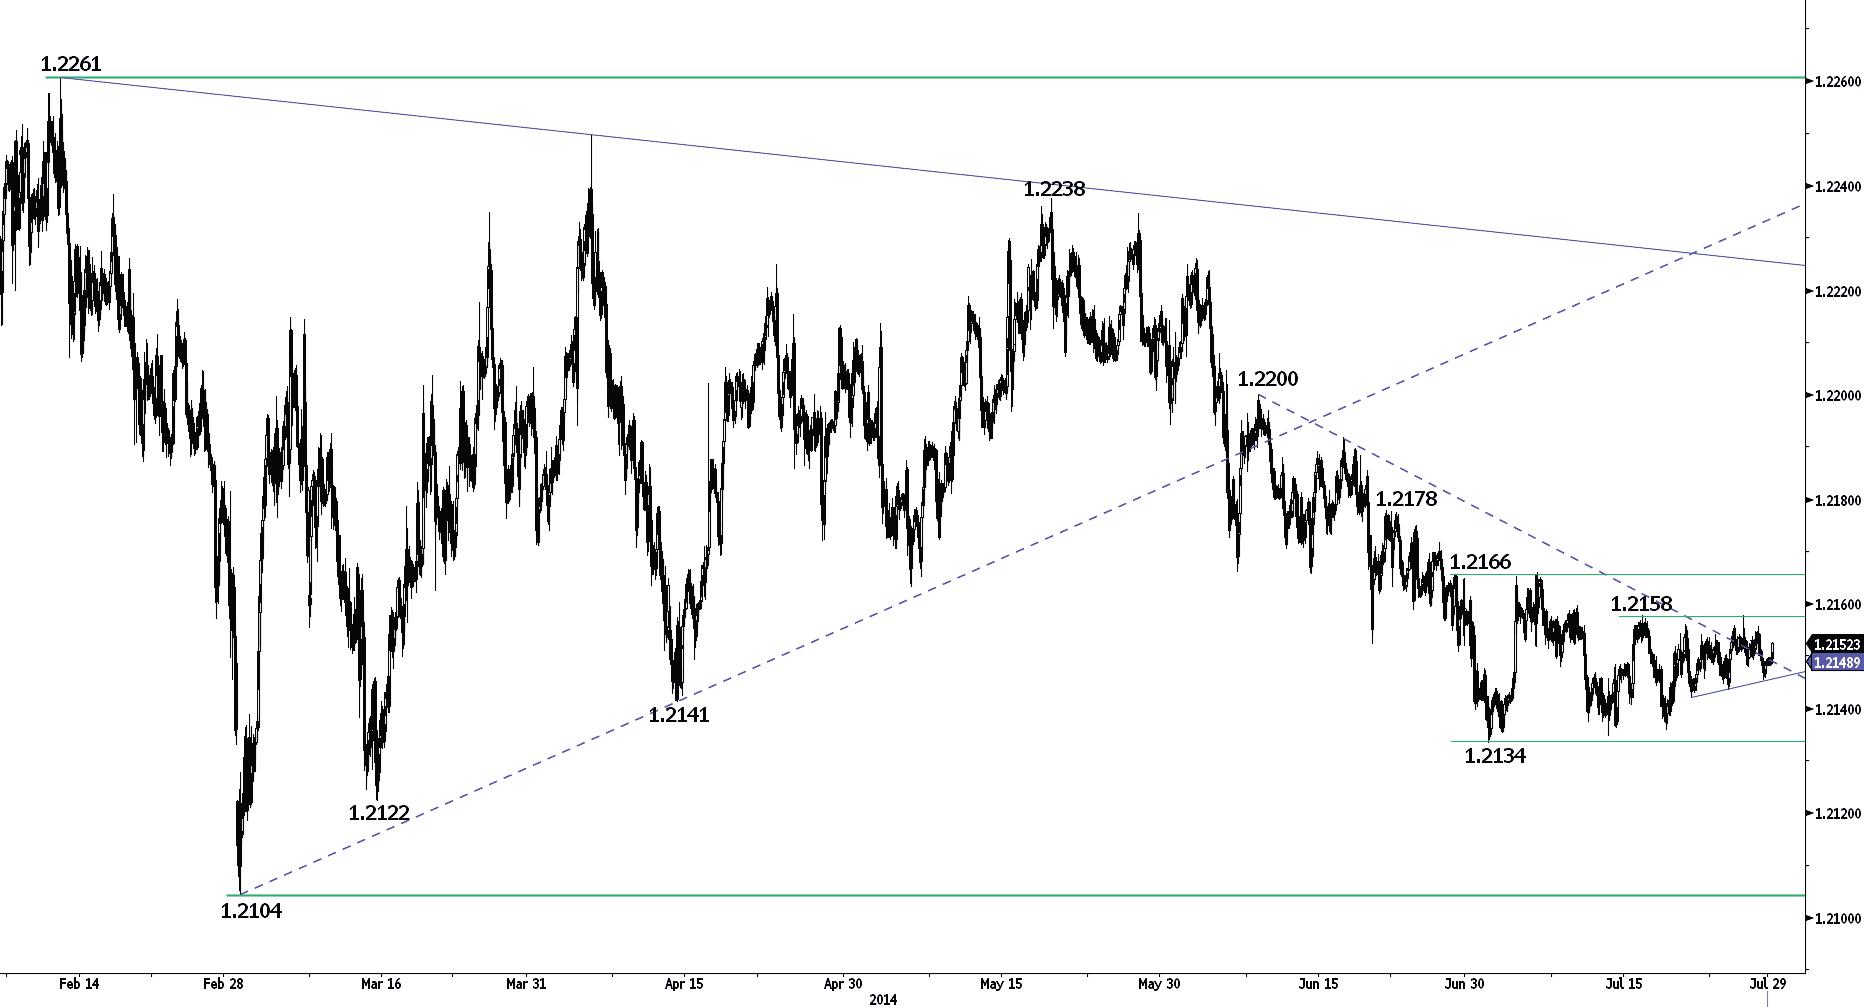
EUR/CHF is moving within the horizontal range defined by the support at 1.2134 and the resistance at 1.2166. The failure thus far to break the resistance at 1.2158 suggests persistent selling pressures. Furthermore, the aforementioned horizontal range needs to be broken to negate the downside risk at 1.2104 implied by the previous symmetrical triangle.
In the longer term, prices are moving in a broad horizontal range between the key support at 1.2104 and the resistance at 1.2261.
In September 2011, the SNB put a floor at 1.2000 in EUR/CHF, which is expected to hold in the foreseeable future.
Long 3 units at 1.2329, Objs: 1.2660/1.2985/1.3195, Stop: 1.1998 (Entered: 2013-01-23).
GOLD (in USD)
Bouncing.
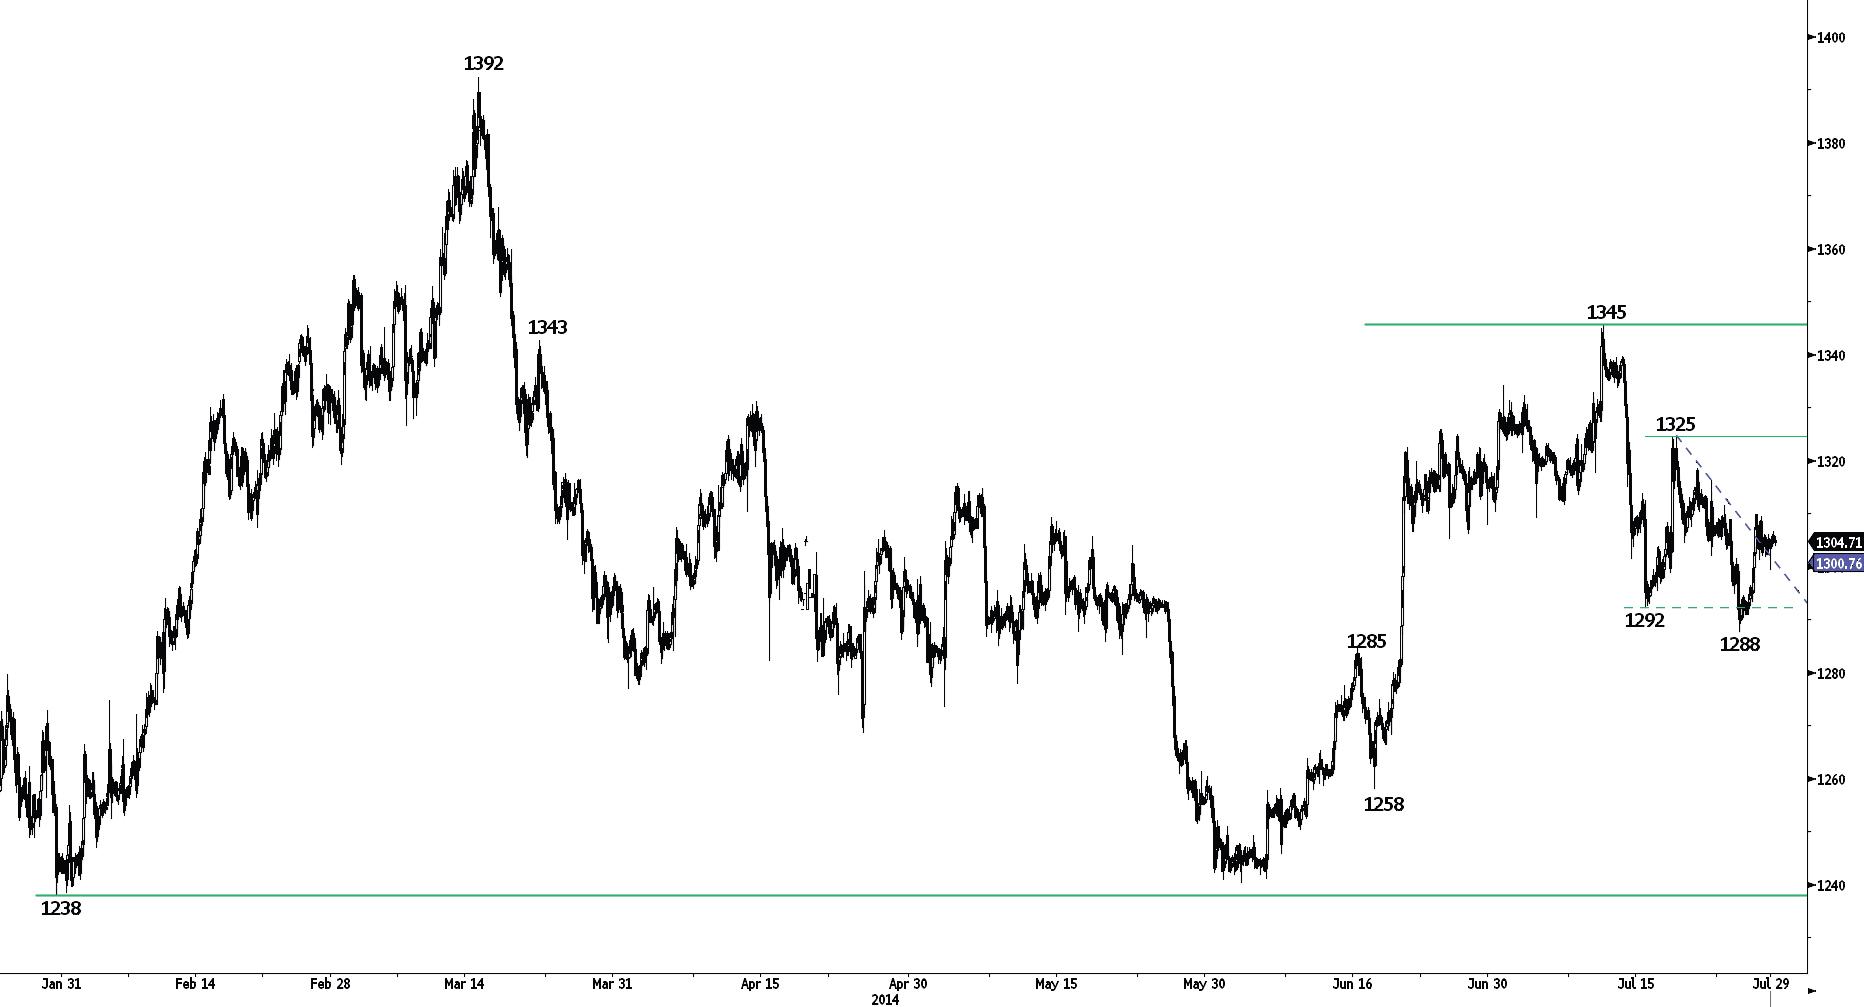
Gold is bouncing after the false breakout of the support at 1292. An hourly resistance can be found at 1311 (23/07/2014 high). Another resistance stands at 1325. Hourly supports now lie at 1299 (intraday low) and 1288 (24/07/2014 low).
In the long-term, we are sceptical that the horizontal range between the strong support at 1181 (28/06/2013 low) and the major resistance at 1434 (30/08/2013 high) is a long-term bullish reversal pattern. As a result, a decline towards the low of this range is eventually favoured.
Await fresh signal.
SILVER (in USD)
Monitor the declining channel.
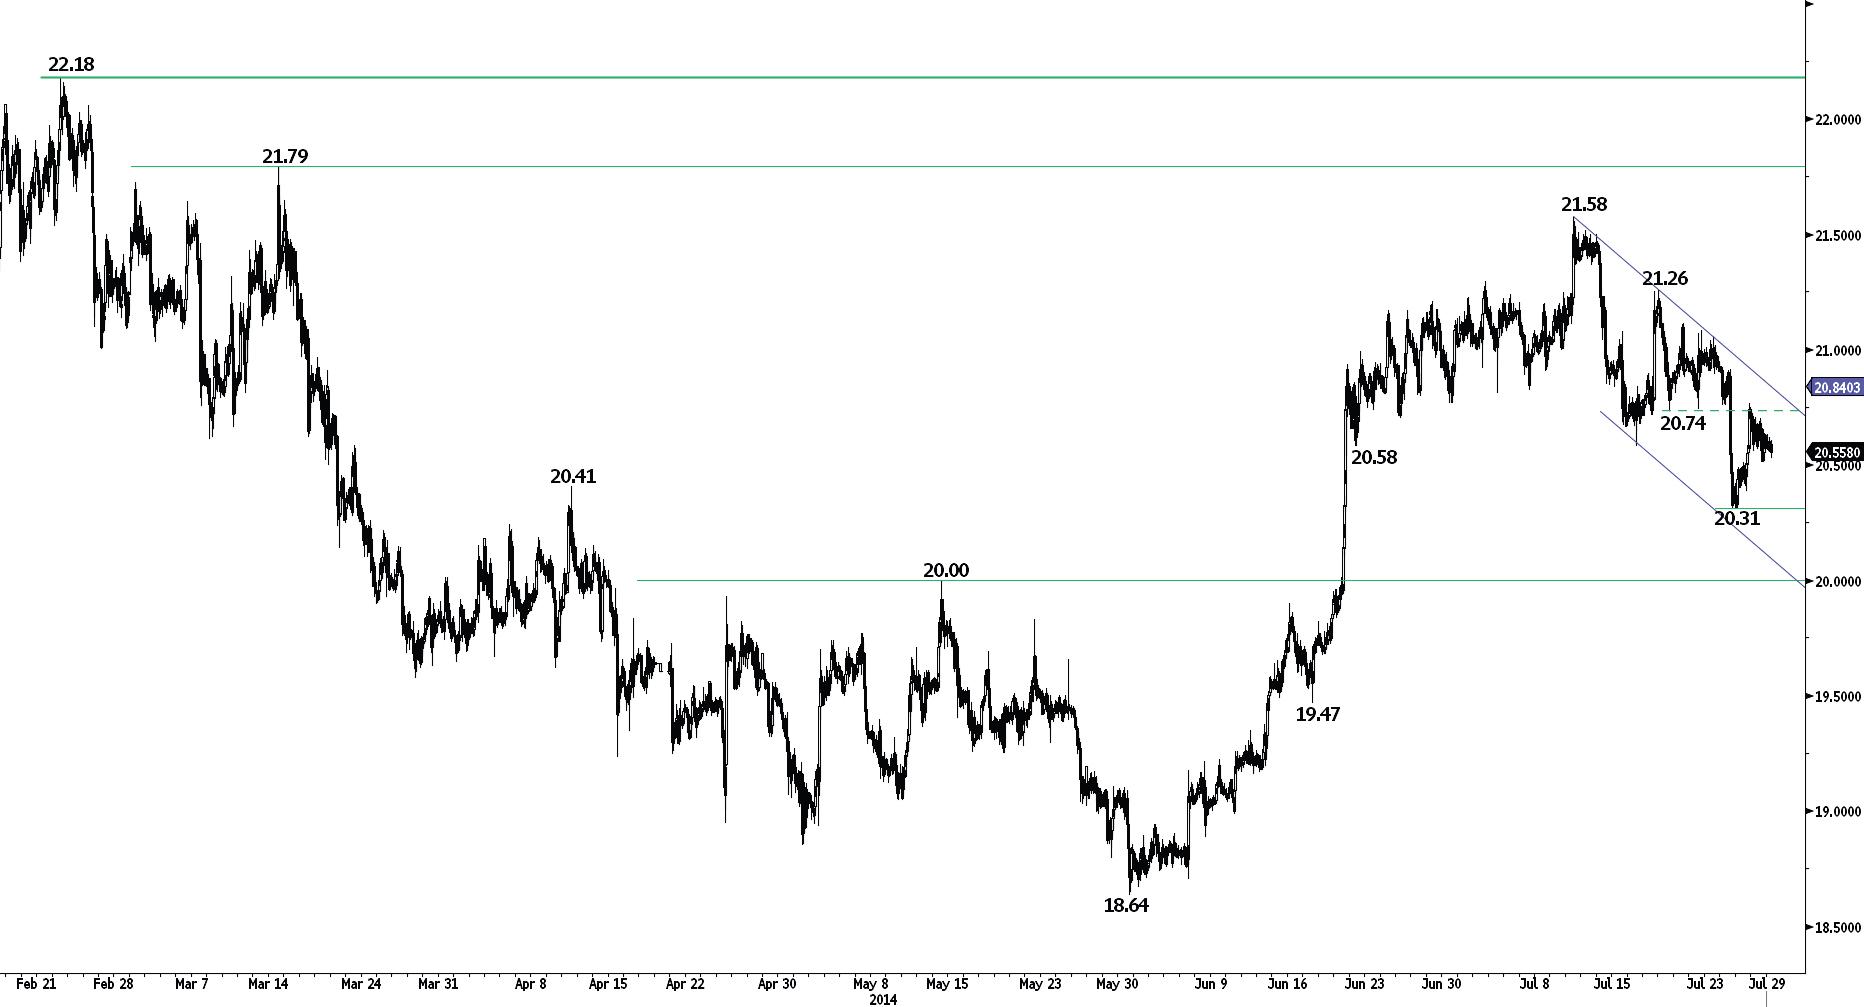
Silver is bouncing within its declining channel. Hourly resistances are given by the declining channel (around 20.84) and 21.11 (21/07/2014 high). Supports stand at 20.31 and 20.00.
In the long-term, the trend is negative. However, the successful test of the strong support area between 18.84 and 18.23 (28/06/2013 low) and the break of the resistance at 20.41 (24/02/2014 high) indicate clear exhaustion in the selling pressures. A key resistance stands at 22.18 (24/02/2014 high).
Await fresh signal.
This report has been prepared by Swissquote Bank Ltd and is solely been published for informational purposes and is not to be construed as a solicitation or an offer to buy or sell any currency or any other financial instrument. Views expressed in this report may be subject to change without prior notice and may differ or be contrary to opinions expressed by Swissquote Bank Ltd personnel at any given time. Swissquote Bank Ltd is under no obligation to update or keep current the information herein, the report should not be regarded by recipients as a substitute for the exercise of their own judgment.
Recommended Content
Editors’ Picks
EUR/USD holds above 1.0700 ahead of key US data

EUR/USD trades in a tight range above 1.0700 in the early European session on Friday. The US Dollar struggles to gather strength ahead of key PCE Price Index data, the Fed's preferred gauge of inflation, and helps the pair hold its ground.
USD/JPY stays above 156.00 after BoJ Governor Ueda's comments

USD/JPY holds above 156.00 after surging above this level with the initial reaction to the Bank of Japan's decision to leave the policy settings unchanged. BoJ Governor said weak Yen was not impacting prices but added that they will watch FX developments closely.
Gold price oscillates in a range as the focus remains glued to the US PCE Price Index

Gold price struggles to attract any meaningful buyers amid the emergence of fresh USD buying. Bets that the Fed will keep rates higher for longer amid sticky inflation help revive the USD demand.
Sei Price Prediction: SEI is in the zone of interest after a 10% leap

Sei price has been in recovery mode for almost ten days now, following a fall of almost 65% beginning in mid-March. While the SEI bulls continue to show strength, the uptrend could prove premature as massive bearish sentiment hovers above the altcoin’s price.
US core PCE inflation set to signal firm price pressures as markets delay Federal Reserve rate cut bets

The core PCE Price Index, which excludes volatile food and energy prices, is seen as the more influential measure of inflation in terms of Fed positioning. The index is forecast to rise 0.3% on a monthly basis in March, matching February’s increase.
