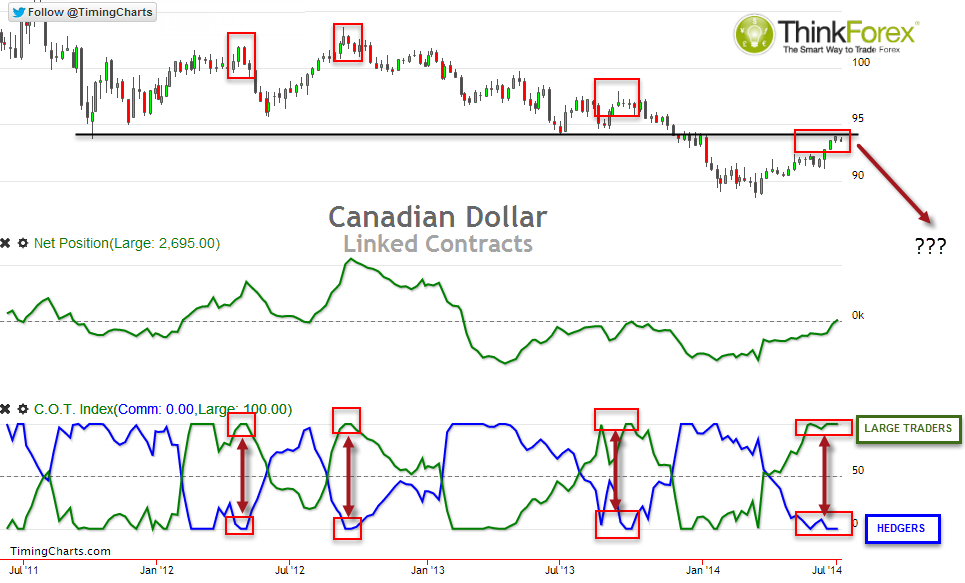
As the Canadian Dollar Futures reaches resistance the COTS positioning suggest a bullish sentiment extreme may on the cards.
As of last Tuesday the Canadian Dollar finally saw Large Traders Net Long (as represented by the top indicator crossing above the zero line). So does this confirm a long-term buys signal? Not necessarily if we look at the indicator below.
The bottom indicator shows the ratio between Longs vs Shorts between Large Traders and Hedgers.
Green Line: Large Traders Longs vs Shorts Ratio
Blue LIne: Hedgers - Long vs Shorts Ratio
The idea of this indicator is to suggest a sentiment extreme, based on the assumption that Large Traders (Speculative Hedge Funds etc.) tend to be trend traders, and are on the correct side of the market during trend. However if too many are on the same side then there is risk of a trend reversal.
The same can be said for Hedgers, who tend to be on the 'wrong' side of the market during trends but find themselves on the 'correct' side of the market during turning points. We can see that when both Large Traders reach the 100th percentile of 26 weeks and hedgers reach the 0 percentile over 26 weeks there has been a reversal within weeks.
Being a weekly chart, and using data that is delayed by over 1 week it does not generate trade signals itself but merely helps us assess how much fuel may be left in a move and suggest a sentiment extreme has been reached. These extremities can last for weeks and sometimes months, but it does provide a warning to us at least.
Also note that at time of writing we see the same 'sentiment extreme' signal on the 52-week percentile.
So whilst we have a warning signal we still need to use price action as our confirmation.
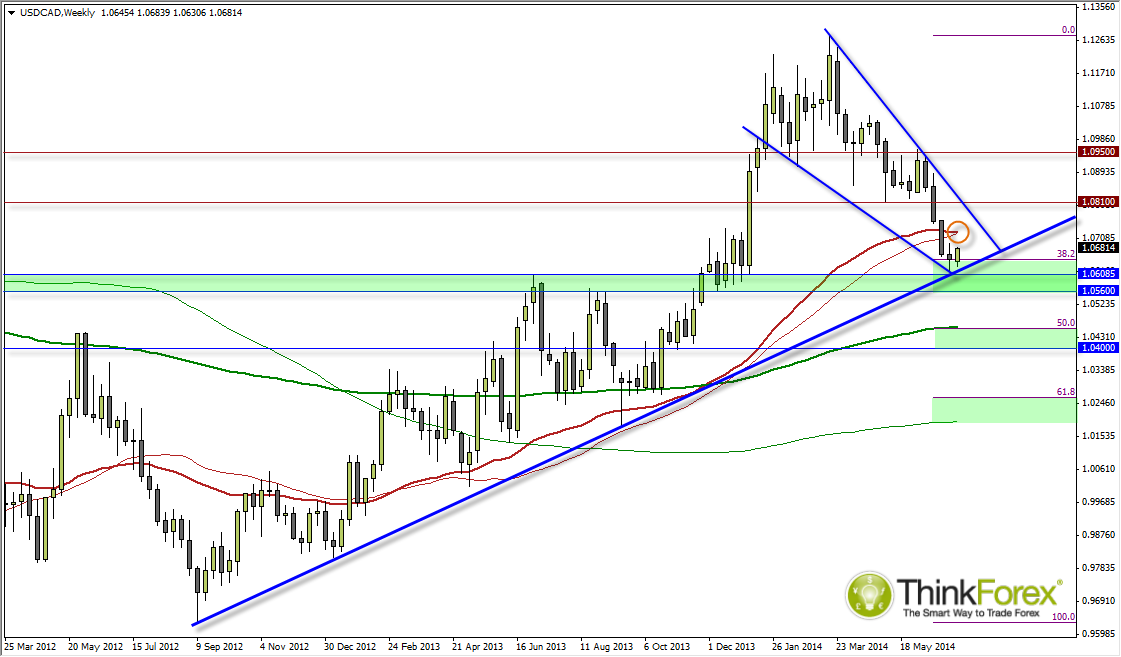
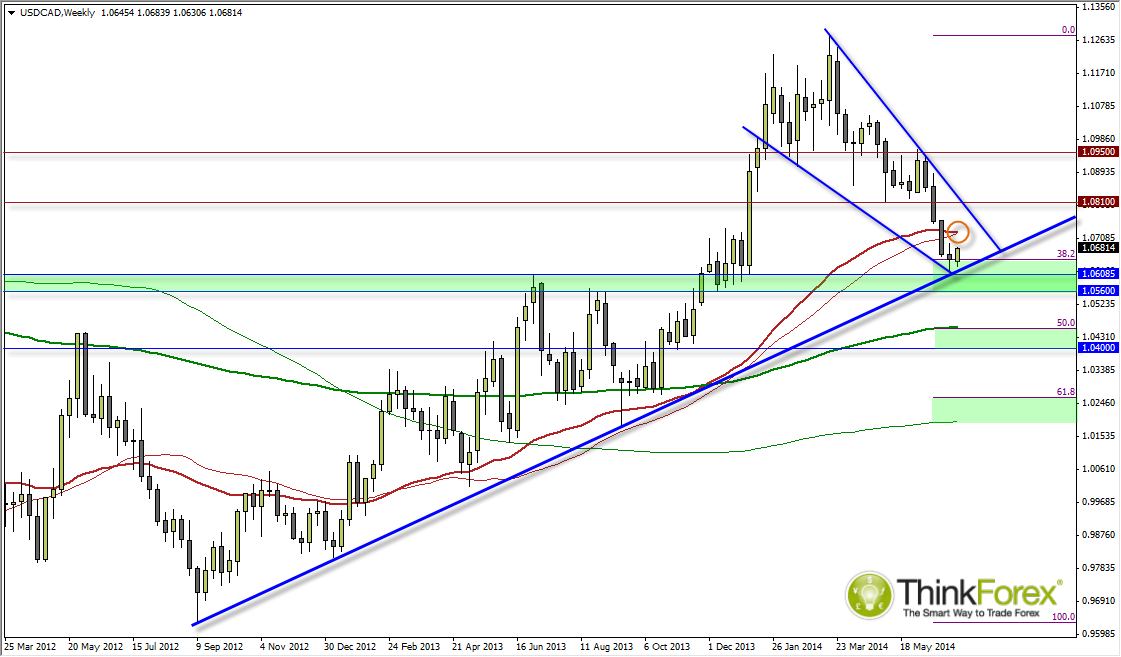
USDCAD is now testing a bullish trendline form the Sep '12 lows with the Weekly close being a Rikshaw Man Doji to warn of sideways trading. Price hovers around the 38.2% trendline but notice how the 50-week sMA and eMA are close by at 1.0723-25 which may act as interim resistance.
Remember that COTS are a long-term signal so it does not mean we will not see further lows, in which case we do have several layers of support between 1.056-1.06 which may be tested before a trend reversal.
However the main message of this post is to highlight that the bearish movement may be coming to an end over the coming weeks, and this leaves us open to messy price action as the ratio between bulls and bears readjust their positions.
Any moves up to 1.70 may entice bearish swing traders, so I would prefer to step aside form the bullish side until 1.70 is broken.
CFD and forex trading are leveraged products and can result in losses that exceed your deposits. They may not be suitable for everyone. Ensure you fully understand the risks. From time to time, City Index Limited’s (“we”, “our”) website may contain links to other sites and/or resources provided by third parties. These links and/or resources are provided for your information only and we have no control over the contents of those materials, and in no way endorse their content. Any analysis, opinion, commentary or research-based material on our website is for information and educational purposes only and is not, in any circumstances, intended to be an offer, recommendation or solicitation to buy or sell. You should always seek independent advice as to your suitability to speculate in any related markets and your ability to assume the associated risks, if you are at all unsure. No representation or warranty is made, express or implied, that the materials on our website are complete or accurate. We are not under any obligation to update any such material. As such, we (and/or our associated companies) will not be responsible or liable for any loss or damage incurred by you or any third party arising out of, or in connection with, any use of the information on our website (other than with regards to any duty or liability that we are unable to limit or exclude by law or under the applicable regulatory system) and any such liability is hereby expressly disclaimed
Recommended Content
Editors’ Picks
USD/JPY jumps above 156.00 on BoJ's steady policy

USD/JPY has come under intense buying pressure, surging past 156.00 after the Bank of Japan kept the key rate unchanged but tweaked its policy statement. The BoJ maintained its fiscal year 2024 and 2025 inflation forecast, disappointing the Japanese Yen buyers.
AUD/USD consolidates gains above 0.6500 after Australian PPI data

AUD/USD is consolidating gains above 0.6500 in Asian trading on Friday. The pair capitalizes on an annual increase in Australian PPI data. Meanwhile, a softer US Dollar and improving market mood also underpin the Aussie ahead of the US PCE inflation data.
Gold price keeps its range around $2,330, awaits US PCE data

Gold price is consolidating Thursday's rebound early Friday. Gold price jumped after US GDP figures for the first quarter of 2024 missed estimates, increasing speculation that the Fed could lower borrowing costs. Focus shifts to US PCE inflation on Friday.
Stripe looks to bring back crypto payments as stablecoin market cap hits all-time high

Stripe announced on Thursday that it would add support for USDC stablecoin, as the stablecoin market exploded in March, according to reports by Cryptocompare.
US economy: Slower growth with stronger inflation

The US Dollar strengthened, and stocks fell after statistical data from the US. The focus was on the preliminary estimate of GDP for the first quarter. Annualised quarterly growth came in at just 1.6%, down from the 2.5% and 3.4% previously forecast.


