![]() Nick Mastrandrea
Nick Mastrandrea
Market Tea Leaves
Good Morning Traders,
As of this writing 4:30 AM EST, here’s what we see:
US Dollar:Down at 94.385 the US Dollar is down 75 ticks and trading at 94.385.
Energies: May Crude is up at 41.40.
Financials: The June 30 year bond is down 9 ticks and trading at 165.03.
Indices: The June S&P 500 emini ES contract is up 32 ticks and trading at 2094.75.
Gold: The June gold contract is trading up at 1244.10. Gold is 91 ticks higher than its close.
Initial Conclusion
This is not a correlated market. The dollar is down- and crude is up+ which is normal and the 30 year bond is trading lower. The Financials should always correlate with the US dollar such that if the dollar is lower then bonds should follow and vice-versa. The indices are up and Crude is trading higher which is not correlated. Gold is trading up which is correlated with the US dollar trading down. I tend to believe that Gold has an inverse relationship with the US Dollar as when the US Dollar is down, Gold tends to rise in value and vice-versa. Think of it as a seesaw, when one is up the other should be down. I point this out to you to make you aware that when we don’t have a correlated market, it means something is wrong. As traders you need to be aware of this and proceed with your eyes wide open.
All of Asia traded higher with some exchanges trading in positive triple digit territory. As of this writing all of Europe is trading higher.
Possible Challenges To Traders Today
- Building Permits is out at 8:30 AM EST. This is major.
- Housing Starts is out at 8:30 AM EST. This is major.
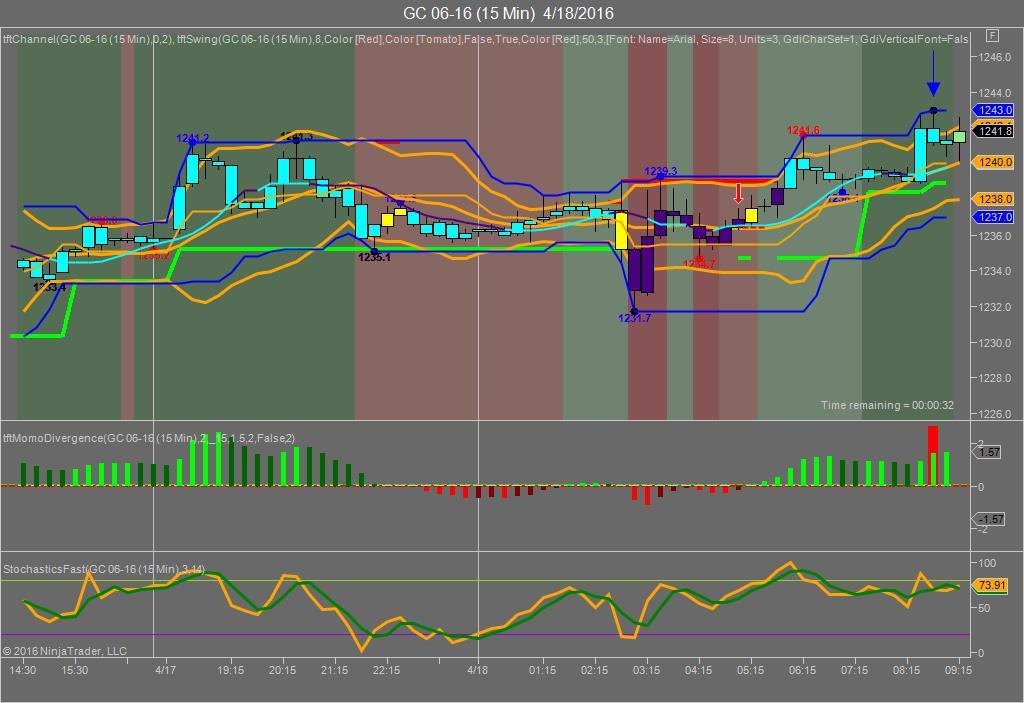
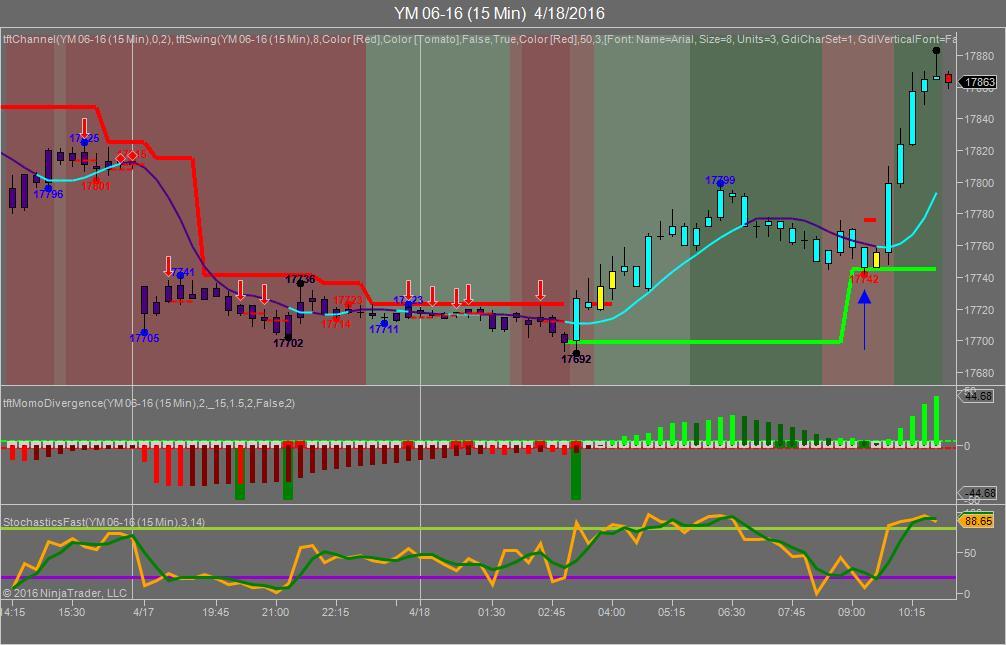
Gold
We’ve elected to switch gears a bit and show correlation between Gold and The YM futures contract. The YM contract is the DJIA and the purpose is to show reverse correlation between the two instruments. Remember it’s liken to a seesaw, when up goes up the other should go down and vice versa.
Yesterday Gold made it’s move at around 9 AM EST before the NAHB numbers came out. The YM hit a low at around that time and Gold hit a high. If you look at the charts below the YM gave a signal at around 9 AM EST, while Gold also gave a signal at just about the same time. Look at the charts below and you’ll see a pattern for both assets. The YM hit a low at around 9 AM EST and Gold hit a high. These charts represent the latest version of Trend Following Trades and I’ve changed the timeframe to a 15 minute chart to display better. This represented a shorting opportunity on Gold, as a trader you could have netted about 30 plus ticks per contract on this trade. Each tick is worth $10. We added a Donchian Channel to the charts to show the signals more clearly.
Charts Courtesy of Trend Following Trades built on a NinjaTrader platform
Bias
Yesterday we gave the markets an downside bias as the USD, Bonds and Gold were all trading higher and this does not bode well for an upside day. The markets however had other ideas as the Dow gained 107 points and the other indices gained ground as well. Today we aren’t dealing with a correlated market however our bias is to the upside.
Could this change? Of Course. Remember anything can happen in a volatile market.
Commentary
The NAHB (pronounced naboo) numbers came out at 10 AM yesterday that did not meet expectation. One would have thought the markets would drop based on this as this was the only real major economic report out yesterday. However that didn’t occur as the markets drove higher. Why? Could it be that the Smart Money didn’t want two losing days in a row? After all the markets did drop on Friday. But as we say each day in this newsletter, this can change…
Trading performance displayed herein is hypothetical. The following Commodity Futures Trading Commission (CFTC) disclaimer should be noted.
Hypothetical performance results have many inherent limitations, some of which are described below. No representation is being made that any account will or is likely to achieve profits or losses similar to those shown.
In fact, there are frequently sharp differences between hypothetical performance results and the actual results subsequently achieved by any particular trading program. One of the limitations of hypothetical performance trading results is that they are generally prepared with the benefit of hindsight.
In addition, hypothetical trading does not involve financial risk, and no hypothetical trading record can completely account for the impact of financial risk in actual trading. For example, the ability to withstand losses or to adhere to a particular trading program in spite of trading losses are material points which can also adversely affect actual trading results.
There are numerous other factors related to the markets in general or to the implementation of any specific trading program which cannot be fully accounted for in the preparation of hypothetical performance results and all of which can adversely affect actual trading results.
Trading in the commodities markets involves substantial risk and YOU CAN LOSE A LOT OF MONEY, and thus is not appropriate for everyone. You should carefully consider your financial condition before trading in these markets, and only risk capital should be used.
In addition, these markets are often liquid, making it difficult to execute orders at desired prices. Also, during periods of extreme volatility, trading in these markets may be halted due to so-called “circuit breakers” put in place by the CME to alleviate such volatility. In the event of a trading halt, it may be difficult or impossible to exit a losing position.
Recommended Content
Editors’ Picks
USD/JPY holds above 155.50 ahead of BoJ policy announcement

USD/JPY is trading tightly above 155.50, off multi-year highs ahead of the BoJ policy announcement. The Yen draws support from higher Japanese bond yields even as the Tokyo CPI inflation cooled more than expected.
AUD/USD extends gains toward 0.6550 after Australian PPI data

AUD/USD is extending gains toward 0.6550 in Asian trading on Friday. The pair capitalizes on an annual increase in Australian PPI data. Meanwhile, a softer US Dollar and improving market mood also underpin the Aussie ahead of the US PCE inflation data.
Gold price keeps its range around $2,330, awaits US PCE data

Gold price is consolidating Thursday's rebound early Friday. Gold price jumped after US GDP figures for the first quarter of 2024 missed estimates, increasing speculation that the Fed could lower borrowing costs. Focus shifts to US PCE inflation on Friday.
Stripe looks to bring back crypto payments as stablecoin market cap hits all-time high

Stripe announced on Thursday that it would add support for USDC stablecoin, as the stablecoin market exploded in March, according to reports by Cryptocompare.
Bank of Japan expected to keep interest rates on hold after landmark hike

The Bank of Japan is set to leave its short-term rate target unchanged in the range between 0% and 0.1% on Friday, following the conclusion of its two-day monetary policy review meeting for April. The BoJ will announce its decision on Friday at around 3:00 GMT.