![]() Nadia Simmons
Nadia Simmons
Sunshine Profits
Earlier today, official data showed that euro zone industrial production declined by 0.8% in Feb (month-on-month), missing analysts’ forecasts. Additionally, industrial production (year to year) rose less-than-expected in Feb, which pushed the euro lower against the greenback. As a result, EUR/USD declined under the Feb high, invalidating earlier breakout. How low could the exchange go in the coming days?
In our opinion, the following forex trading positions are justified – summary:
EUR/USD: short (stop-loss order at 1.1512; initial downside target at 1.0572)
GBP/USD: none
USD/JPY: none
USD/CAD: none
USD/CHF: none
AUD/USD: none
EUR/USD
Yesterday, we wrote:
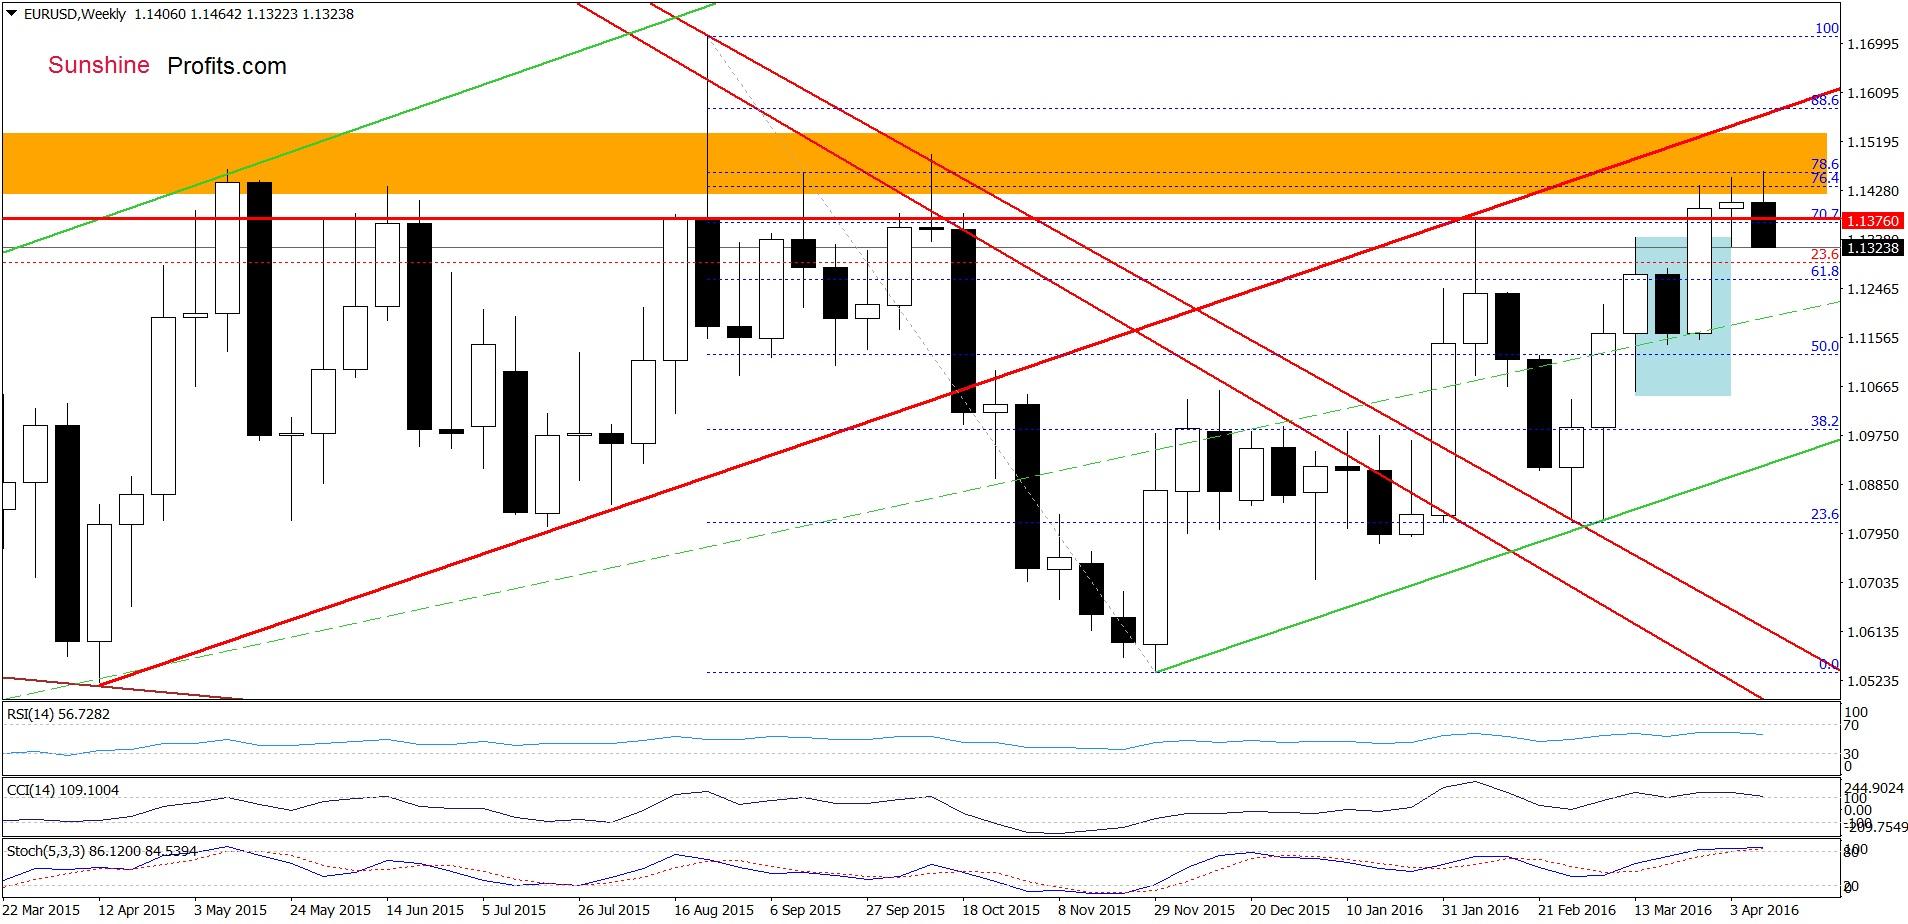
(…) although EUR/USD moved little higher, the pair remains under the key orange resistance zone. Therefore, in our opinion, as long as there won’t be a breakout above it and the red rising resistance line (based on the Apr and Jul 2015 lows), further improvement is not likely to be seen.
From today’s point of view we see that the above-mentioned key resistance zone stopped currency bulls once again, triggering a pullback. With this drop the exchange rate slipped under the Feb high, invalidating earlier breakout, which is a negative signal that suggests further deterioration. Additionally, the CCI and Stochastic Oscillator are very close to generating sell signals, which increases the probability of further declines.
How did this decline affect the very short-term picture? Let’s check.
Quoting our previous alert:
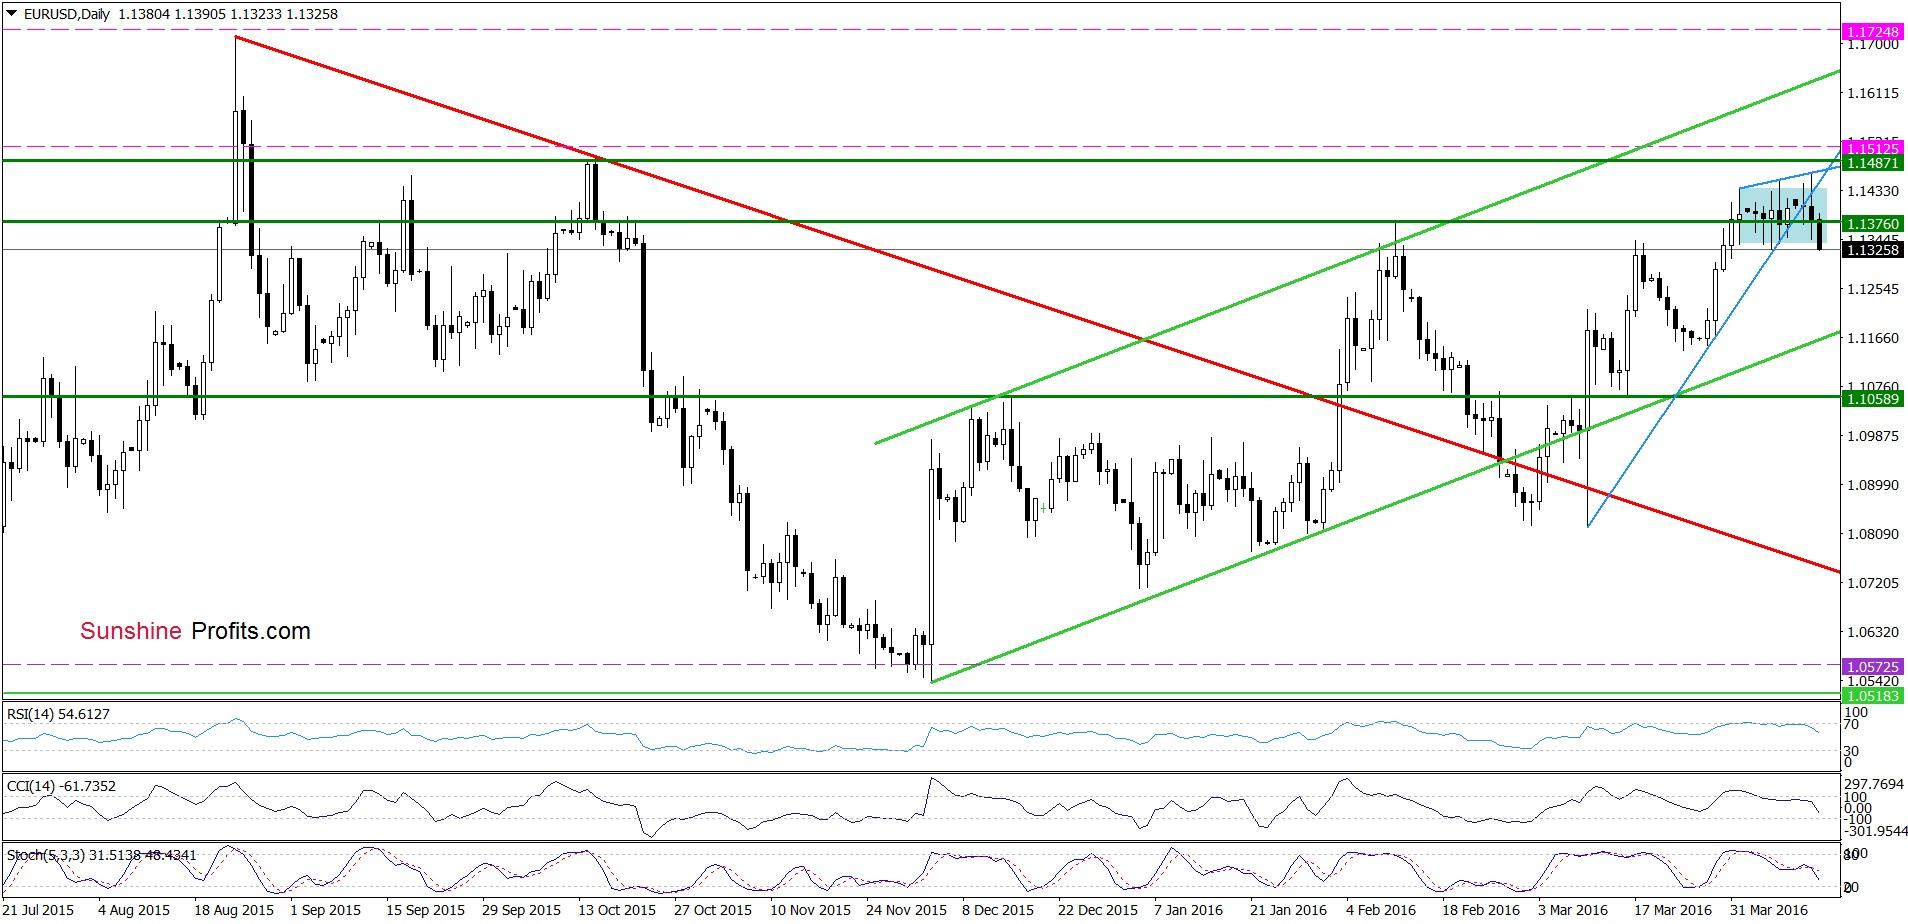
(…) although EUR/USD moved higher earlier today and climbed above the upper line of the blue consolidation, this improvement was temporary as the blue resistance line (based on the previous highs) in combination with the proximity to the Oct high encouraged currency bears to act. As a result, the pair pulled back under the blue raising support line, which suggests further deterioration. Nevertheless, such price action would be more likely if the exchange rate closes today’s session below it.
As you see on the daily chart the situation developed in line with the above scenario and EUR/USD closed yesterday’s session below the blue raising support line, which is also lower border of the blue rising wedge. This negative signal triggered further deterioration earlier today, which resulted in a drop under the lower border of the blue consolidation. This is a bearish sign, which in combination with sell signals generated by the indicators suggests further deterioration in the coming days. How low could the pair go? In our opinion, the first downside target would be around 1.1219, where the 38.2% Fibonacci retracement (based on Mar-Apr upward move) is. If it is broken, we’ll see a test of the support zone created by the late-March lows and the 50% retracement in the coming days.
Very short-term outlook: bearish
Short-term outlook: bearish
MT outlook: mixed with bearish bias
LT outlook: mixed
Trading position (short-term; our opinion): Short positions (with a stop-loss order at 1.1512 and the initial downside target at 1.0572) are justified from the risk/reward perspective.
USD/CAD
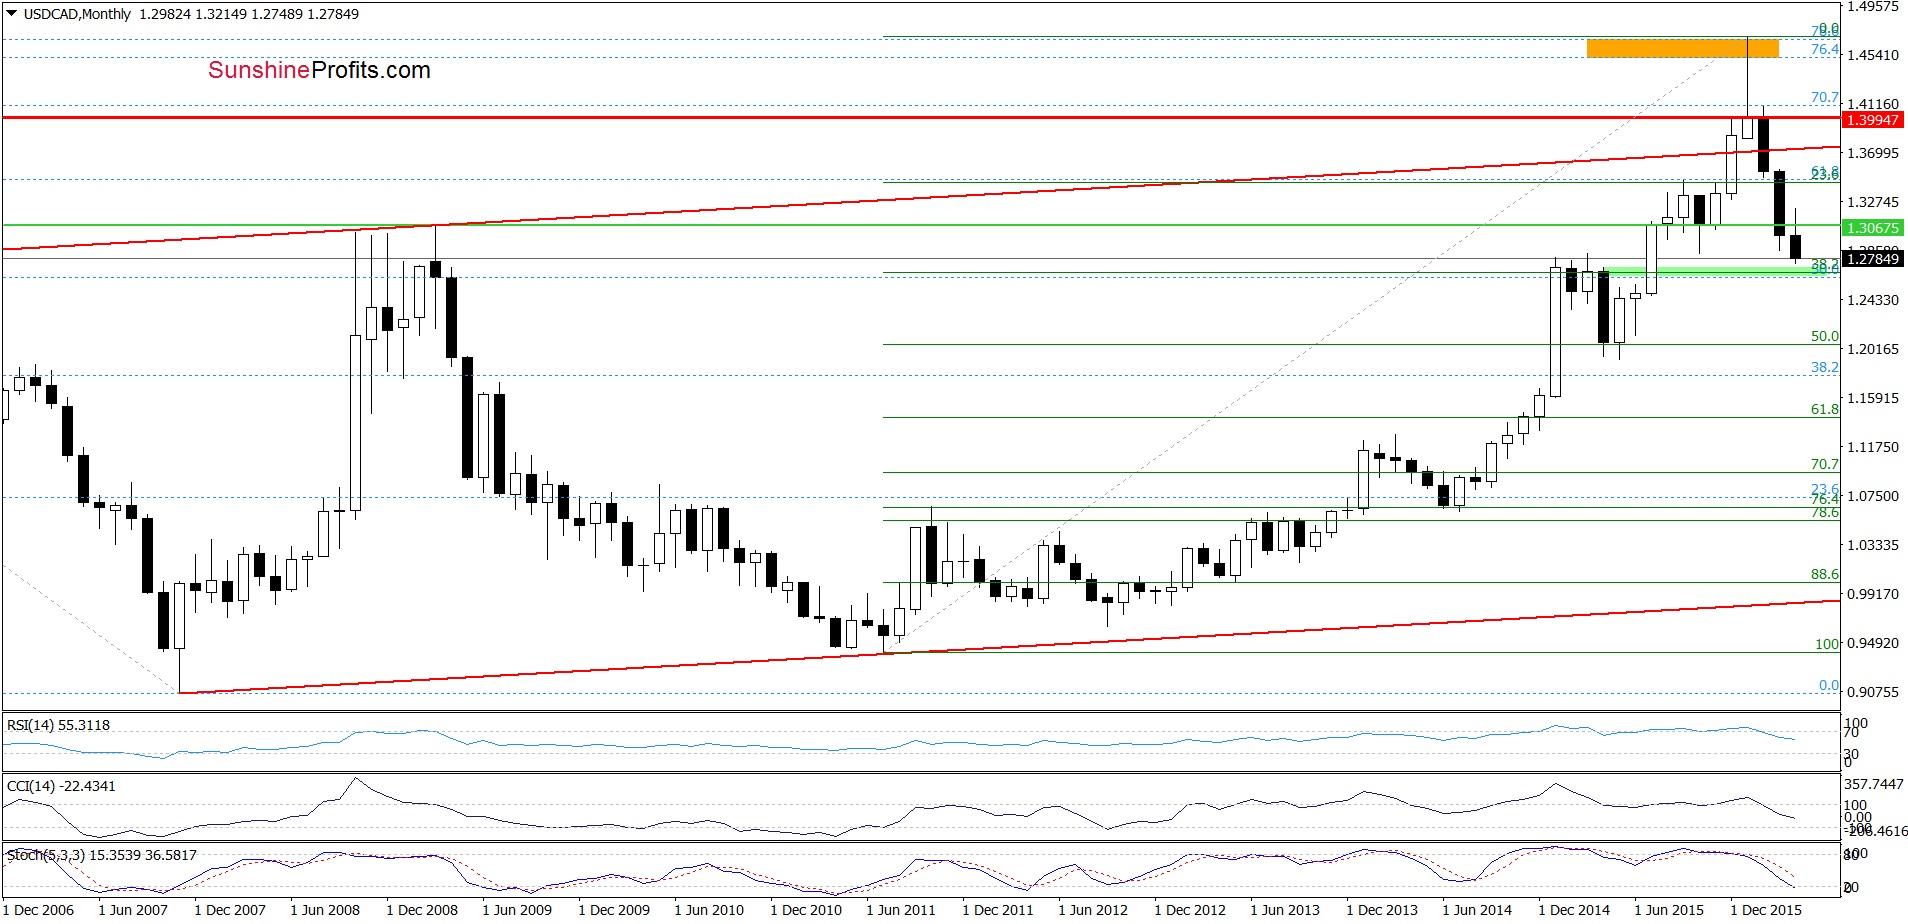
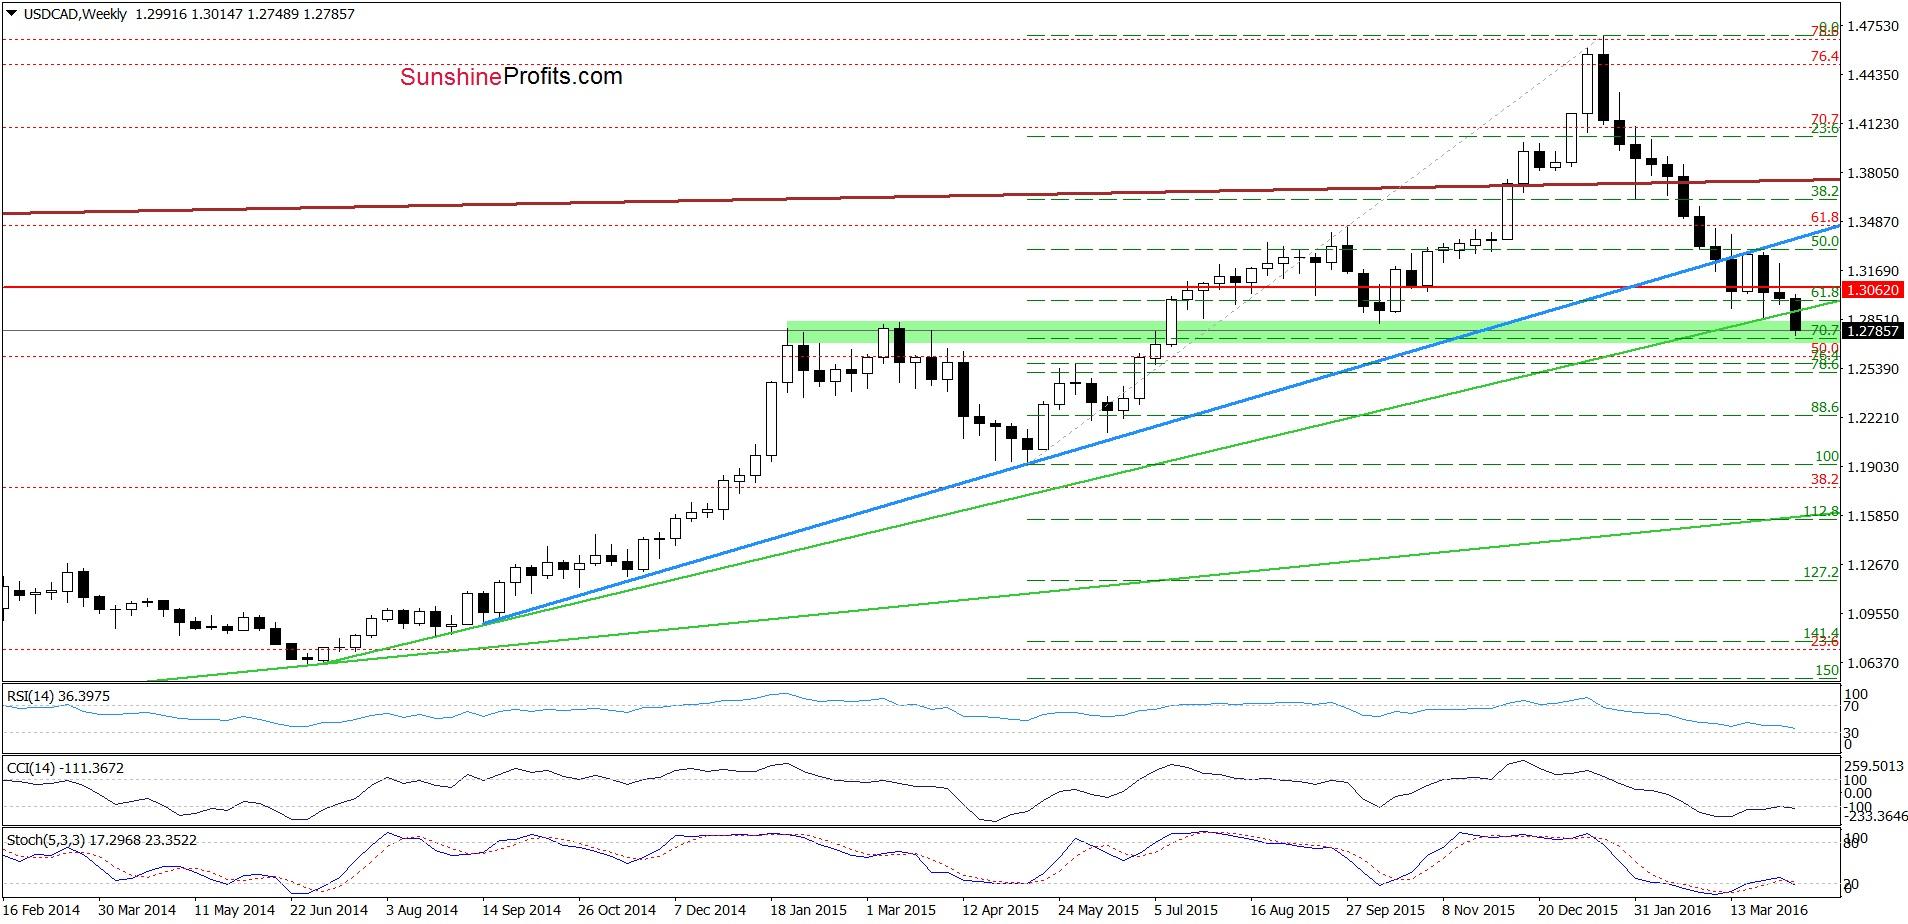
Looking at the long- and medium-term picture of USD/CAD we see that the pair declined under the long-term green support line, which resulted in a drop to the green support zone created by the Jan and March 2015 highs and reinforced by the 70.7% Fibonacci retracement (based on May-Jan rally). Taking this fact into account, we think that reversal is just around the corner – even if the exchange rate moves lower once again and test the strength of the 38.2% Fibonacci retracement based on the entire Jul 2011-Jan 2016 upward move (around 1.2666) in the coming week.
Very short-term outlook: mixed
Short-term outlook: mixed
MT outlook: mixed
LT outlook: mixed
USD/CHF

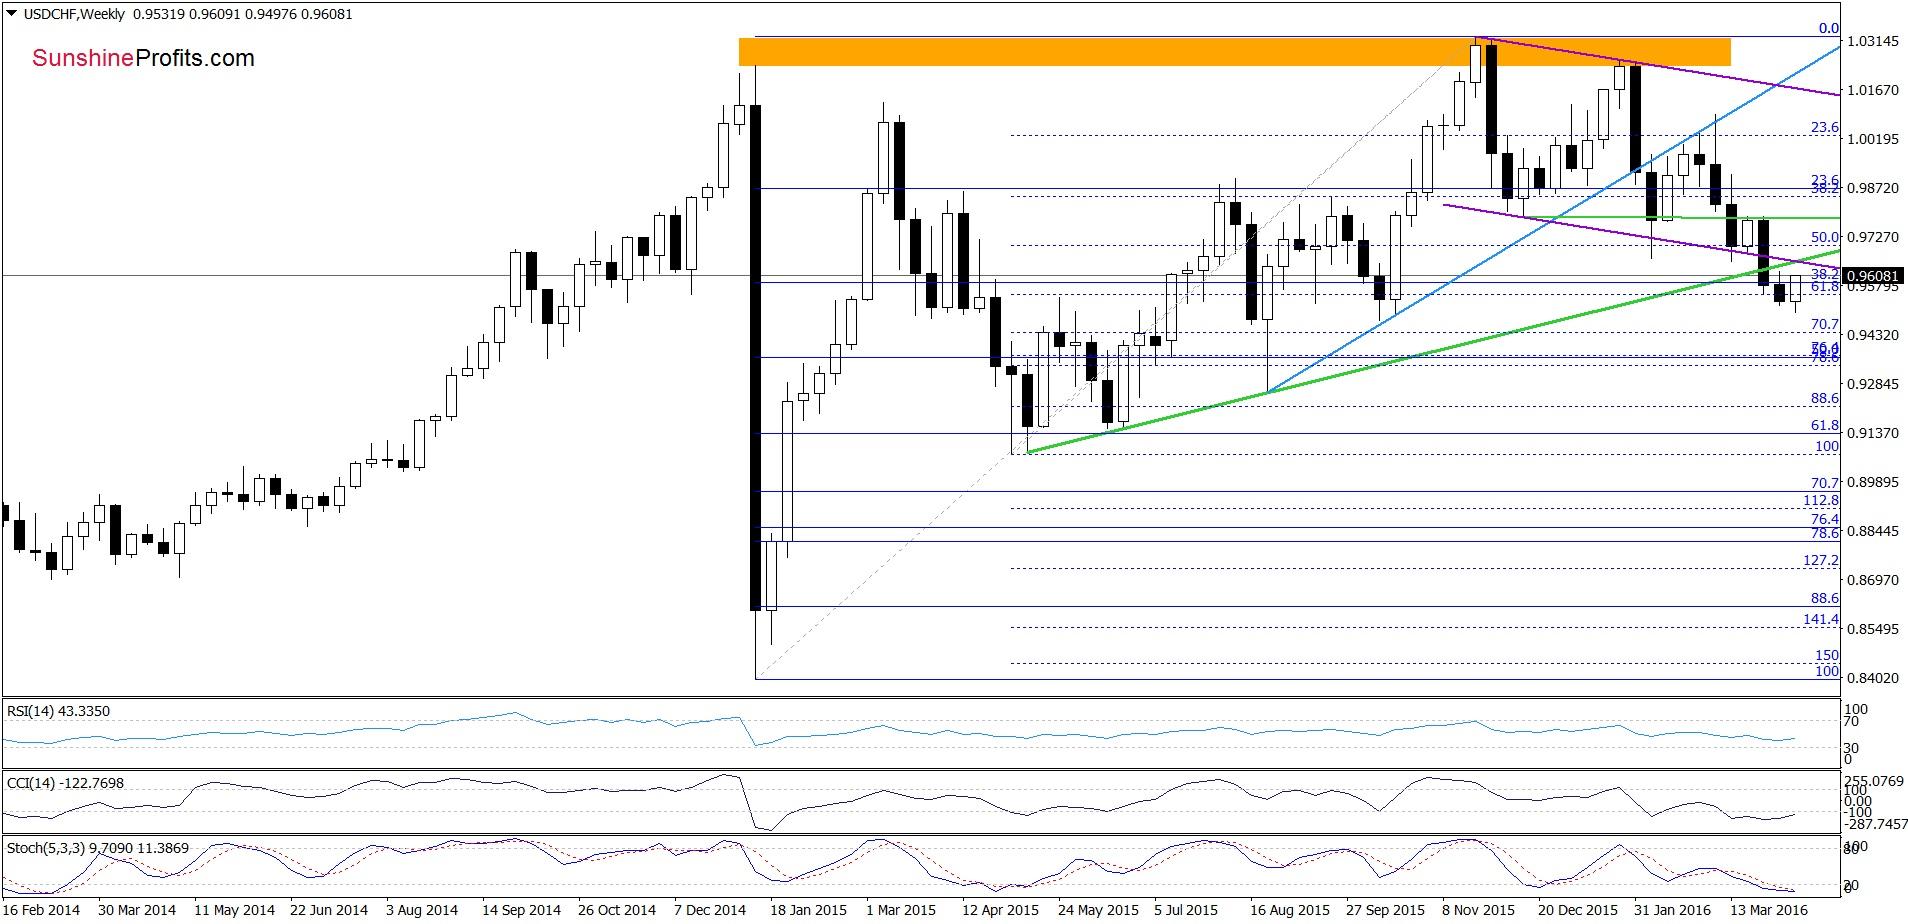
Looking at the above charts, we see that although USD/CHF moved little lower yesterday, the green support zone marked on the daily chart (created by the 76.4% and 78.6% Fibonacci retracement levels based on entire Aug-Nov upward move) encouraged currency bulls to act, which resulted in a rebound. Earlier today, the exchange rate extended gains, which in combination with buy signals generated by the daily indicators suggests a test of the lower border of the brown declining trend channel and the green support/resistance line (marked on the weekly chart) in the coming day(s).
Nevertheless, as long as there won’t be invalidation of the breakdown under these lines further improvement is questionable.
Very short-term outlook: mixed with bullish bias
Short-term outlook: mixed with bullish bias
MT outlook: mixed
LT outlook: mixed
Trading position (short-term; our opinion): No positions are justified from the risk/reward perspective at the moment.
All essays, research and information found above represent analyses and opinions of Przemyslaw Radomski, CFA and Sunshine Profits' employees and associates only. As such, it may prove wrong and be a subject to change without notice. Opinions and analyses were based on data available to authors of respective essays at the time of writing. Although the information provided above is based on careful research and sources that are believed to be accurate, Przemyslaw Radomski, CFA and his associates do not guarantee the accuracy or thoroughness of the data or information reported. The opinions published above are neither an offer nor a recommendation to purchase or sell any securities. Mr. Radomski is not a Registered Securities Advisor. By reading Przemyslaw Radomski's, CFA reports you fully agree that he will not be held responsible or liable for any decisions you make regarding any information provided in these reports. Investing, trading and speculation in any financial markets may involve high risk of loss. Przemyslaw Radomski, CFA, Sunshine Profits' employees and affiliates as well as members of their families may have a short or long position in any securities, including those mentioned in any of the reports or essays, and may make additional purchases and/or sales of those securities without notice.
Recommended Content
Editors’ Picks
Bank of Japan keeps interest rate steady, as expected

The Bank of Japan (BoJ) board members decided to hold the key interest rate steady at 0%, following its April monetary policy review meeting on Friday. The decision came in line with the market expectations.
AUD/USD consolidates gains above 0.6500 after Australian PPI data

AUD/USD is consolidating gains above 0.6500 in Asian trading on Friday. The pair capitalizes on an annual increase in Australian PPI data. Meanwhile, a softer US Dollar and improving market mood also underpin the Aussie ahead of the US PCE inflation data.
Gold price keeps its range around $2,330, awaits US PCE data

Gold price is consolidating Thursday's rebound early Friday. Gold price jumped after US GDP figures for the first quarter of 2024 missed estimates, increasing speculation that the Fed could lower borrowing costs. Focus shifts to US PCE inflation on Friday.
Stripe looks to bring back crypto payments as stablecoin market cap hits all-time high

Stripe announced on Thursday that it would add support for USDC stablecoin, as the stablecoin market exploded in March, according to reports by Cryptocompare.
US economy: Slower growth with stronger inflation

The US Dollar strengthened, and stocks fell after statistical data from the US. The focus was on the preliminary estimate of GDP for the first quarter. Annualised quarterly growth came in at just 1.6%, down from the 2.5% and 3.4% previously forecast.