![]() HY Markets Research Team
HY Markets Research Team
HY Markets
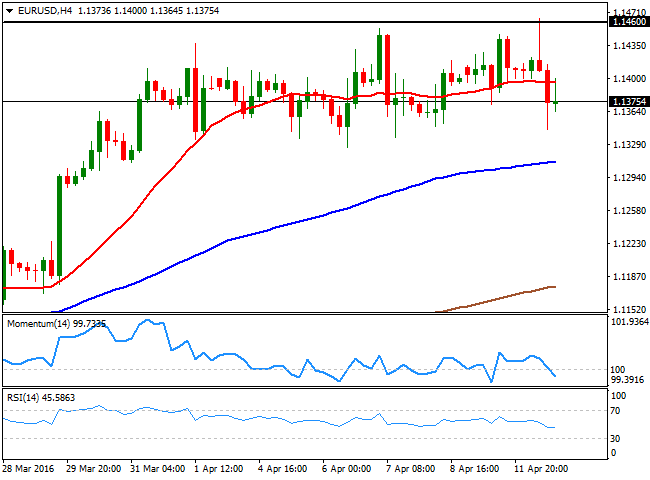
EUR/USD
The American dollar retained the weak tone against most of its major rivals during the Asian session, with most pairs confined to tight ranges in response to a light economic calendar ever since the week started. But things got more interesting during the London session, when the soft opening of local share markets sent the EUR/USD pair up to a fresh year high of 1.1461, and the GBP/USD pair beyond 1.4300, this last on the back of strong local inflation figures. The greenback was buoyed early in the US session, rallying particularly against the EUR and the JPY, both weaker amid improved market's sentiment. On the data front, Germany released its final CPI readings for March, which matched preliminary readings and therefore failed to affect the pair. German inflation rose 0.3% compared to a year before, while monthly basis, it was up by 0.8%. In the US, the March NFIB survey showed that the slowdown continued for small firms, printing 92.6 against previous 92.9 and a 93.9 expected, but FED's hawks underpinned temporarily the USD, by saying that the central bank could raise rates more than twice this year particularly if inflation rises aggressively. The EUR/USD pair bounced from a daily low set at 1.1344, but held below the 1.1400 figure by the end of the day, closing in the red, but within its latest range. Bulls may begin to feel discouraged given that the pair retreated once again from the major resistance level around 1.1460, and result in a steeper downward corrective movement during the upcoming sessions, although the pair needs to extend beyond 1.1330, the base of its latest range, to confirm such decline. From a technical point of view, the 4 hours chart maintains the neutral stance seen on previous updates, as the technical indicators continue hovering around their midlines, while the price is currently a few pips below a flat 20 SMA. Nevertheless, the dominant trend is still bullish as long as the price holds above 1.1245, a strong midterm static support.
Support levels: 1.1330 1.1280 1.1245
Resistance levels: 1.1420 1.1460 1.1500
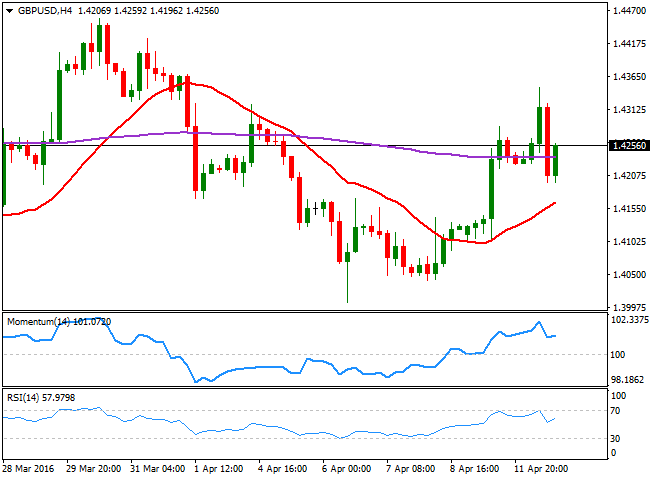
GBP/USD
The GBP/USD pair advanced for third consecutive day, but trimmed most of its intraday gains, as market still sees advances beyond 1.4300 as a chance to sell. The Sterling was underpinned by a positive surprise in the UK March inflation data, which showed that the CPI rose by 0.5% yearonyear and 0.4% compared to the previous month, although the largest increase came in the core inflation number, up by 1.5% yearly basis. Nevertheless, a relentless negative sentiment towards the Pound prevails ahead of the EU referendum, undermining attempts to recover ground. Dollar's shortlived strength sent the pair down to 1.4200, from where it bounced back to the current 1.4250 price zone. The 1 hour chart presents quite a limited upward tone, as the price is currently struggling around its 20 SMA, whilst the technical indicators hover around neutral territory, lacking directional strength. In the 4 hours chart, the price is well above a bullish 20 SMA, currently around 1.4160, whilst the technical indicators are aiming back higher within positive territory, after correcting from near overbought territory, indicating the pair may try once again to regain the 1.4300 level during the upcoming sessions.
Support levels: 1.4240 1.4190 1.4150
Resistance levels: 1.4290 1.4330 1.4370
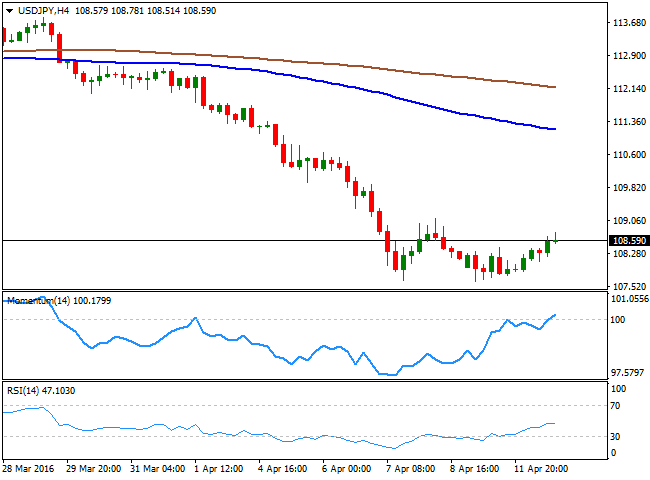
USD/JPY
The USD/JPY pair advanced modestly this Tuesday, reaching a daily high of 108.67 in the US session, as Japanese authorities offered another round of verbal intervention, as FM Aso said that that Japan will take “proper action” if there are extreme onesided FX moves. Also, weighing on the safehaven currency was an improvement in riskrelated sentiment, as Asian and European equities closed higher, whilst Wall Street reversed its Monday losses. The risk of further declines remains dormant, as this daily recovery is far from relevant. Short term, the 1 hour chart shows that the price stands a few pips above a strongly bearish 100 SMA, while the technical indicators are retreating from overbought levels, suggesting limited upward scope at the time being. In the 4 hours chart, however, the pair presents a slightly positive tone, as the Momentum indicator is crossing its 100 level towards the upside, whilst the RSI indicator stands flat around 50, suggesting the pair may advance further, particularly on a recovery above 108.90 the immediate resistance.
Support levels: 108.40 107.95 107.65
Resistance levels: 108.90 109.35 109.80
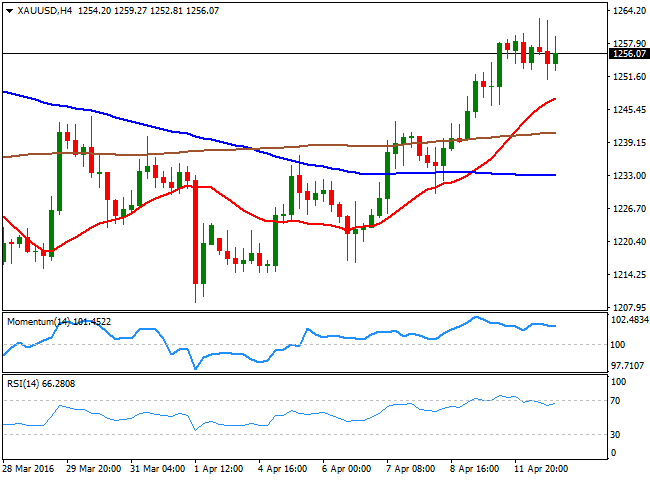
GOLD
Gold prices rallied to fresh 3week highs, with spot reaching $1,262.62 before retreating below its daily opening late in the US session. The bright metal was benefited by a weaker dollar during the first half of the day, but later pulled back amid an improvement in market's mood, as worldwide indexes closed in the green, drifting investors away from the safehaven asset. Nevertheless, the commodity holds on to gains weekly basis, and the daily chart shows that spot managed to post a higher high and a higher low well above its 20 SMA, indicating the risk remains towards the upside. Furthermore, and in the mentioned time frame, the technical indicators remain within bullish territory, although partially losing their upward strength. In the 4 hours chart, the RSI indicator eased from overbought levels, but stands flat around 67, while the Momentum indicator lacks directional strength within positive territory as the price remains well above a bullish 20 SMA, all of which supports additional gains, particularly on a break above the mentioned daily high.
Support levels:1,251.70 1,242.75 1,233.70
Resistance levels: 1,262.60 1,271.80 1,283.50
WTI CRUDE
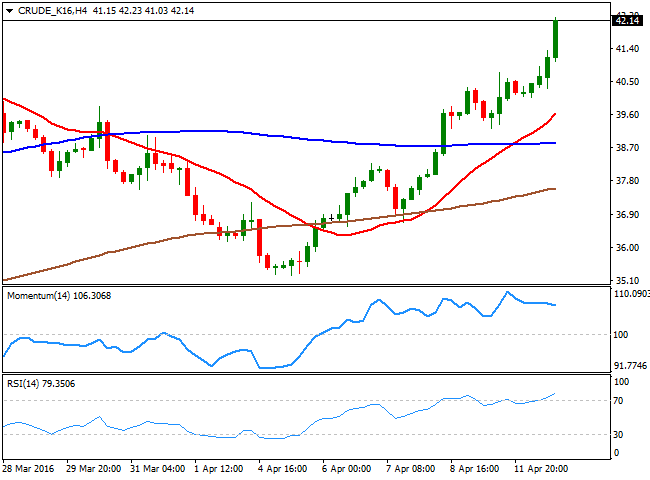
Crude oil prices soared to fresh 2016 highs, boosted by news indicating that Russia and Saudi Arabia have agreed to freeze output ahead of the Doha meeting of oil producers this weekend, adding that the final decision will not depend on Iran. US West Texas Intermediate futures settled at $42.17 a barrel, up 4.5%, a couple of cents below the daily high of 42.23. The daily chart shows that the commodity rallied further beyond its 200 DMA, and holds at levels last seen last November. The technical indicators in the mentioned time frame have rallied further above their midlines, and maintain strong bullish slopes, supporting some further gains towards the 45.00 region. In the shorter term, the 4 hours chart shows that the Momentum indicator has retreated partially from overbought territory, but that the RSI indicator continues heading higher around 79, this last supporting a continued advance. Further supporting the upside in this last time frame, is a strongly bullish 20 SMA that has crossed above the 100 and 200 SMAs well below the current level.
Support levels: 41.80 41.10 40.50
Resistance levels: 42.30 42.90 43.60
DAX
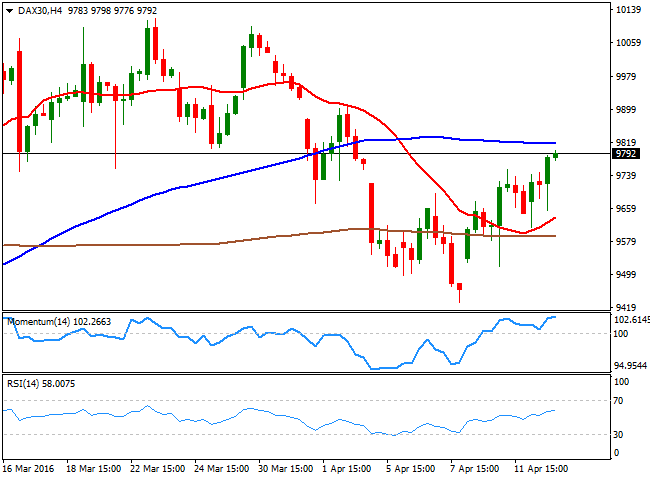
European equities closed higher for third day inarow, underpinned by a strong rally in commodities that lifted the basic resources sector. The German DAX advanced 79 points to end the day at 9,761.47. The release of local inflation figures failed to motivate local investors, as the final revisions matched previous estimates, showing that inflation remains subdued. From a technical point of view, the daily chart shows that indicators have extended further their advances, but remain below their midlines, whilst a horizontal 20 SMA acts as an immediate resistance at 9,844, failing to signal additional gains for this Wednesday. In the 4 hours chart, the technical indicators recovered from their midlines and remain within positive territory, although with a limited upward momentum. In this last time frame, the index continues trading between the 100 SMA, and the 200 SMA, both horizontal, a clear indication of the absence of a clear directional trend.
Support levels: 9,747 9,684 9,614
Resistance levels: 9,844 9,892 9,965
DOW JONES
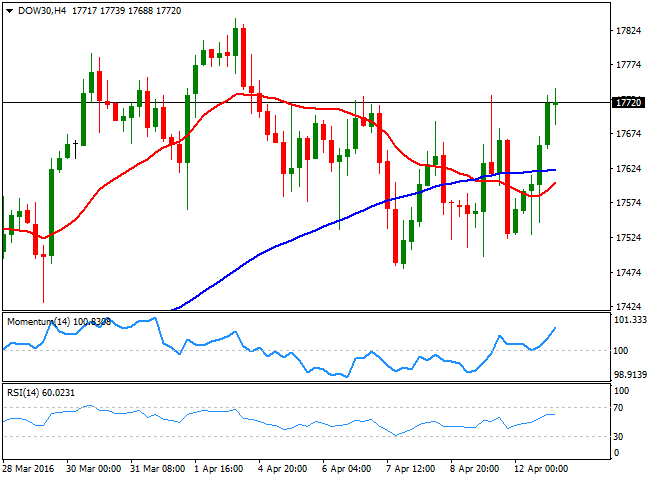
US indexes advanced strongly this Tuesday, with the DJIA adding 164 points to close at 17,721.25, the SandP up by 0.97% to end at 2,061.72 and the Nasdaq advancing 0.80% to 4,872.09. US oil's rally to fresh year highs helped worldwide equities, whilst the hawkish rhetoric from different FED officers failed to spur concerns over a sooner rate hike in the US. The DJIA daily chart shows that the index is back above its 20 SMA, but within its latest range, while the technical indicators have posted tepid bounces from their midlines, not yet enough to confirm additional gains for this Wednesday. In the shorter term, however, the upward tone is clearer, as in the 4 hours chart, the Momentum indicator maintains a strong bullish slope well above its 100 level, whilst the RSI consolidates around 59, as the index stands above its moving averages that anyway continue lacking directional strength.
Support levels: 17,682 17,545 17,479
Resistance levels: 17,739 17,796 17,865
FTSE 100
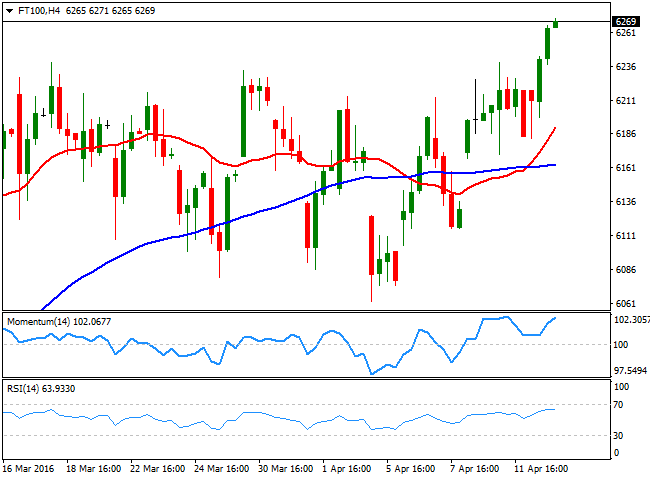
The FTSE 100 advanced 42 points or 0.68% to close the day at 6,242.39, a fresh 2016 high. Advances in commodities' prices lead the advance, with the miningrelated block being the most benefited. Anglo American added over 9.0% after a mining unit from the company reported a third straight month of higher roughdiamond sales, while Rio Tinto surged 2.76% and Randgold added 2.2%. The Footsie holds on to gains ahead of the Asian opening, trading a few points above the mentioned close and with the daily chart showing that the index is above its 200 DMA for the first time since July 2015. Also, indicators have turned higher after a long period of consolidation within neutral territory, lacking enough momentum to confirm an upward continuation. In the 4 hours chart, the index is above a bullish 20 SMA, whilst the technical indicators head higher slightly within positive territory, which at least should keep the downside limited.
Support levels: 6,239 6,160 6,104
Resistance levels: 6,285 6,340 6,390
The information set forth herein was obtained from sources which we believe to be reliable, but its accuracy cannot be guaranteed. It is not intended to be an offer, or the solicitation of any offer, to buy or sell the products or instruments referred herein. Any person placing reliance on this commentary to undertake trading does so entirely at their own risk.
Recommended Content
Editors’ Picks
EUR/USD holds above 1.0700 ahead of key US data

EUR/USD trades in a tight range above 1.0700 in the early European session on Friday. The US Dollar struggles to gather strength ahead of key PCE Price Index data, the Fed's preferred gauge of inflation, and helps the pair hold its ground.
USD/JPY stays above 156.00 after BoJ Governor Ueda's comments

USD/JPY holds above 156.00 after surging above this level with the initial reaction to the Bank of Japan's decision to leave the policy settings unchanged. BoJ Governor said weak Yen was not impacting prices but added that they will watch FX developments closely.
Gold price oscillates in a range as the focus remains glued to the US PCE Price Index

Gold price struggles to attract any meaningful buyers amid the emergence of fresh USD buying. Bets that the Fed will keep rates higher for longer amid sticky inflation help revive the USD demand.
Sei Price Prediction: SEI is in the zone of interest after a 10% leap

Sei price has been in recovery mode for almost ten days now, following a fall of almost 65% beginning in mid-March. While the SEI bulls continue to show strength, the uptrend could prove premature as massive bearish sentiment hovers above the altcoin’s price.
US core PCE inflation set to signal firm price pressures as markets delay Federal Reserve rate cut bets

The core PCE Price Index, which excludes volatile food and energy prices, is seen as the more influential measure of inflation in terms of Fed positioning. The index is forecast to rise 0.3% on a monthly basis in March, matching February’s increase.