EUR/USD
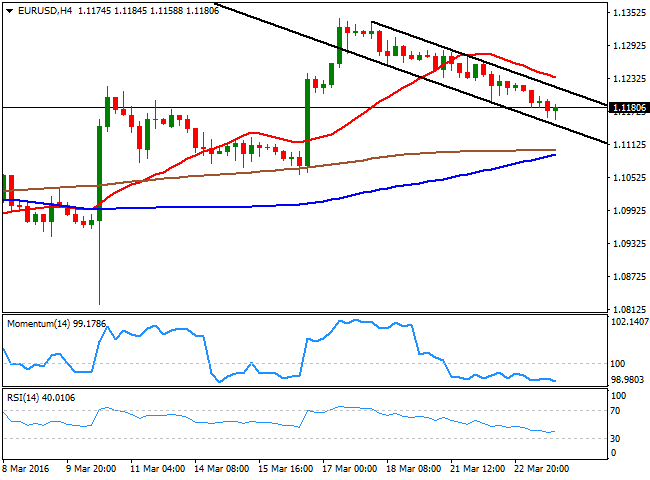
The American dollar stands as the daily winner by the end of the day, having gained against all of its major rivals on the back of improved risk sentiment and a strong slide in commodities' prices. Backing the greenback were a couple more of FED officers, pledging for a soon to come rate hike, with both, Federal Reserve Bank of St. Louis President James Bullard and Chicago FED President Charles Evans, saying that policy makers should consider raising interest rates at least a couple of times this year, inspiring confidence in the US economic situation. In the US, New Home sales rose 2.0% in February to a 512,000 annual pace, while January figures were also revised higher, to 502,000 from previous 494,000. The figures indicate some continued growth in the sector, although sales levels are still 6.1% below a year ago. Crude oil inventories jumped higher, with the EIA report showing a build of 9.37M against the 3.09M expected, pushing crude back towards the $ 40.00 a barrel region.The EUR/USD pair extended its weekly decline down to 1.1158, and trades roughly 20 pips away from the level by the end of the US session, with the greenback higher against all of its major counterparts. The pair has now declined for a fourth consecutive day, having trimmed half its FED's inspired gains, and seems poised to extend its decline, given that short term selling interest is now surging on approaches to the 1.1200 level.
Technically, the 4 hours chart shows that the price remains midway inside a daily descendant channel, while the technical indicators present strong bearish slopes within bearish territory, supporting some additional declines for this Thursday, down to the 1.1085 level.
Support levels: 1.1160 1.1120 1.1085
Resistance levels: 1.1210 1.1245 1.1290
GBP/USD
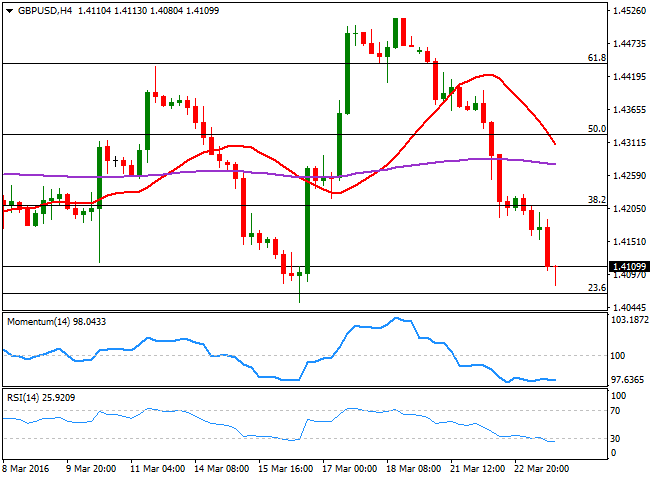
The GBP/USD pair remained under strong selling pressure, hitting a fresh 4day low of 1.4080 during US trading hours. There was no catalyst behind this Wednesday's decline, as the UK did not publish any kind of macroeconomic data. But fears of a Brexit have been lately exacerbated, after a new poll showed the lead of the Remain campaign is slipping. The UK is expected to release its February Retail Sales figures for February during the upcoming session, expected to have fall into negative territory, something that will fuel concerns over the economic future of the kingdom, and further weigh on the Sterling. In the meantime, the short term technical picture shows that the risk remains towards the downside, as in the 1 hour chart, the price develops well below a bearish 20 SMA, while the technical indicators are hovering within oversold levels. In the 4 hours chart, technical readings are getting overstretched, as both the Momentum and the RSI are in extreme oversold territory. The pair has a strong support at 1.4052, March 16th low, and a break below it will likely send the pair below the 1.4000 critical psychological support.
Support levels: 1.4100 1.4050 1.4010
Resistance levels: 1.4160 1.4190 1.4225
USD/JPY
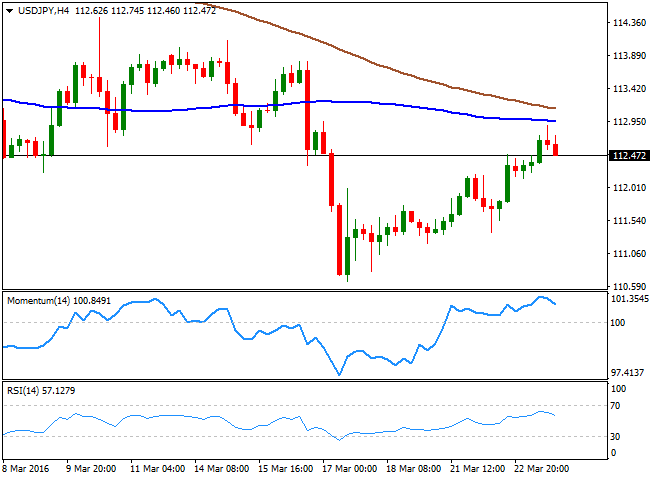
The USD/JPY pair continued rallying over the last session, with the dollar expending its gains up to 112.89, before retreating down to the current 112.47 level. The Japanese currency came under selling pressure during the past Asian session, as the government downgraded the economic assessment, expressing concerns on how the sluggish emerging market demand and volatile financial markets may hurt exports and capital expenditure. Also, the Abe administration has decided to cancel its plan to increase the sales tax from 8% to 10%, scheduled to be implemented in April 2017. The short term technical picture is showing that the early upward strength has lost steam, given that the price is now a few pips below its 200 SMA, whilst the technical indicators have turned south, and are about to cross their midlines towards the downside. In the 4 hours chart, the pair stalled its rally a handful of pips below its 100 SMA, while the technical indicators have also turned lower, but remain well above their midlines, limiting chances of a sharper decline, as long as buyers surge on approaches to the 112.00/10 region.
Support levels: 112.10 111.70 111.30
Resistance levels: 112.95 113.30 113.75
GOLD
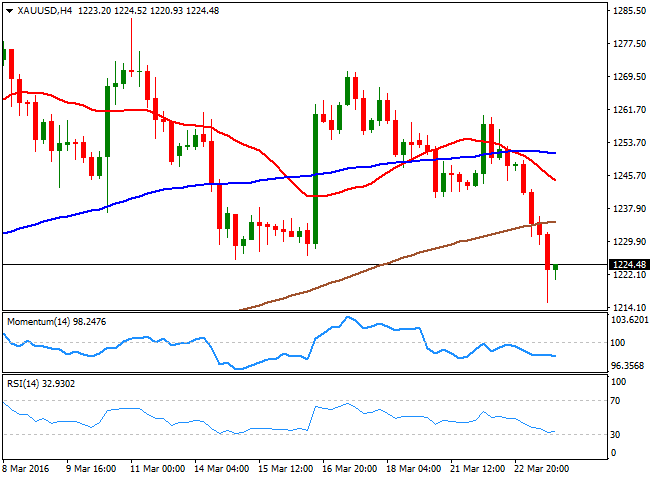
Gold prices plunged to fresh 3week lows this Wednesday, with spot touching a daily low of $1,215.30 before bouncing back to current 1,224.50 region by the end of the US session. The bright metal came under selling pressure at the beginning of the day, as risk sentiment continued to improve and the dollar become, once again, the king. Also, the commodity has been largely correlated with the US Federal Reserve tone, up when the FED was dovish, and down, on looming chances of a rate hike. Given that more FED officers have joined the club of a possible rate hike next April, should not surprise the latest gold decline. After being down over 2.4% intraday, spot is now trading below 1,225.00, a major static resistance, and despite is maybe a bit too early to confirm an interim top, is clear that bullish interest is fading. Technically, the daily chart shows that the technical indicators head sharply lower below their midlines, while the price extended sharply below a now flat 20 SMA. Shorter term, the 4 hours chart also favors a downward continuation, with the price now below its moving averages and the technical indicators near oversold levels, also supporting some further slides for the rest of the week.
Support levels: 1,220.90 1,211,40 1,203.50
Resistance levels: 1,225.50 1,233.40 1,245.60
WTI CRUDE
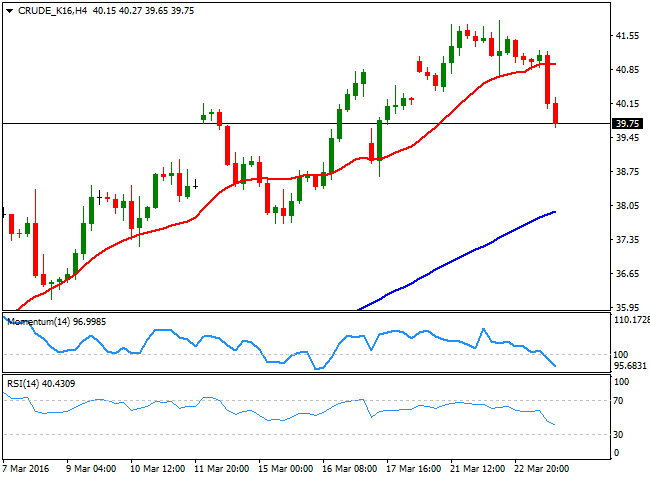
Oil's bulls gave up this Wednesday, after US crude stockpiles reports showed large increases last week. Late Tuesday, the API reported that crude inventories rose by 8.8 million in the week ending March 18th, anticipating what the EIA confirmed today, after reporting that US commercial crude inventories increased by 9.4 million barrels last week, maintaining a total inventory of 532.5 million barrels. The massive storage increase has sent WTI crude oil futures below $40.00 a barrel in the American afternoon, now trading near the lowest of the week established at 39.65. The retreat has sent technical indicators sharply lower in the daily chart, with the Momentum indicator approaching its 100 level, and the price now back below its 200 SMA. The 20 SMA in the same chart, however, maintains its bullish slope and is currently around 38.00, providing a strong support in the case of further declines. In the shorter term, the 4 hours chart the technical indicators have crossed below their midlines and maintain their bearish slopes, as the price extends below its 20 SMA, suggesting the commodity may continue falling, particularly on a break below 39.40, the immediate support.
Support levels: 39.40 38.65 37.90
Resistance levels: 40.40 41.10 41.90
DAX
The German DAX added 33 points to close the day at 10,022.93. Most European equities traded with a strong tone after opening higher, but erased intraday gains ahead of the close, tracking slides in commodities´ prices.
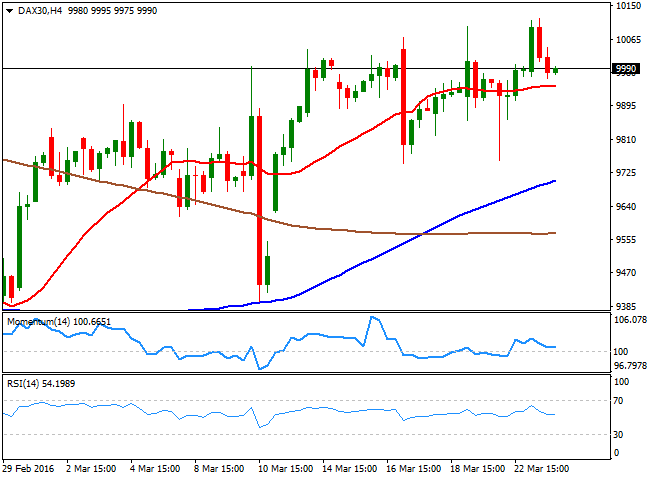
The German benchmark was among the few to close in the green, having rallied up to 10,118 early in the London session. Now back below the key 10,000 level, the index retreated in afterhours trading as oil continued plummeting during the American afternoon. Daily basis, the intraday run stalled a few points below the 100 DMA, today at 10,142, but the general picture is still bullish, as in the daily chart, the technical indicators have lost their previous negative slopes and turned flat within positive territory. In the same chart, the 20 SMA extended its advance below the current levels, and is still the dynamic support to break to start thinking on a possible turn. In the 4 hours chart, the index presents a neutraltobullish tone, given that it stands above its 20 SMA, while the technical indicators are slowly turning higher after approaching their midlines.
Support levels: 9,959 9,891 9,839
Resistance levels: 10,020 10,098 10,142
DOW JONES
Wall Street turned south this Wednesday, with the three major indexes closing in the red. The DJIA fell 0.45% to end at 17,502.59, the Nasdaq lost 1.10% to 4,768.86 whilst the SandP shed 13 points, to close at 2,036.71.
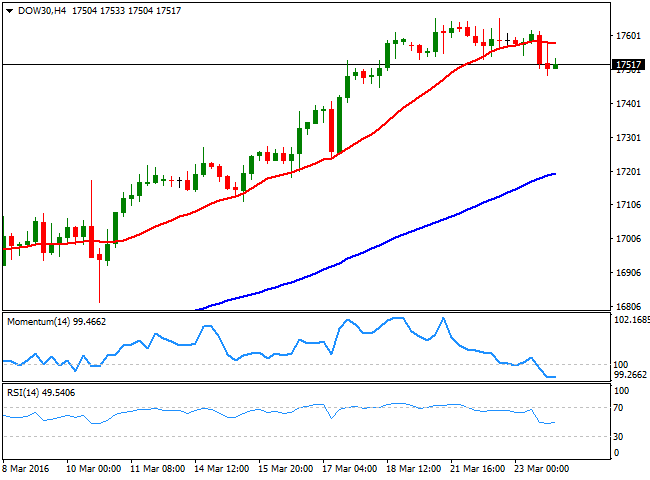
Despite trading was choppy all through the day, as investors struggled to overcome yesterday's riskaverse news, the benchmarks finally close in the red as oil prices plunged on reports of record high stockpiles in the US. The dollar was sharply higher with a firm DXY pushing commodities lower, also weighing on stocks. The Dow is down for second consecutive day, in what seems to be a technical correction after a fiveweek rally. The daily chart shows that the technical indicators are retreating from overbought levels, but also that the index is well above a sharply bullish 20 SMA, all of which is not enough to suggest an interim top has taken place. In the 4 hours chart, the index is a handful of points below a now flat 20 SMA, for the first time since March 10th, while the technical indicators are turning slightly higher within negative territory, suggesting a limited slide is possible for the upcoming sessions. Nevertheless, to confirm a downward continuation, the index next to break below the 17,250 region, a strong static long term support.
Support levels: 17,483 17,395 17,322
Resistance levels: 15,581 17,644 17,728
FTSE 100
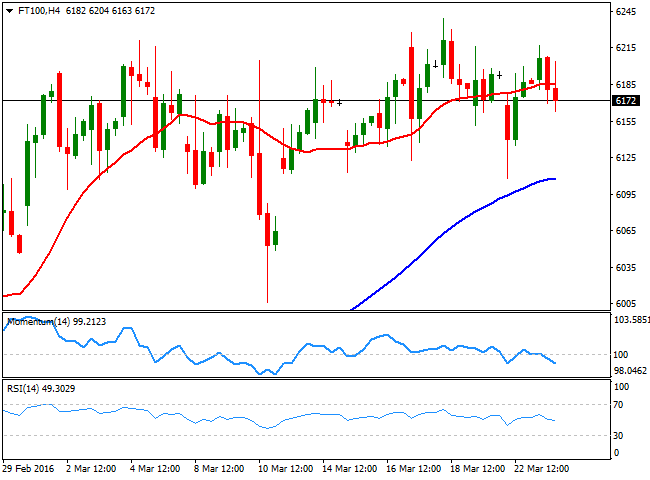
The FTSE 100 closed marginally higher at 6,199.11, adding just 6 points. Oil and mining related shares led the way lowed as commodity prices tumbled, with Anglo American down 5.4%, Glencore closing 3.97% and Tullow Oil shedding 5.8%. But the travel sector recovered from the strong losses posted after the Brussels' terrorist attacks, offsetting losers. The technical picture continues to show no progress, and an extension of the consolidative stage seen for the past two weeks. Daily basis, the index remains above a bullish 20 SMA, but the RSI indicator is now turning lower around 56, whilst the Momentum indicator continues to be attached to its 100 level. In the 4 hours chart, the neutral stance prevails with the index hovering around a flat 20 SMA, currently at 6,184, and the technical indicators turning slightly higher, right below their midlines.
Support levels: 6,112 6,075 6,037
Resistance levels: 6,239 6,268 6,326
The information set forth herein was obtained from sources which we believe to be reliable, but its accuracy cannot be guaranteed. It is not intended to be an offer, or the solicitation of any offer, to buy or sell the products or instruments referred herein. Any person placing reliance on this commentary to undertake trading does so entirely at their own risk.
Recommended Content
Editors’ Picks
USD/JPY holds above 155.50 ahead of BoJ policy announcement

USD/JPY is trading tightly above 155.50, off multi-year highs ahead of the BoJ policy announcement. The Yen draws support from higher Japanese bond yields even as the Tokyo CPI inflation cooled more than expected.
AUD/USD extends gains toward 0.6550 after Australian PPI data

AUD/USD is extending gains toward 0.6550 in Asian trading on Friday. The pair capitalizes on an annual increase in Australian PPI data. Meanwhile, a softer US Dollar and improving market mood also underpin the Aussie ahead of the US PCE inflation data.
Gold price keeps its range around $2,330, awaits US PCE data

Gold price is consolidating Thursday's rebound early Friday. Gold price jumped after US GDP figures for the first quarter of 2024 missed estimates, increasing speculation that the Fed could lower borrowing costs. Focus shifts to US PCE inflation on Friday.
Stripe looks to bring back crypto payments as stablecoin market cap hits all-time high

Stripe announced on Thursday that it would add support for USDC stablecoin, as the stablecoin market exploded in March, according to reports by Cryptocompare.
Bank of Japan expected to keep interest rates on hold after landmark hike

The Bank of Japan is set to leave its short-term rate target unchanged in the range between 0% and 0.1% on Friday, following the conclusion of its two-day monetary policy review meeting for April. The BoJ will announce its decision on Friday at around 3:00 GMT.
