EUR/USD
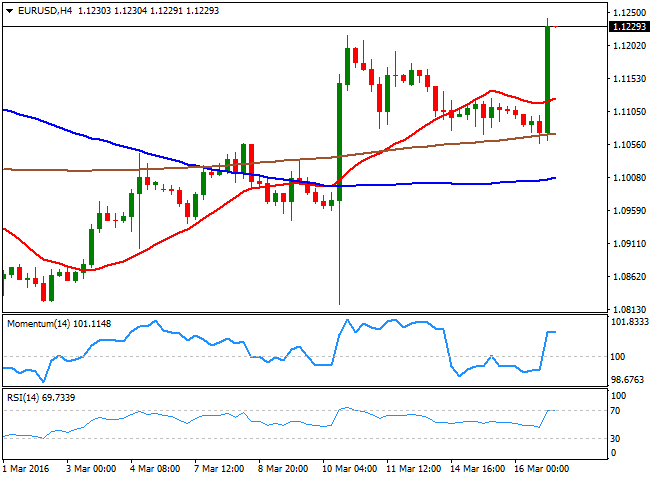
The American dollar maintained its bullish bias during the first half of the day, underpinned by a couple of economic reports early US session that pointed to some steady economic growth in the country. According to official data, Housing starts rose 5.2% in February, beating expectations, although Building Permits slipped 3.1%. Inflation in the same month, fell 0.2% as expected, but core readings surprised towards the upside posting solid gains up to 2.3% compared to a year before. Anyway, the market was all about the US Federal Reserve, and what they offered was not what the market was expecting. Policy makers see now just two rate hikes in 2015 from previous four, while they also cut the GDP forecast for 2016 down to 2.2% from 2.4%. The dollar was soldoff across the board, and the EUR/USD soared beyond 1.1217, the postECB high, with Janet Yellen´s press conference, indicating that major concerns are still abroad, but also that participants don't longer saw the risk balanced, as some saw them tilted towards the downside. The EUR/USD pair retreated from the 1.1226 posted with the news, but holds around the 1.1200 level, with strong bullish implications coming from technical readings, given that the pair has extended its monthly advance to a fresh high, while in the 4 hours chart, the strong advance has sent price well above its moving average, and left indicators heading sharply higher within bullish territory. Given the strong advance in Wall Street, Asian share markets will likely surge, maintaining the common currency supported. A major static resistance level stands around 1.1245, with a break beyond it exposing the pair to an advance towards 1.1300 this Thursday.
Support levels:1.1160 1.1120 1.1065
Resistance levels: 1.1245 1.1290 1.1330
GBP/USD
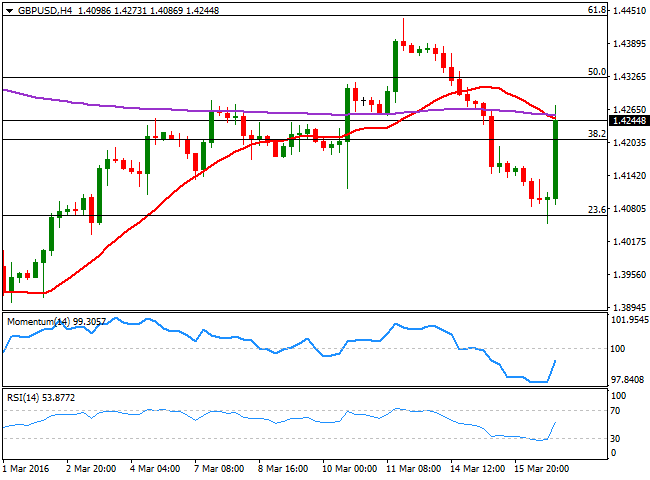
The British Pound weakened further against its major rivals, plummeting to 1.4052 against the greenback ahead of the FOMC meeting. The UK currency was selloff mode last Tuesday as the latest ORB opinion poll showed that 47% wanted to remain within the EU compared to 49% who wanted to leave. The UK employment report resulted soft, with more jobs thanexpected added in the three months to January, the unemployment rate steady at 5.1% and a tepid advance in wages. The data however, was not enough to save the Sterling. But the FED was, and the GBP/USD pair jumped to 1.4273, stalling its advance around the 200 EMA in the 4 hours chart, but holding above 1.4215, the 38.2% retracement of this year´s slide and the immediate support. In the mentioned time frame, the 20 SMA heads south a handful of pips below the mentioned high, while the technical indicators bounced sharply from oversold levels, and are currently crossing their midlines towards the upside, suggesting the recovery may extend, particularly on an upward acceleration beyond the mentioned daily high.
Support levels: 1.4215 1.4170 1.4125
Resistance levels: 1.4275 1.4310 1.4360
USD/JPY
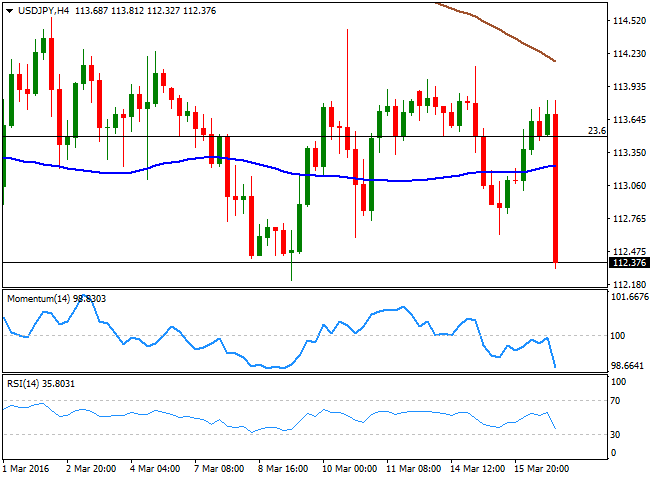
The Japanese yen slid during the Asian session, following dovish comments from BOJ's Governor Kuroda, who said that there are chances that the Central Bank will cut rates further into negative territory if needed, in a speech before the local parliament. The USD/JPY pair recovered up to 113.81, before plummeting to a fresh weekly low, with US treasury yields coming under pressure after the FOMC's announcement. The 2year treasury yield fell to 0.912% from near 0.99%. The pair approaches the base of its latest range in the 112.10 region, and seems poised to extend its decline, given that in the 1 hour chart, the technical indicators head south almost vertically, despite being in extreme oversold territory. In the 4 hours chat, and after a period of consolidation around their midlines, the technical indicators resumed their declines, now heading sharply lower within bearish territory. Former lows around 112.60 are the immediate resistance, yet at this point, only a recovery above 113.00 will take out some of the bearish pressure from the pair.
Support levels: 112.10 111.70 111.30
Resistance levels: 112.60 113.00 113.50
GOLD
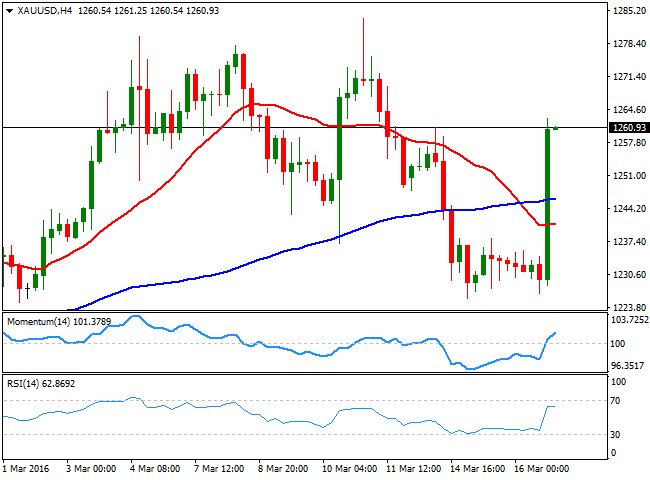
Gold buyers welcome the dovish tone for the FED, and run to buy back the commodity, on diminished chances of a June rate hike. Gold advanced beyond $ 1,260.00 a troy ounce in Comex futures for April delivery, underpinned by the US Central Bank socalled dot plot, indicating policy makers now see only two rate hikes for this year. The commodity erased all of its weekly gains, and seems poised to advance towards fresh highs beyond 1,283.50, the over a year high posted earlier this month. The daily chart supports additional rallies, given that the price has recovered above a bullish 20 SMA, whilst the technical indicators have bounced from their midlines, and present tepid bullish slopes ahead of the Asian opening. In the shorter term, the technical picture is also bullish, as the price also recovered above its 20 and 100 SMAs, with the shortest now losing the bearish slope seen earlier this week, and turning flat around 1,240.90. In this last time frame, the technical indicator have partially lost their bullish slopes, but remain well above their midlines. Some consolidation can be expected during the upcoming hours, but the risk remains towards the upside.
Support levels: 1,252.10 1,240.90 1,233.15
Resistance levels: 1,265.40 1,275.70 1,283.50
WTI CRUDE
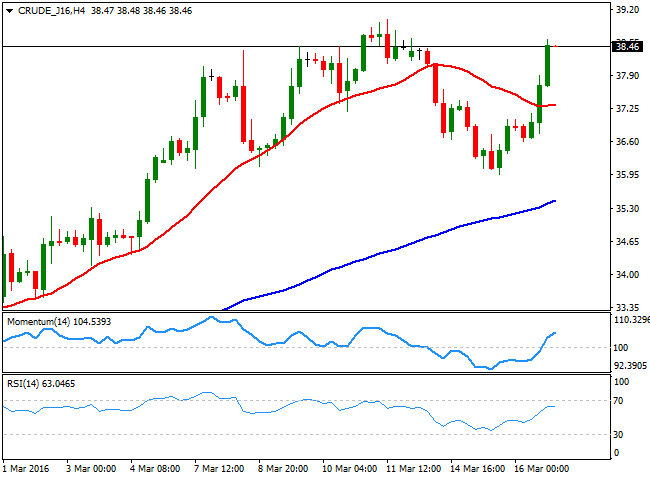
Crude oil prices changed course this Wednesday, with Brent flirting with $40.00 a barrel during the London session, after OPEC and nonOPEC producers agreed on a meeting next April 17th to discuss an output freeze, irrespective of Iran's participation. West Texas Intermediate futures grabbed additional support from US stockpiles reports, given that the EIA informed that crude inventories rose by 1.5 million barrels in the week to March 11th, well below market expectations, whilst the API report released late Tuesday showed that the delivery hub rose by 471K barrels. WTI daily chart shows that the price is steady near a fresh weekly high of $8.60 a barrel, whilst the technical indicators have turned slightly higher well above their midlines, and after correcting overbought readings. In the 4 hours chart, the Momentum indicator heads north above its 100 level, the price recovered above a now flat 20 SMA, and the RSI indicator consolidates around 63, all of which favors another leg higher, towards the critical 40.00 region.
Support levels: 37.80 27.20 36.60
Resistance levels: 38.70 39.40 40.00
DAX
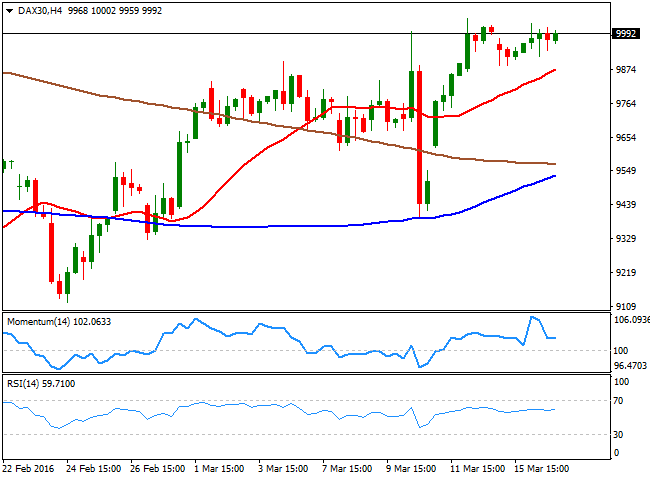
European equities closed mostly higher on Wednesday, with the German DAX adding 0.50% to end at 9,983.41, with mood cautions ahead of the US Federal Reserve decision. Local shares were supported by the construction sector, as seasonally adjusted production rose by 3.6% in January, compared to the previous month. The index continued trading below the 10,000 level in electronic trading, and the daily chart indicates that it's going through a consolidative phase, as the index held within the weekly range and near its highs. The technical picture is little changed, with the 20 SMA heading strongly higher below the current level, but the index still well below the 100 DMA, today around 10,861. The Momentum indicator in the mentioned time frame has turned slightly lower, but the RSI indicator is resuming its advance around 60, all of which supports some further gains. In the 4 hours chart, the Momentum indicator has turned flat above its 100 level after correcting overbought readings, but the RSI indicator maintains a bullish slope while the 20 SMA heads north below the current level, also supporting more gains.
Support levels: 9,956 9,889 9,807
Resistance levels: 10,041 10,112 10,190
DOW JONES
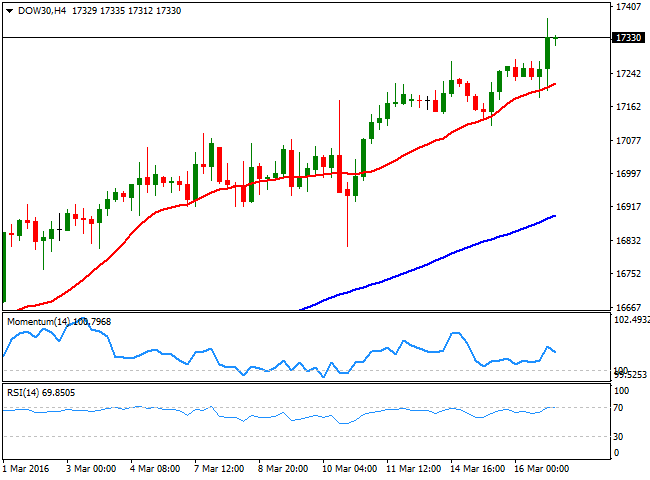
US stocks opened modestly lower on Wednesday, but closed at their highest for this 2016, after the key Federal Reserve policy statement anticipated fewer rate hikes for this year. The DJIA closed at 17,325.76, up by 74 points, while the Nasdaq added 0.75% to end at 4,763.97, while the SandP surged to 2,027. Also underpinning the advance, were higher oil prices that lifted materials and energy stocks. The upward momentum seen on previous DJIA updates has accelerated, and the daily chart shows that the technical indicators keep heading higher, despite being in overbought territory, whilst the 20 SMA has extended is advance above the 100 SMA well below the current level. In the 4 hours chart, the index remains close to the intraday high, established at 17,378 while declines towards a bullish 20 SMA quickly attracted buyers. The technical indicators in this last time frame have lost upward potential, with the RSI flat around 70 and the Momentum still hovering within neutral territory.
Support levels: 17,277 17,205 17,132
Resistance levels: 17,378 17,462 17,531
FTSE 100
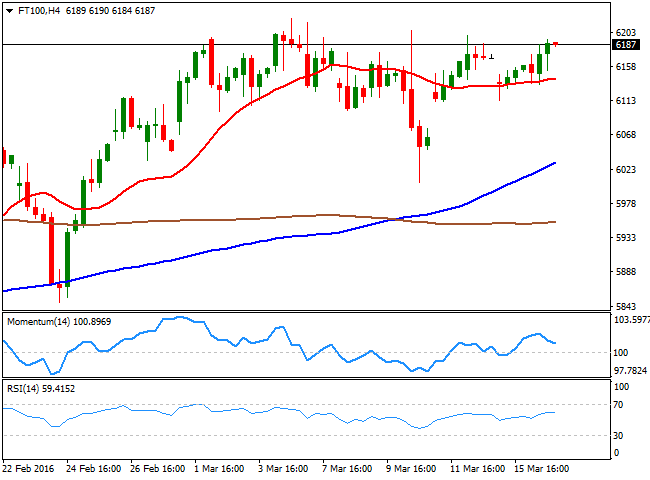
The Footsie gained 0.58% to close the day at 6,175.49, supported by the comeback in oil's prices. The commodity benefited from Treasury chief George Osborne´s comments, as when outlining the 2016 fiscal budget, he announced that the Petroleum Revenue Tax will be “effectively abolished” on North Sea oil fields. Royal Dutch Shell surged by 3.04% while BP added 2.37%, with the energyrelated sector closing generally higher. The daily chart for the FTSE 100 shows that the index posted a tepid advance ahead of the US Central Bank meeting, but anyway held above its 100 DMA as it did ever since the week started. The Momentum indicator in the mentioned time frame has lost upward strength, but remains within bullish territory, while the RSI indicator heads slightly higher, limiting chances of a downward move. In the shorter term, the 4 hours chart presents a neutraltobullish stance, as the index remains above a horizontal 20 SMA, while the technical indicators lack directional strength within positive territory.
Support levels: 6,112 6,075 6,037
Resistance levels: 6,221 6,300 6,346
The information set forth herein was obtained from sources which we believe to be reliable, but its accuracy cannot be guaranteed. It is not intended to be an offer, or the solicitation of any offer, to buy or sell the products or instruments referred herein. Any person placing reliance on this commentary to undertake trading does so entirely at their own risk.
Recommended Content
Editors’ Picks
EUR/USD holds above 1.0700 ahead of key US data

EUR/USD trades in a tight range above 1.0700 in the early European session on Friday. The US Dollar struggles to gather strength ahead of key PCE Price Index data, the Fed's preferred gauge of inflation, and helps the pair hold its ground.
USD/JPY stays above 156.00 after BoJ Governor Ueda's comments

USD/JPY holds above 156.00 after surging above this level with the initial reaction to the Bank of Japan's decision to leave the policy settings unchanged. BoJ Governor said weak Yen was not impacting prices but added that they will watch FX developments closely.
Gold price oscillates in a range as the focus remains glued to the US PCE Price Index

Gold price struggles to attract any meaningful buyers amid the emergence of fresh USD buying. Bets that the Fed will keep rates higher for longer amid sticky inflation help revive the USD demand.
Sei Price Prediction: SEI is in the zone of interest after a 10% leap

Sei price has been in recovery mode for almost ten days now, following a fall of almost 65% beginning in mid-March. While the SEI bulls continue to show strength, the uptrend could prove premature as massive bearish sentiment hovers above the altcoin’s price.
US core PCE inflation set to signal firm price pressures as markets delay Federal Reserve rate cut bets

The core PCE Price Index, which excludes volatile food and energy prices, is seen as the more influential measure of inflation in terms of Fed positioning. The index is forecast to rise 0.3% on a monthly basis in March, matching February’s increase.
