EUR/USD
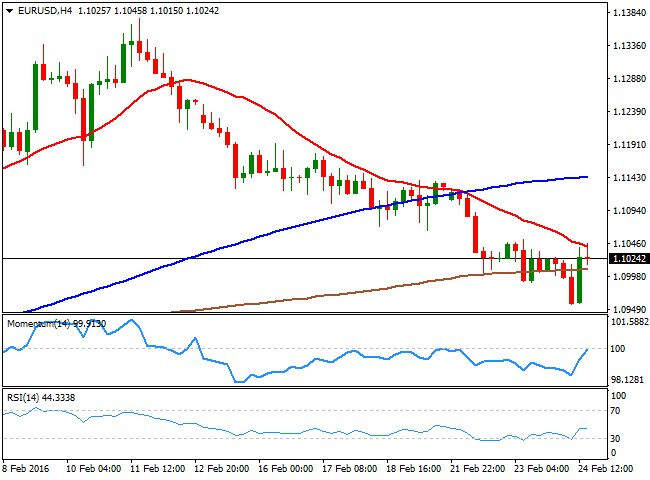
After hitting fresh highs versus the euro and the pound during the European session, the US dollar gave up most of its early gains as it took a hit from disappointing economic data. US Markit services PMI fell to 49.8 in February, below the 53.5 expected. Meanwhile, new home sales dropped by 9.2% in January, much more than the expected fall of 4.4%.EUR/USD bounced from a 3week low of 1.0957 and regained the 1.1000 level, erasing almost completely intraday losses. However, the pair lacked momentum to extend the recovery beyond the 1.1025 zone and settled just below that level. Technically speaking, EUR/USD maintains the shortterm negative perspective, with spot capped below the 20SMA in the 4 hours chart and indicators attempting bounces below their midlines. The negative outlook seems stronger in the daily chart as per indicators heading lower, but it will take a decisive break below 1.0960, Fibonacci 61.8% of 1.0710/1.1376 rise, to confirm bearish resumption of pullback from 1.1376 and expose 2016 lows.
Support levels: 1.0960 1.0900 1.0880
Resistance levels: 1.1050 1.1090 1.1140
GBP/USD
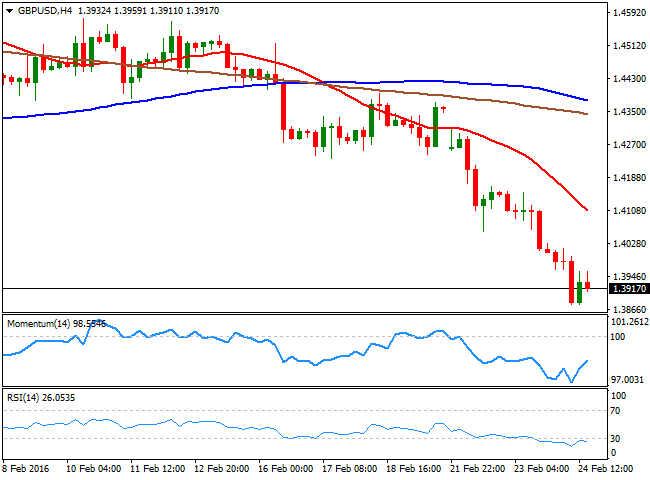
The British pound extended losses into a third consecutive day on Wednesday and scored a fresh 7year low of 1.3877 during the European session amid uncertainty surrounding UK referendum on EU membership and fears of a ‘Brexit’. Even though GBP/USD managed to recover from lows as the greenback weakened during the New York session, the downside remains favored according to shortterm charts. In the 4 hours chart, the pair hovers well below a bearish 20SMA while indicators attempt to recover from lows. However, the RSI remains in oversold territory in 4 hours and daily charts, suggesting the pound might enjoy a phase of consolidation and even stage a mild bounce before resuming the fall. A break below 1.3850 would pave the way toward next target at 1.3652, which is the March 2009 monthly low.
Support levels: 1.3850 1.3800 1.3700
Resistance levels: 1.4000 1.4080 1.4155
USD/JPY
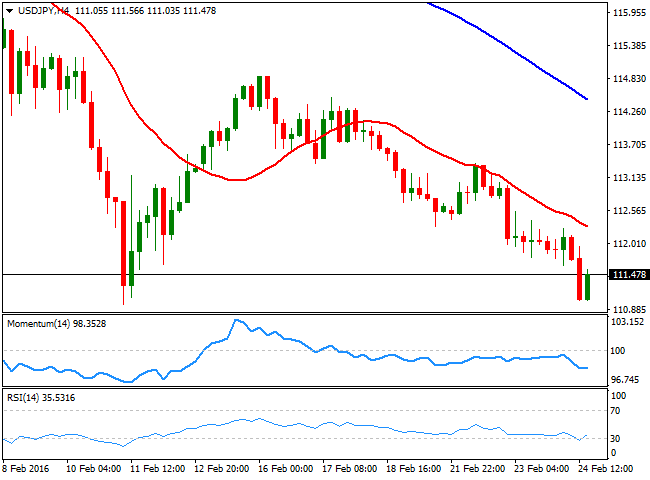
USD/JPY edged lower on Wednesday and hit fresh 2week lows during the American session on the back of disappointing US data, although the decline stalled a few pips ahead the 111.00 level and its 2016 low set at 110.97 earlier this month. A late recovery in US stocks helped USD/JPY to trim daily losses but the upside remained limited with the overall picture still bearish. In the 1 hour chart indicators head higher, reflecting the recent bounce, but hold in negative territory. In the 4 hours charts, indicators hover well below their midlines and the RSI corrects from oversold conditions, while the 20SMA maintains the upside limited around 112.30. It will take a clear break below 111.00 to confirm a steeper decline with the 110.10/00 zone as immediate target. On the other hand, USD/JPYneeds to regain the 113.50 zone to ease the immediate bearish pressure.
Support levels: 110.97 110.10 109.20
Resistance levels: 112.25 113.05 113.50
GOLD
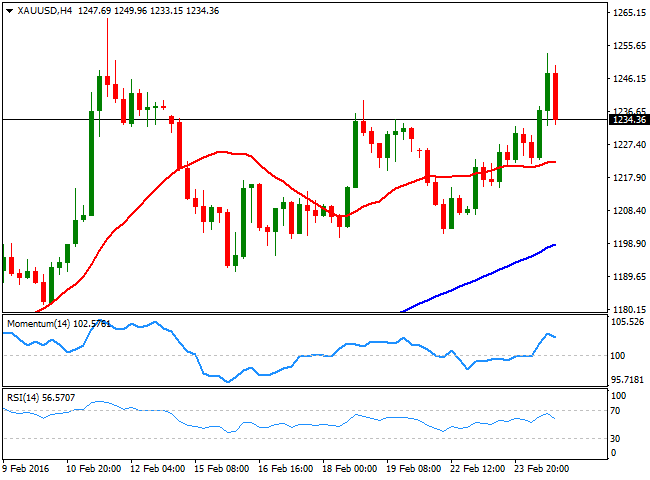
Gold prices rose to a 2week high of $1,253.25 a troy ounce as oilled riskoff in the European equity markets saw investors run for cover under the yellow metal’s protective shadow. However, oil prices turned positive in the late US session following the EIA inventory data, which saw the metal trim gains and end the day around $1,235/oz, up 1% on the day. Metal traders would continue to track oil prices ahead of the US durable goods orders release on Thursday. From the technical viewpoint, the metal could head lower if prices breach 20SMA in the 4 hours chart. The daily RSI is falling from the overbought region, which adds credence to the possibility of a bearish move. However, the metal could be bought on dips, given the bullish RSI in the 4 hours charts and prices sitting well above the rising 20SMA in the daily chart.
Support levels: 1,222 1,215 1,198
Resistance levels: 1,240 1,254 1,263
WTI CRUDE
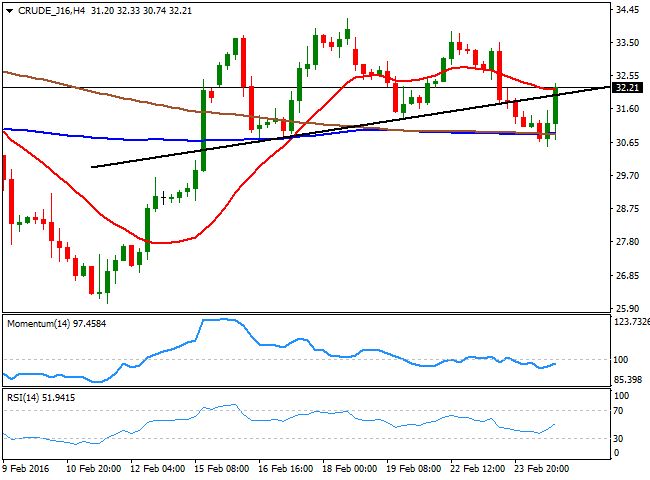
Oil prices at both the sides of the Atlantic were down by almost 2% before the two benchmarks staged a remarkable recovery during the US session. WTI oil futures recovered from the low of $30.53 a barrel to trade settle 1% higher around $32.20 a barrel after the US Government data showed gasoline demand trumped stockpile build. However, the positive turn could run out of steam on OPEC's stubbornness in not cutting output. From technical perspective, the scope for downside in oil remains intact after prices breached triple top formation seen in the 4 hours chart and the Momentum and the RSI indicators remain in favour of bearish move. However, doors could be opened for an upside move if prices rise above 20SMA in the 4 hours chart, pulling the daily RSI higher into the bullish territory
Support levels: 31.33 30.88 30.00
Resistance levels: 32.97 33.82 34.19
DAX
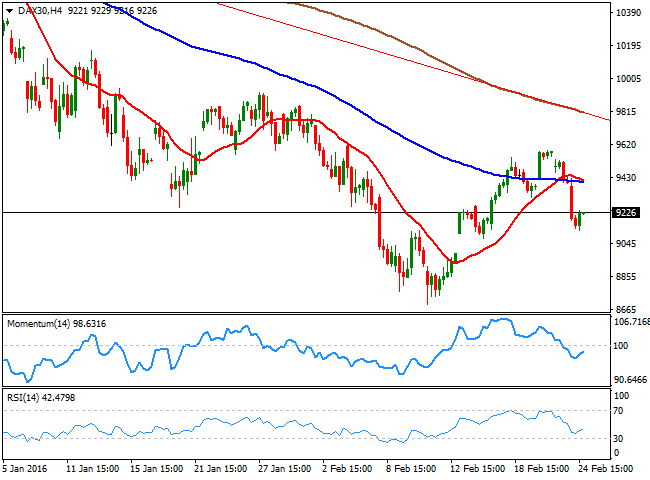
The German DAX plunged 248.97 points or 2.64% on Wednesday to 9,167.80 and pushed the panEuropean Euro Stoxx 600 index lower by more than 2%. Investors’ concerns regarding Deutsche Bank AG’s creditworthiness weighed over the banking shares. Deutsche Bank shares fell 3.79% and also dragged Commerzbank lower by 3.69%. Volkswagen shares plunged 4.8% after ClassAction suit was filed against Volkswagen in US court. Fresenius SE climbed 3.4% after the healthcare provider forecasted that profit and sales will increase this year. From the technical perspective, the index appears poised to extend losses after having closed below the support of 9,256. In the 4 hours chart, the RSI at 42 also remains in favour of a downside move. The scope for upside looks limited as the 20SMA at 9,322 in the daily chart is falling and the index has closed below the same on Wednesday. Overall, doors remain open for further downside unless the index climbs back above 20SMA in the daily chart and the RSI breaks above 50.00.
Support levels: 9,074 8,990 8,769
Resistance levels: 9,319 9,425 9,500
DOW JONES
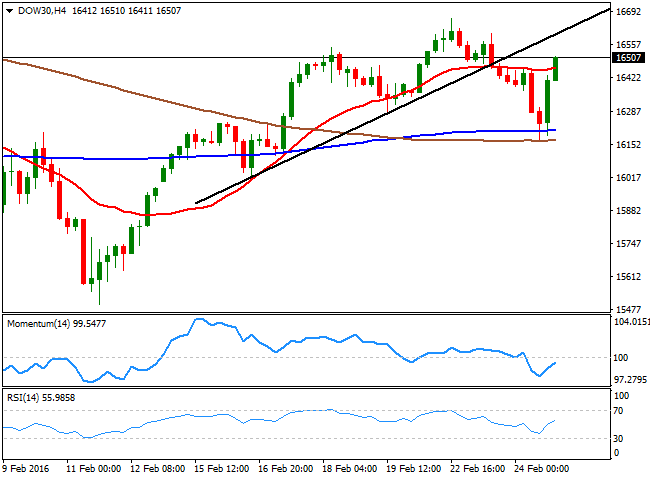
The stocks markets in the US ended on a positive note on Wednesday after oil prices rebounded. The DJIA index closed 53.35 points or 0.32% higher at 16,485.13. The SandP 500 index added 0.54% and the tech heavy Nasdaq gained 0.90%. Oil prices remained the dominant driver of market action with crude prices advancing following the EIA inventory report, which came in below the API estimate. This helped stocks to erase early losses to close higher. The domestic data was weak, with services PMI dropping to its lowest level in over 2 years. Shares in United Technologies rallied 2%, while those in airliner Boeing fell 2.33%. From the technical viewpoint, the tables might have turned in favor of bulls as prices closed above the 20SMA in the 4 hours chart. The hourly RSI is back above 50.00 as well and pointing higher. The daily chart shows a strong rebound from 20SMA support. Overall, the index could be bought on dips and appears poised for a bullish move unless it moves back below 20SMA in the daily chart.
Support levels: 16,363 16,277 16,217
Resistance levels: 16,605 16,665 17,006
FTSE 100
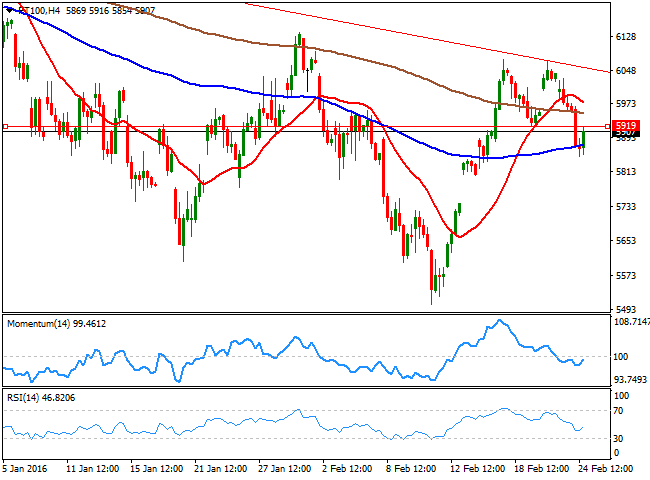
The UK’s FTSE index retreated 95.13 points or 1.60% on Wednesday to 5867.18. FTSE and other European top markets have started feeling the weight of Britain's upcoming inout vote. Furthermore, oil prices were down in Europe and consequently, commodities and energy stocks led the decline. Glencore shares plunged 10%, followed by a 9.5% loss in Anglo American shares. Standard Chartered shares extended Tuesday’s loss by 4.39% after missing fullyear profit and revenue expectations. Investors would take cues from the Q4 UK GDP data on Thursday while oil prices would remain at the center stage of the financial markets. From the technical viewpoint, downside remains exposed after prices breached double top formation support in the 4 hours chart at 5,922. In the same timeframe, the RSI and the Momentum indicator remain in favor of further downside as well. Furthermore, the daily indicators are threatening to dip into bearish territory. Overall, the upside potential appears limited around the falling trendline resistance.
Support levels: 5,850 5,805 5,740
Resistance levels: 5,950 6,034 6,058
The information set forth herein was obtained from sources which we believe to be reliable, but its accuracy cannot be guaranteed. It is not intended to be an offer, or the solicitation of any offer, to buy or sell the products or instruments referred herein. Any person placing reliance on this commentary to undertake trading does so entirely at their own risk.
Recommended Content
Editors’ Picks
EUR/USD holds above 1.0700 ahead of key US data

EUR/USD trades in a tight range above 1.0700 in the early European session on Friday. The US Dollar struggles to gather strength ahead of key PCE Price Index data, the Fed's preferred gauge of inflation, and helps the pair hold its ground.
USD/JPY stays above 156.00 after BoJ Governor Ueda's comments

USD/JPY holds above 156.00 after surging above this level with the initial reaction to the Bank of Japan's decision to leave the policy settings unchanged. BoJ Governor said weak Yen was not impacting prices but added that they will watch FX developments closely.
Gold price oscillates in a range as the focus remains glued to the US PCE Price Index

Gold price struggles to attract any meaningful buyers amid the emergence of fresh USD buying. Bets that the Fed will keep rates higher for longer amid sticky inflation help revive the USD demand.
Sei Price Prediction: SEI is in the zone of interest after a 10% leap

Sei price has been in recovery mode for almost ten days now, following a fall of almost 65% beginning in mid-March. While the SEI bulls continue to show strength, the uptrend could prove premature as massive bearish sentiment hovers above the altcoin’s price.
US core PCE inflation set to signal firm price pressures as markets delay Federal Reserve rate cut bets

The core PCE Price Index, which excludes volatile food and energy prices, is seen as the more influential measure of inflation in terms of Fed positioning. The index is forecast to rise 0.3% on a monthly basis in March, matching February’s increase.
