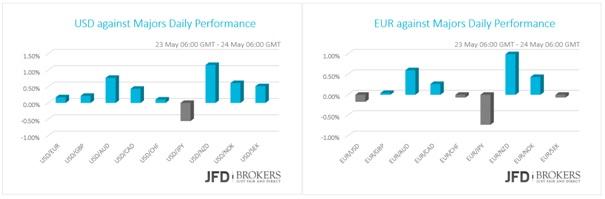
The week started with thin trading volumes as the USD remained flat for a second consecutive day against the common currency while the pound finished the day pretty much unchanged, returning to the same levels where it opened the session despite the new poll that showed that the "leave" vote is slightly ahead of the "remain" vote.The Japanese yen, on the other hand, recovered some of its previous lost ground against the U.S. dollar after a weekend G7 meeting of central bankers and finance ministers concluded with the U.S. warning Japan against intervening to weaken the yen.
Commodity currencies such as the Canadian and Australian dollars were on the back foot, weighed down by a continuing decline in commodities such as crude oil.
Eurozone’s Services and Manufacturing sectors Slowed Down
The euro has been in a choppy session on Monday following the mixed Markit PMIs. The survey revealed that the services and the manufacturing sectors of the Eurozone as a whole expanded less than expected in May. The services sector remained stable at 53.1 below analysts’ forecast of 53.3 while the manufacturing sector expanded just to 51.5 lower than forecasts of 51.9 and last month’s figure of 51.7. In Germany and France, the two sectors advanced more than anticipated and at a better pace than the previous month.
EUR/USD – Technical Outlook
The hawkish tone of the FOMC minutes kept the U.S. dollar running the previous week with the EUR/USD pair closing positive for a third consecutive week. However, the dollar retreated at the end of the week giving away some of the gains posted over the previous one, with the single currency finding some buyers around the 1.1180 region. The last few days, the EUR/USD pair has been in a range, roughly around 1.1200, leaving the outlook unchanged.
For the medium term, the pair has been trading within a well strong upward channel during the past 6 months, however, looking at the daily chart, the pair is under correction within that channel, if we consider the failed attempt above the 1.1615 level. Therefore, the overall dominant bearish correction leg that has led the pair since early May remains in place, but it seems to be slowly losing pace. The MACD lies above its trigger line confirming the recent pullback while RSI indicates oversold conditions, thus, a pullback upon the indicator’s exit, above 50, of the extreme areas should not be ruled out. With the above in mind, on the upside, resistance will be seen at the 1.1280 – 1.1300 zone and at 1.1360. Beyond here looks unlikely this week, but further gains would see a return to the 1.1400 area. On the downside, minor support will be seen at 1.1180 and then at the ascending trend line at 1.1150.
UK is one month before EU referendum
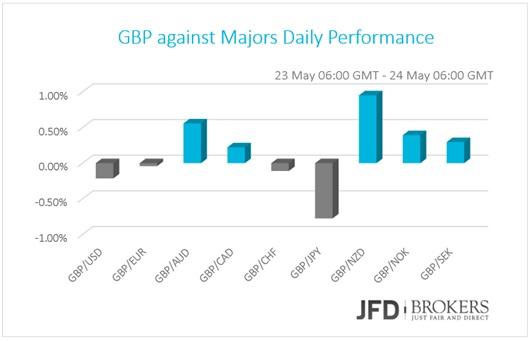
The pound has been pretty much unchanged against most of the G10 currencies as there are not heavyweight numbers to affect the currency. The country entered the last month before the EU Referendum on 23rd of June and the headlines are floated with the policymakers’ opinions.
GBP/USD – Technical Outlook
The pound has been under pressure once more against the dollar, following a new poll that showed that the "leave" vote is slightly ahead of the "remain" vote. Following the failed attempt above the significant resistance level at 1.4650, the pair plunged below the 1.4515 – 1.4530 zone, and has been there for the last couple of days, however, it managed to close the week up 0.98%.
The medium term technical picture remains bullish, as in the daily chart the price remains well above its 50-SMA whilst the technical indicators turned higher within a positive territory. Moreover, the pair is trading within an upward sloping channel since early March, however, the bulls seem to struggle near 1.4650 and 1.4770, where the 200-SMA in two cases has provided a strong resistance to the bulls, preventing any moves above it.
Going forward, on the 4-hour chart, GBP/USD is neutral-to-bullish, as the technical indicators hold above their mid-lines, but lack directional strength. The 50-SMA and the 200-SMA are ready to provide a significant support and resistance to the price action near 1.4000 and 1.4500, respectively. With the above in mind, the next level to watch will be the 38.2% Fibonacci level, near 1.4650 but we would expect a test at 1.4400 and maybe to 1.4300 before turning north again. Beyond there would want to take a look at 1.4770, however, it will need a lot of efforts from the bulls to break above there, at least for now.
USD/JPY – Technical Outlook
The USD/JPY pair surged above the key resistance level and met our suggested target at 110.70, however, it failed to sustain its gains and fell back below the aforementioned level. Following the strong rebound from the 200-SMA on the weekly chart, near 104.80, the pair rose for a three straight weeks and this can be translated as a technical correction of the bearish trend, which started back in October 2015. Now trading a few pips below the daily 50-SMA, the pair’s 4-hour chart shows that downward pressure persists, as the technical indicators have resumed their declines after a tepid correction of oversold readings. Therefore, the next level to watch to the downside will be the 108.80 barrier. Alternatively, if we see a break higher, the pair should find resistance around 109.30, 109.90 and then at 110.70.
USD/CAD – Technical Outlook
The Canadian dollar continues to depreciate against the U.S. dollar after the U.S. Federal Reserve published the minutes from its April Federal Open Market Committee meeting on Wednesday. The pair surged more than 4% since the start of this month and is on track to snap its first positive month following a three-month streak of losses.
Technically, the U.S. dollar maintains its bullish tone and I would expect a further buying pressure in the coming days. The BoC will announce its interest rate statement on Wednesday and there are no changes expected, however, I would expect this event to create some swings to the USD/CAD pair.
Going forward, a further upside potential seems to be the path of least support for the pair and as we said last week there is now very little support until 1.3300. However, through the way there, the bulls will need to take out the 1.3220, which is a minor resistance and then the 1.3280 level, which coincides with the 38.2% Fibonacci retracement level. On the downside, support will be seen first at the significant support level at 1.3000, a break of which would allow a run back to 1.2970. Below this, it seems unlikely this week as I consider the 1.2970 – 1.3000 a strong support area since it coincides the 23.6% Fibonacci level and the 50-SMA. All in all, we remain USD-positive.
AUD/USD – Technical Outlook
The AUD/USD pair is looking much more bearish now following the rally which started after the failed attempt above the significant level at 0.7700. In addition, the bulls failed also to break above the 0.7250 few days ago which adds to the bearish picture of the pair. As mentioned in previous reports, the daily chart was always looking bearish following the bounce off the 0.7830. Last week’s rally confirmed the bearish bias in the markets after it pushed the pair through the 0.7300 region.
With the above in mind, if we do head lower, expect a test of the Wednesday low at 0.7176. Below there would open the way towards the psychological level at 0.7100. It is very significant that the 50-SMA and the 200-SMA on the 4-hour, daily and weekly charts are moving above the price adding to the bearish picture of the AUD/USD.
Brent Crude Oil – Technical Outlook
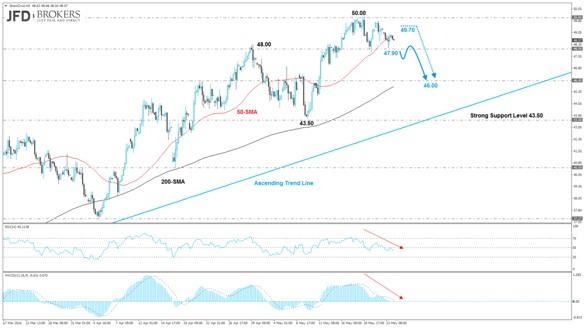
UK Brent Crude oil plunged for a third straight session following the test of the suggested target at $50.00. UK Brent had declined 15 cents to $48.25 a barrel during the NY session after closing down 35 cents in the previous session. The American Petroleum Institute is due to release inventory data today while the U.S. Department of Energy's Energy Information Administration (EIA) will release a report on oil stocks change.
Technically, following the aggressive rally which started from February 2016, we would expect both of the commodities to give back some if the gains made the last few months. Therefore, in both cases, we should watch for a pullback towards the ascending trend lines, for WTI around $45.00 and for Brent around $46.00.
What to watch today
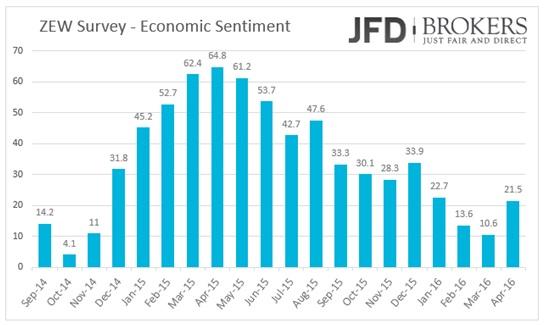
On Tuesday morning, German GDP is predicted to reveal a weak but stable economic growth in the first quarter at 0.7% qoq and 1.3% yoy. ECB’s board member Peter Praet will have a press conference and half an hour later the traders will eye the ZEW Survey for May. In Euro area, the economic sentiment is predicted to have risen to 23.4 from 21.5 before and in Germany to 12.0 from 11.2 the previous month. The German ZEW current conditions are also forecasted to have improved to 48.7 from 47.7 before.
Later in the day, a Eurogroup meeting will take place. Going to U.S., the new home sales change in April and the Richmond Fed manufacturing index are coming out. The two indicators are not expected to trigger much volatility in the market, except if we see a big difference from the market expectations. In New Zealand, the trade balance, the exports and imports for April will be released.
The content we produce does not constitute investment advice or investment recommendation (should not be considered as such) and does not in any way constitute an invitation to acquire any financial instrument or product. JFD Group, its affiliates, agents, directors, officers or employees are not liable for any damages that may be caused by individual comments or statements by JFD Group analysts and assumes no liability with respect to the completeness and correctness of the content presented. The investor is solely responsible for the risk of his investment decisions. Accordingly, you should seek, if you consider appropriate, relevant independent professional advice on the investment considered. The analyses and comments presented do not include any consideration of your personal investment objectives, financial circumstances or needs. The content has not been prepared in accordance with the legal requirements for financial analyses and must therefore be viewed by the reader as marketing information. JFD Group prohibits the duplication or publication without explicit approval.
72,99% of the retail investor accounts lose money when trading CFDs with this provider. You should consider whether you can afford to take the high risk of losing your money. Please read the full Risk Disclosure: https://www.jfdbank.com/en/legal/risk-disclosure
Recommended Content
Editors’ Picks
EUR/USD holds above 1.0700 ahead of key US data

EUR/USD trades in a tight range above 1.0700 in the early European session on Friday. The US Dollar struggles to gather strength ahead of key PCE Price Index data, the Fed's preferred gauge of inflation, and helps the pair hold its ground.
USD/JPY stays above 156.00 after BoJ Governor Ueda's comments

USD/JPY holds above 156.00 after surging above this level with the initial reaction to the Bank of Japan's decision to leave the policy settings unchanged. BoJ Governor said weak Yen was not impacting prices but added that they will watch FX developments closely.
Gold price oscillates in a range as the focus remains glued to the US PCE Price Index

Gold price struggles to attract any meaningful buyers amid the emergence of fresh USD buying. Bets that the Fed will keep rates higher for longer amid sticky inflation help revive the USD demand.
Sei Price Prediction: SEI is in the zone of interest after a 10% leap

Sei price has been in recovery mode for almost ten days now, following a fall of almost 65% beginning in mid-March. While the SEI bulls continue to show strength, the uptrend could prove premature as massive bearish sentiment hovers above the altcoin’s price.
US core PCE inflation set to signal firm price pressures as markets delay Federal Reserve rate cut bets

The core PCE Price Index, which excludes volatile food and energy prices, is seen as the more influential measure of inflation in terms of Fed positioning. The index is forecast to rise 0.3% on a monthly basis in March, matching February’s increase.