EUR/USD Current price: 1.2989
View Live Chart for the EUR/USD
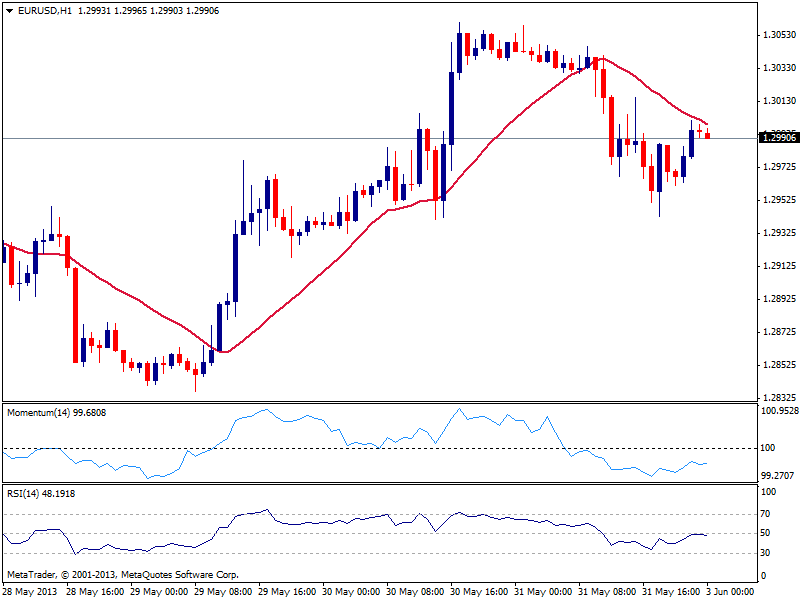
The EUR/USD starts the week where it left past Friday, right below 1.3000 level. With low volatility around, and several first line fundamental data to be released this week, investors will likely remain cautious, and no fireworks should be expected this Monday. As per the technical outlook, the hourly chart shows price being capped by a bearish 20 SMA, while indicators turn lower below their midlines, signaling some bearish interest around. In the 4 hours chart the upward momentum eased with indicators now nearing their midlines although still in positive territory, and price standing above 20 SMA, offering short term support around 1.2960. Expect losses below this last to see price approaching 1.2920, while the upside will likely remain limited by 1.3060 past week high.
Support levels: 1.2960 1.2920 1.2880
Resistance levels: 1.3020 1.3060 1.3100
EUR/JPY Current price: 130.55
View Live Chart for the EUR/JPY (select the currency)
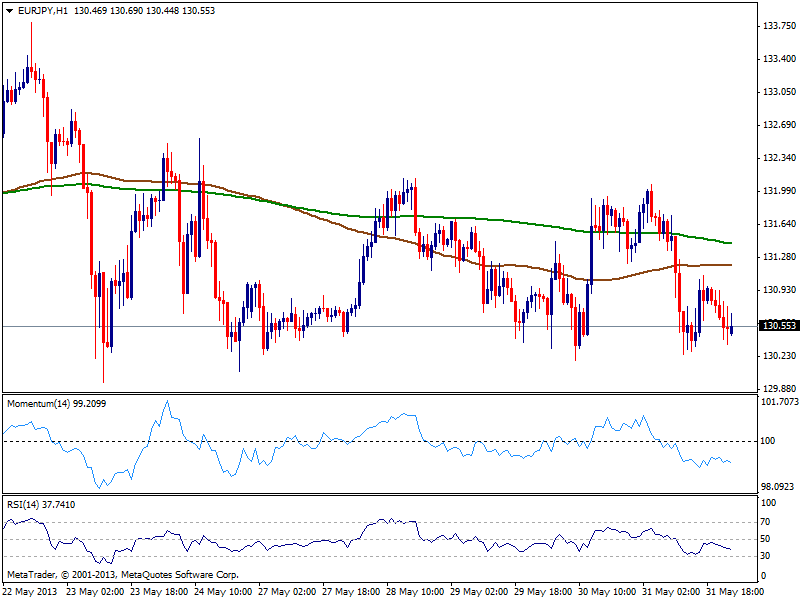
Back to hover right above 130.00, the EUR/JPY eased back below its 100 and 200 SMA’s in the hourly chart, with indicators gaining bearish potential and supporting further yen gains for this week. Maybe a bit too early to call for a bearish run, as buyers had been surging in the 129.90/130.00 area, a break below this last is what it takes to see further slides, with 128.80 as main bearish target. Approaches to 132.00 area will likely be seen as selling opportunities.
Support levels: 130.20 129.80 129.20
Resistance levels: 131.00 131.50 132.10
GBP/USD Current price: 1.5198
View Live Chart for the GBP/USD (select the currency)
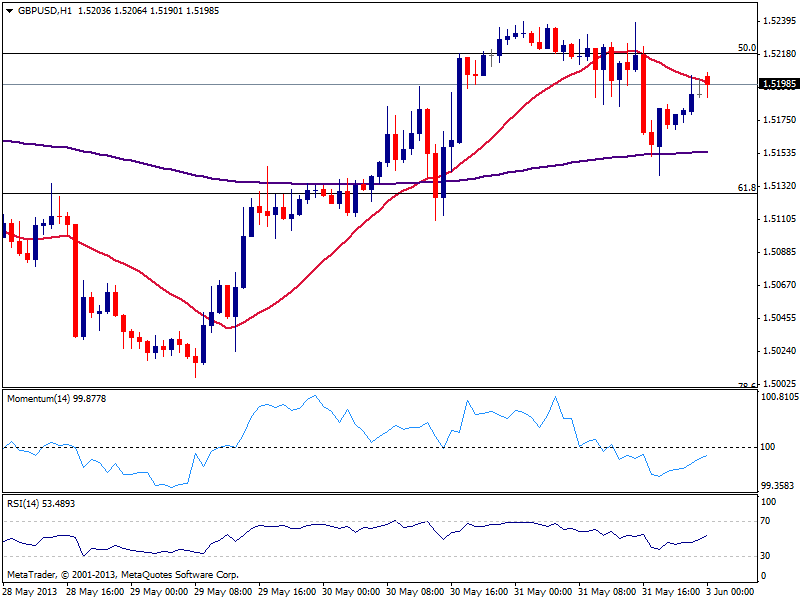
Pound maintains most of its Friday gains against the greenback, with the hourly chart showing price stuck around a slightly bearish 20 SMA, and indicators heading higher still in negative territory. The 1.5220 area, 50% retracement of its latest bullish run has held the upside, and unless price manages to accelerate strongly above it, there’s little room for more gains, as 4 hours chart shows 200 EMA offering resistance around 1.5260, and indicators also losing the upside potential. Immediate support comes at 1.5165, where the 4 hours chart shows several intraday highs and lows for the past couple of weeks: once below, the pair may quickly fall towards 1.5130, next Fibonacci level.
Support levels: 1.5165 1.5130 1.5090
Resistance levels: 1.5220 1.5260 1.5305
USD/JPY Current price: 100.54
View Live Chart for the USD/JPY (select the currency)
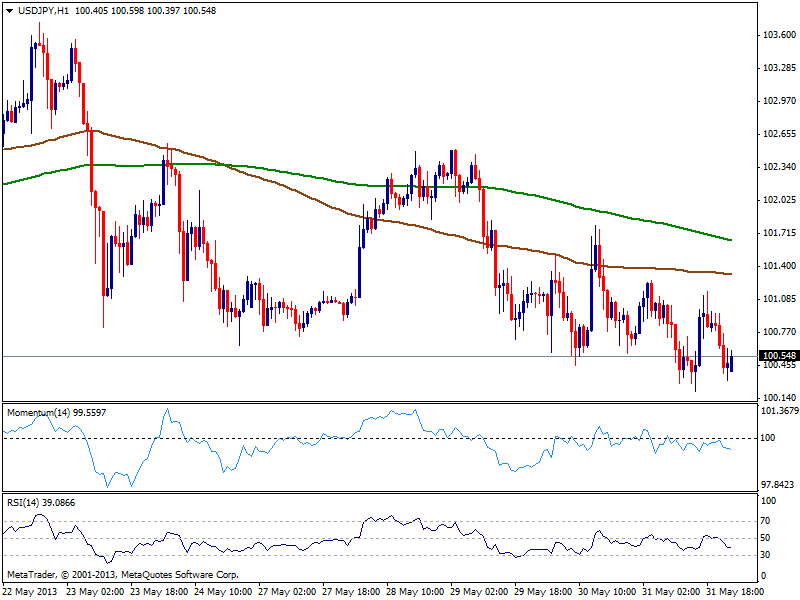
The USD/JPY maintains the short term bearish bias, with the hourly chart showing price below 100 and 200 SMAs and indicators heading south below their midlines. Past week low around 100.20 is the immediate support level, and a break below should see a quick slide towards 99.70, stronger support area, as per several highs over the past months. If buyers are unable to defend the mark, the bearish corrective movement may extend a couple hundred pips this June. In the short term, gains above 100.65 should provide some temporal relief, yet only above far away 102.00 the downside will be denied.
Support levels: 100.20 100.00 99.70
Resistance levels 100.65 101.00 101.25
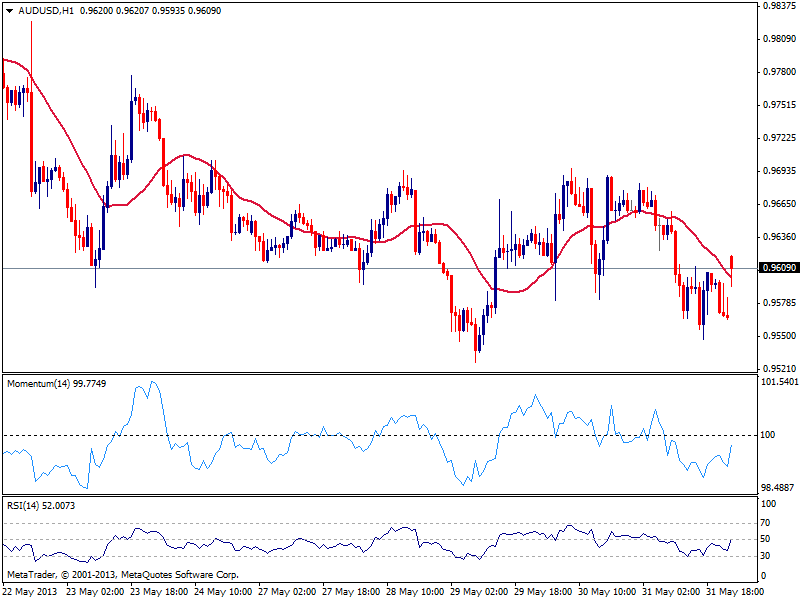
AUD/USD: Current price: 0.9613
View Live Chart for the AUD/USD (select the currency)
Aussie had a lively start of the week against the greenback, on improved Chinese manufacturing data publish over the weekend. Holding above 0.9600, the pair may attempt to continue advancing towards 0.9660 resistance area, as the hourly chart shows current candle opened above 20 SMA while indicators head strongly up, approaching their midlines. Still, the dominant trend is still bearish and risk of selling interest limiting advances remains high. Below 0.9600, a retest of 0.9520 seems likely today.
Support levels: 0.9595 0.9565 0.9520
Resistance levels: 0.9620 0.9660 0.9700
Recommended Content
Editors’ Picks
EUR/USD holds above 1.0700 ahead of key US data

EUR/USD trades in a tight range above 1.0700 in the early European session on Friday. The US Dollar struggles to gather strength ahead of key PCE Price Index data, the Fed's preferred gauge of inflation, and helps the pair hold its ground.
USD/JPY stays above 156.00 after BoJ Governor Ueda's comments

USD/JPY holds above 156.00 after surging above this level with the initial reaction to the Bank of Japan's decision to leave the policy settings unchanged. BoJ Governor said weak Yen was not impacting prices but added that they will watch FX developments closely.
Gold price oscillates in a range as the focus remains glued to the US PCE Price Index

Gold price struggles to attract any meaningful buyers amid the emergence of fresh USD buying. Bets that the Fed will keep rates higher for longer amid sticky inflation help revive the USD demand.
Sei Price Prediction: SEI is in the zone of interest after a 10% leap

Sei price has been in recovery mode for almost ten days now, following a fall of almost 65% beginning in mid-March. While the SEI bulls continue to show strength, the uptrend could prove premature as massive bearish sentiment hovers above the altcoin’s price.
US core PCE inflation set to signal firm price pressures as markets delay Federal Reserve rate cut bets

The core PCE Price Index, which excludes volatile food and energy prices, is seen as the more influential measure of inflation in terms of Fed positioning. The index is forecast to rise 0.3% on a monthly basis in March, matching February’s increase.
