![]() Andre Gratian
Andre Gratian
Market Turning Points
"By the Law of Periodical Repetition, everything which has happened once must happen again, and again, and again -- and not capriciously, but at regular periods, and each thing in its own period, not another's, and each obeying its own law... The same Nature which delights in periodical repetition in the sky is the Nature which orders the affairs of the earth. Let us not underrate the value of that hint." ~ Mark Twain
Current Position of the Market
SPX Long-term trend: The beginning of a lengthy correction may be underway!
SPX Intermediate trend: Potential rally top.
Analysis of the short-term trend is done on a daily basis with the help of hourly charts. It is an important adjunct to the analysis of daily and weekly charts which discuss longer market trends.
Market Overview
Last week, SPX found it difficult to reach the extreme target projected by the 2043 re-accumulation pattern, and it had a 30-point pull-back to 2081 before bouncing from this important support level. It’s fair to say that if we exceed this level before making a new high, we will have a short-term top in place.
As long as the rally from 1810 did not exceed 2075, we could think of it as a rally in a downtrend. But when the index refused to decline below 2033 and made a new high, it moved from a red zone to a grey one and, as stated several weeks ago, if it should move beyond 2116, we may have to start thinking green again, depending on market dynamics. Already, even some of the most dedicated bears are having second thoughts. This is why sentiment indicators are pointing to at least a short-term top. But unless a decline substantial enough to drop significantly below 2033 materializes, the risk of new all-time highs will remain.
The base that was formed at the 1810 double-bottom can be divided into three phases, each carrying its own count potential. The first, as you may recall, projected a rally to about 2070/2080. The second (an extension of the first) gave us a target of 2116, which was subsequently reinforced by the re-accumulation pattern at the 2043 level, which carries essentially the same count (2123). This re-confirmation practically necessitates that we should find at least a short-term top in this area. So far, we reached 2111 before backing-off, the first sign of authentication, and perhaps all we get on the upside.
The third count potential would be to consider the entire double-bottom as the base, and this would allow for a move to 2400 -- which seems a little bit of a stretch. A more sensible approach would be to extend the count to only include the next minor phase, giving us a goal of 2210.
Given the current market internals, next week could turn out to be a significant time frame.
SPX Chart Analysis
Daily chart (This chart, and others below, are courtesy of QCharts.com.)
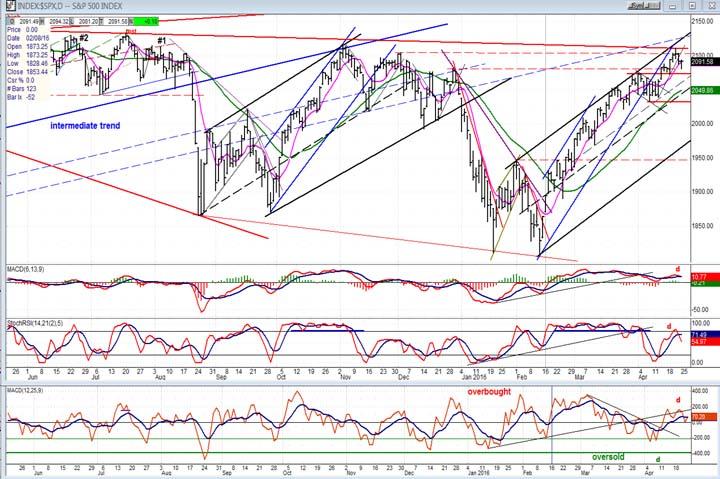
There was no need to redraw any of the main trend and channel lines from last week. They continue to give a good representation of the market’s trend. With Friday’s pull-back, a minor trend line was breached, but nothing serious, and it’s easy to see why we found support where we did! If you look to the left, the dashed line extends all the way to the last short-term peak before the January decline. We’ll see all this better on the 60m chart, and if we should go lower right away, the next support is at 2074.
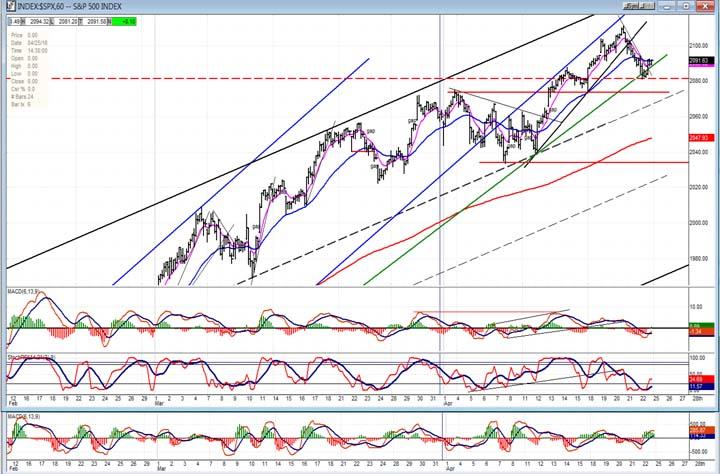
The 60m chart will also show that the hourly indicators have already turned up, suggesting that we could extend our bounce into Wednesday’s FOMC meeting. At Friday’s close, the daily indicators were weakening, but had not given a conclusive sell signal and it would be normal to do some additional distributing before moving lower. On Friday, the A/Ds remained positive all day long and closed near their highs of the day, adding to the possibility of extending the bounce.
In fact, breadth is what has been the bears’ nemesis throughout this entire rally. If you look at the NYSE Summation Index (courtesy of Stock Charts.com) which I have posted under the SPX, it must have been difficult for bears to remain complacent during this uptrend. I did point out that many leading indexes are under-performing and that the NYSI strength may be misleading since it could be attributed to the sudden resurgence of oversold commodity-related equities, but we should not totally ignore it. Over the short-term, the NYSI is showing some negative divergence in its MACD and RSI, and that also points to a short-term top.
Hourly chart
Although we have ascended from the lows through a series of 5-wave patterns, notice that the waves overlap and therefore can only be classified as corrective. This continues to suggest that, in spite of the strong price and breadth showing, we should still be inclined to consider this move as a rally in a downtrend.
The channels remain the same as those drawn on the daily chart. We can see that the price deceleration process is slow. Although we’ve moved out of the blue channel, we continue to hug that lower channel line as we make new highs, and we have not been able to move very far away from the top black channel line. After the 2075 top, the correction could not progress beyond the top third of the black channel (black dashed lines). When we do, a deeper correction will be underway and we will likely find support on the two-thirds dashed line before dropping down completely to the bottom of the black channel. If we do get that low and break through, we may have a chance to resume the more severe downtrend that we thought we had started. But that’s still far away and we’ll have plenty of time to re-examine the longer-term market action.
Time will also be a constraint for the decline which is about to start, since the next significant low should come along with the bottoming of the next 23-25 week cycle which is due in June.
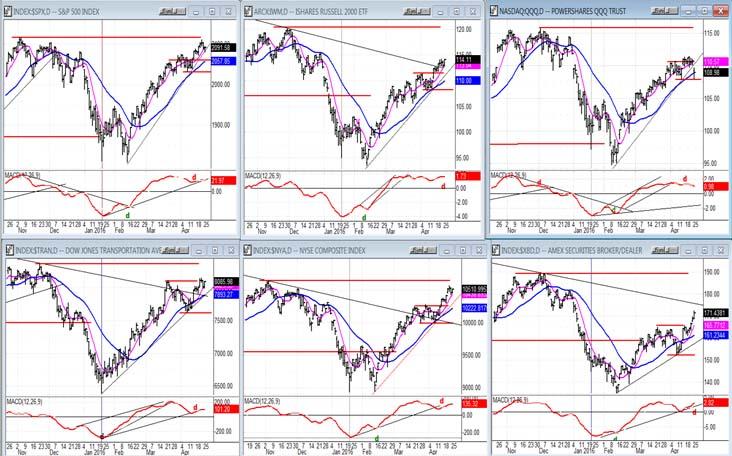
SPX et al…
We’ve gone back to the daily charts this week, so that we can more easily observe some of the changes which took place last week. Some of the weak got stronger, i.e. NYA and XBD, and some of the strong got weaker, namely QQQ and SMH (not shown here). This lack coherence among leaders may only be noise, for now, but I hold the belief that we cannot not get real weakness in the overall market until SMH, QQQ and IWM lead the way. If these three indexes start to weaken in concert, we’d better pay attention, especially if they are joined by the TRAN.
UUP (Dollar ETF)
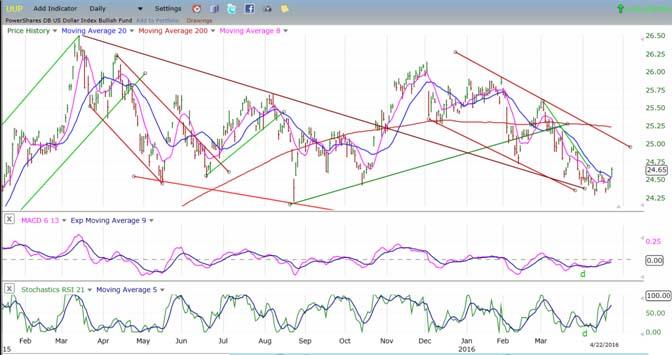
“The dollar has continued to correct but, after reaching the bottom of its down channel while showing positive divergence in the indicators, it is attempting to reverse.” And last week’s action enhances that possibility. The price action is reflected in the indicators, and their action encourages buying in self-reinforcing reciprocity.
A rally in the dollar will have a measurable effect on the performance of the following two indexes over the next few weeks.
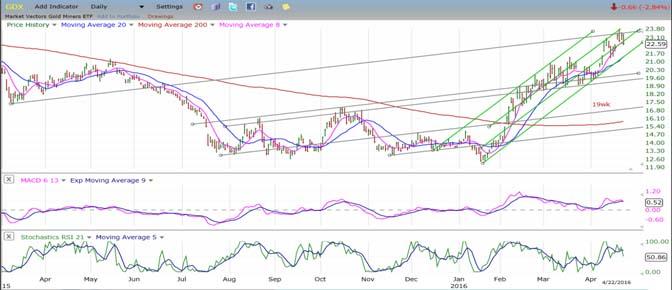
GDX (Gold Miners ETF)
I have posted a chart of GLD under that of GDX so that we can readily see how much weaker GLD really is. If we have another six weeks to go to the bottom of the 25-wk cycle, there could be some significant short-term decline in both indexes. Another 7 or 8 points in GLD would not be surprising.
GDX does not have the same P&F chart formation and it is not as easy to determine the potential extent of its retracement. However, it may become more predictable as we move forward. In the meantime, the parallel trend lines have a good record of producing support and resistance and they can be used for near-term price projections.
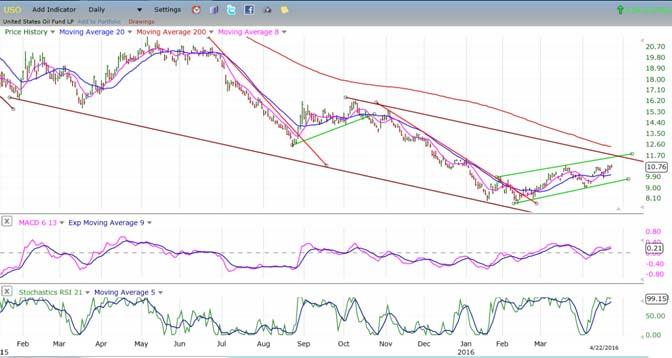
USO (US Oil Trust)
USO may be less subject to the dollar’s influence than gold, but not entirely, and it may find it difficult to move much higher if UUP (above) begins a good rally. Furthermore, if USO cannot extend its move any higher over the near-term, it may be ready to re-test its low and perhaps even go fractionally lower.
Summary
Now that the objective of the rally’s extension has essentially been reached, the SPX should be ready to reverse. A correction starting from here would be expected to last until June. The amount of weakness which develops during this time frame should give us clues about prospects for the intermediate and long-term trends.
The comments made in the daily updates and the Market Summary about the financial markets are based purely on what I consider to be sound technical analysis principles. They represent my own opinion and are not meant to be construed as trading or investment advice, but are offered as an analytical point of view which might be of interest to those who follow stock market cycles and technical analysis.
Recommended Content
Editors’ Picks
USD/JPY jumps above 156.00 on BoJ's steady policy

USD/JPY has come under intense buying pressure, surging past 156.00 after the Bank of Japan kept the key rate unchanged but tweaked its policy statement. The BoJ maintained its fiscal year 2024 and 2025 inflation forecast, disappointing the Japanese Yen buyers.
AUD/USD consolidates gains above 0.6500 after Australian PPI data

AUD/USD is consolidating gains above 0.6500 in Asian trading on Friday. The pair capitalizes on an annual increase in Australian PPI data. Meanwhile, a softer US Dollar and improving market mood also underpin the Aussie ahead of the US PCE inflation data.
Gold price keeps its range around $2,330, awaits US PCE data

Gold price is consolidating Thursday's rebound early Friday. Gold price jumped after US GDP figures for the first quarter of 2024 missed estimates, increasing speculation that the Fed could lower borrowing costs. Focus shifts to US PCE inflation on Friday.
Stripe looks to bring back crypto payments as stablecoin market cap hits all-time high

Stripe announced on Thursday that it would add support for USDC stablecoin, as the stablecoin market exploded in March, according to reports by Cryptocompare.
US economy: Slower growth with stronger inflation

The US Dollar strengthened, and stocks fell after statistical data from the US. The focus was on the preliminary estimate of GDP for the first quarter. Annualised quarterly growth came in at just 1.6%, down from the 2.5% and 3.4% previously forecast.