Highlights
- Weekly FX analysis
- The US economy shows signs it is rising from the ashes
- Should we be worried about China’s stock market sell off?
- Look Ahead: Equities
- Look Ahead: Commodities
- Global Data Highlights
Market Movers: Weekly Technical Outlook
GBP/USD
Source: FOREX.com
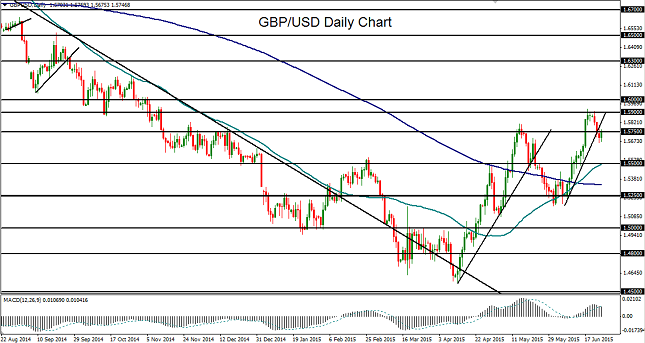
GBP/USD (daily chart) rose to a year-to-date high of 1.5928 shortly after mid-June. Overall, this high represented a full 50% bullish retracement of the previous downtrend from the five-year high of 1.7190 in July of 2014 down to the four-year low of 1.4565 this past April. Since that multi-year low in April, the currency pair has been on a substantial rebound and recovery path, with the exception of a deep pullback down to 1.5250-area support in the latter half of May. From early June, GBP/USD then saw a steep incline that pushed above the 1.5900 resistance level to reach the noted 2015 high of 1.5928. During the course of this rise, in mid-June the key 50-day moving average crossed above the 200-day average for the first time since the beginning of a bullish trend in late 2013. Despite this bullish technical indication, the currency pair had become significantly over-extended to the upside and subsequently retreated from its year-to-date highs. While the recent trend for GBP/USD has been in bullish recovery mode, the current pullback could well have further to run to the downside on any sustained dollar strength. If the currency pair continues to trade under the 1.5900 level, the key downside target on an extended pullback resides around 1.5500, with a further downside pullback target around the noted 1.5250 support area. To the upside, on any break back above the noted 2015 high, major resistance resides immediately above at the key 1.6000 level.
EUR/USD
Source: FOREX.com
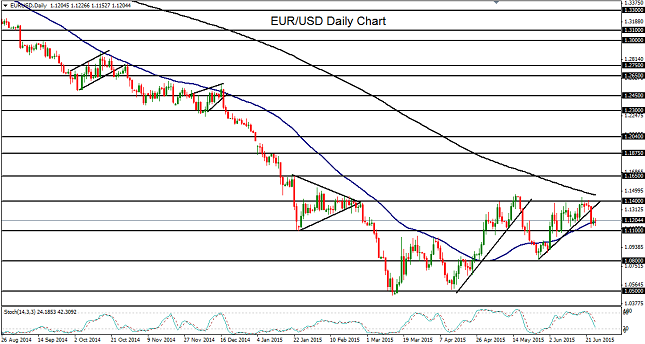
EUR/USD (daily chart) remains weighted down within the context of a sharp bearish trend that has been in place for more than a year, since the May 2014 highs near 1.4000. Although the currency pair is well off its 12-year low of 1.0461 that was established this past March, price action has continued to trade well below its key 200-day moving average, as has been the case since mid-year last year. After the sharp slide from the May 2014 highs around 1.4000 down to the noted long-term low of 1.0461 in March, EUR/USD formed a rough double-bottoming pattern around the 1.0500 support area before rising back up to 1.1400 area resistance by mid-May. After a subsequent pullback and bounce off 1.0800 support in late May, the currency pair entered into a relatively tight trading range during much of the month of June. This trading range has been bounded to the upside by key resistance around the noted 1.1400 level, and to the downside by key support around 1.1100. With both a longer-term and shorter-term bearish bias currently in place, the key level to watch to the downside remains at this 1.1100 support level. Any sustained break below 1.1100 could push EUR/USD back down towards its 1.0800 and then 1.0500 support targets. To the upside, the 1.1400 level should continue to provide major resistance for any rebounds within the current trading range.
USD/JPY
Source: FOREX.com
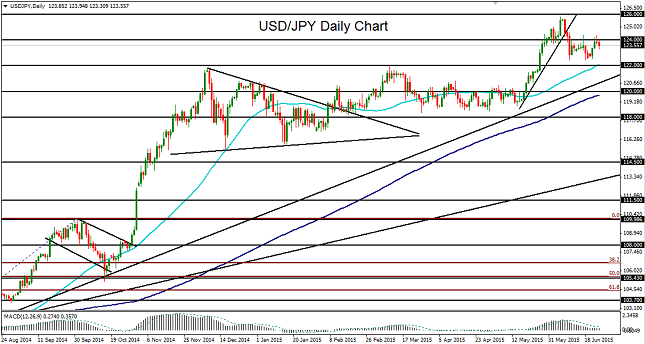
USD/JPY (daily chart) remains relatively range bound off its 13-year high of 125.85 that was hit in early June. Prior to that high being reached, the currency pair saw a sharp climb in the latter half of May and early June. That climb pushed USD/JPY above its previous resistance and long-term high of 122.00. From a long-term perspective, the currency pair has spent more than three years trading within a general uptrend that has lifted it from its lows below 80.00 in 2012 up to its noted 13-year high that approached the 126.00 upside target several weeks ago. After reaching that high, the overbought and over-extended currency pair retreated below 124.00 and settled into a trading range consolidation that is characteristic of USD/JPY price action. While the long-term trend remains bullish, the current pullback and consolidation could well be protracted, as was the case in March, April, and much of May. Short-term resistance on this consolidation is around 124.00, with any sustained break above that level targeting the 126.00 resistance objective once again. To the downside, major support within the context of the current bullish trend resides around the 122.00 previous resistance level.
AUD/USD
Source: FOREX.com
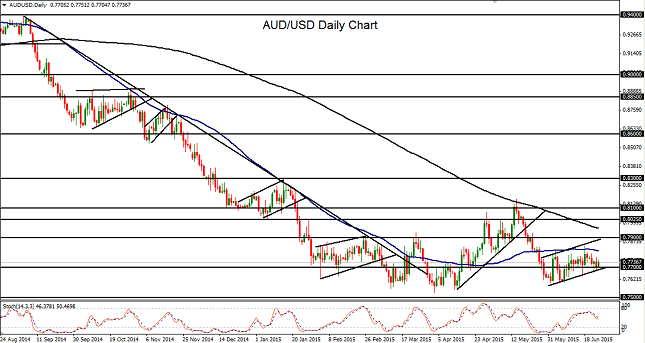
AUD/USD (daily chart) has been trading within a bearish flag pattern consolidation just off its long-term lows since late May. This chart pattern could serve as a potential impetus for an impending continuation of the entrenched downtrend on any breakdown of the pattern. Since the intermediate 0.9500-area high in July of 2014, AUD/USD has spent the past year plummeting down to hit a new five-year low of 0.7532 this past April. After that low was established, the currency pair rose in a major rebound to hit a high of 0.8162 by mid-May, right at the 200-day moving average resistance, before plunging sharply from that resistance back down once again towards its multi-year lows. During the course of the current flag pattern unfolding, price action has managed consistently to close under the key 50-day moving average every trading day and return back towards its lows after rebounds. Any major break below this flag pattern and sustained trading under the short-term 0.7700 support level would confirm the prevailing bearish bias. In that event, the next major downside target remains at the key 0.7500 level, which is just slightly below the noted five-year low of 0.7532 that was established in early April. A further downside objective on any break below 0.7500 resides at the key 0.7300 support level.
The US economy shows signs it is rising from the ashes
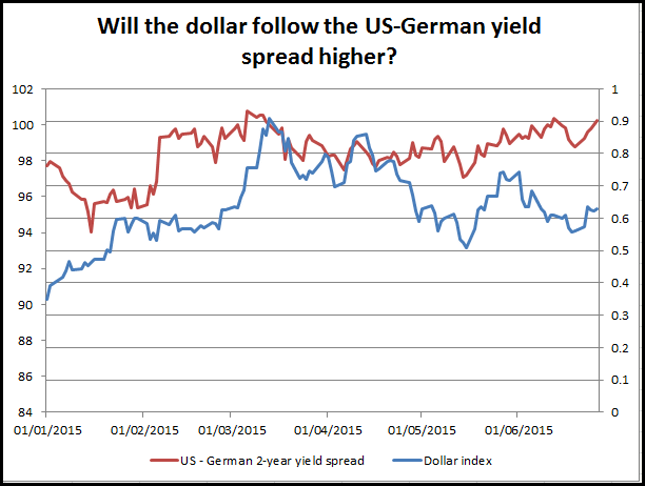
The latest economic data is showing some clear signs that the US economy could be roaring back to life after a weather- inspired slowdown in the first quarter. The list of positive data surprises last week included: consumer confidence – it rose to its highest level since April, an upward revision to Q1 GDP, and a spate of extremely strong housing market data, some economists now expect new home sales in the US to reach their highest level since before the 2007/2008 financial crisis. This helped to reignite the rally in the buck that had lost steam in recent weeks. The USD appreciated against all G10 currencies, and had some stand-out gains vs. the EUR, Swiss franc and Aussie dollar. So where will the buck go next?
This week will be crucial for the direction of the US currency. Some key data releases will be digested by the market including pending home sales, manufacturing ISM and the all-important NFP report. The market is looking for another stellar month of job growth and a fall in the unemployment rate back to its lowest level since for 7 years. Although this is a holiday-shorted week, we think that another strong week of data for the dollar bulls could set the scene for a summer rally in the buck.
However, we may need to see the following before we can be confident that the dollar is king once again:
- Positive data surprises. The Citigroup US economic surprise index has risen to its highest level since January after a long spate of data misses.
- A continued increase in Treasury yields, especially the 2-year yield, which has a close correlation with the USD and was close to the June high of 0.74% at the end of last week.
- A solution to the Greek crisis so that the market can go back to focusing 100% on the fundamentals and the prospect of a US interest rate rise later this year.
From a technical perspective, the dollar index also needs to break above its 50-day sma at 95.47; this capped last week’s dollar rally. Above here, the late May/ early June high comes into view at 97.70. A move to this level would suggest that momentum is on the dollar’s side and we could see back to 100.00 in the medium-term. Interestingly, the dollar index tested the base of the daily Ichimoku cloud last week at 95.25, if we can break above this level it would be a bullish development and it may open the door to key resistance at the top of the cloud at 96.75.
In conclusion, this could be a critical week for the dollar. If the economic data can continue to surprise on the upside and if yields continue to rise then we could see some bullish developments on the technical side, which may set up the buck for a summer rally.
Figure 1:
Source: FOREX.com
Should we be worried about China’s stock market sell off?
China’s Shanghai composite fell into bear market territory last week, and dropped 11% between Wednesday and Friday. This sell-off was not copied around the world, even though European and US stock market sentiment faded slightly as we edged towards the end of the week. So what stoked the China sell off and could it impact sentiment towards global stocks?Equity analysts seem to be calling the recent price action the end of the uptrend. Since peaking on June 12th at 5,178, this index has dropped nearly 20%, which is considered bear market territory. The reason for the sell-off may be down to four factors including: increased equity supply, weak earnings growth, high valuations and a weakening economic trajectory. These problems are a mix of structural (increased supply) and cyclical (growth questions) issues, which could make a recovery hard to achieve in the short-term. We expect to see further losses for the Chinese index in the coming weeks, and if the pace of the recent sell-off holds up then we could break the key 4,000 level at some point this week.
For now, we don’t think that US and European indices will be affected, as ECB QE and a cautious stance from the Federal Reserve could negate the bad news coming from China. However, regional indices may be at risk. Risk aversion caused by events in China contributed to the sell-off in the Nikkei, which had reached a 15 year high early last week. Likewise, the Australian stock index also fell more than 1% after hitting moving average resistance. The Hang Seng also took a knock, falling 3% due to its proximity to the action in China. If Chinese shares continue their precipitous drop this week then we could see further losses for regional indices, and if the pace of declines does not slow down then European and US indices may not be able to avoid the headwinds coming from the East.
Look Ahead: Stocks
Greece. We know you are probably sick and tired of hearing about it, and so are we, but this is exactly what all the focus has been on for the past couple of weeks. Unfortunately as no agreement was reached on Thursday, the Eurogroup has once again adjourned its negotiations on this issue and the plan is to meet again on Saturday. The German Chancellor Angela Merkel has said that “time is short,” and that European leaders have “agreed that everything must be done to find a solution on Saturday.” The IMF meanwhile still expects to receive the €1.6 billion payment it is owed by Greece on Tuesday. So, there are still hopes that a last minute deal will be reached after all. But if no deal is achieved at the weekend then Greece could default come Tuesday. Given the highly uncertain outcome of the talks, the bulls are refusing to go into the weekend being boldly long – hence, the markets have pulled back slightly at the end of this week. At the same time, the bears are refusing to show their presence either because of the possibility that Greece will be saved, which could see the stock markets gap higher at the open on Monday. Due to this uncertainty, it is extremely difficult – if not impossible – to predict the direction of the European stock markets for early next week. The outlook is further complicated because of the impact of the euro which tends to correlate inversely with the European stock indices. The EUR/USD will also be impacted by next week’s high-impact data releases, not least the Eurozone CPI flash estimate on Tuesday and the US nonfarm payrolls data.
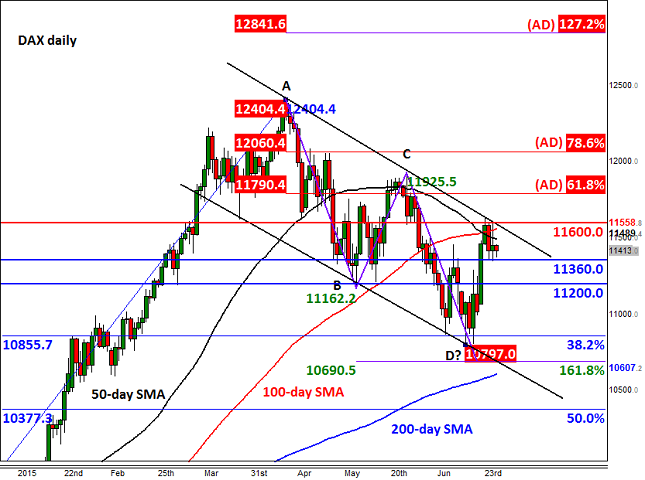
Our technically-minded traders might want to pay close attention to the volatile German DAX index, which, depending on the outcome of the Greece talks, could move abruptly at the start of the week. The index has broken several resistance levels such as 11200 and 11360. The latter is currently holding as support, but if this gets broken down then the DAX may make a move towards the former. Beyond 11200, the next key support is all the way down at 10855, a level which corresponds with the long-term 38.2% Fibonacci retracement level. Thereafter is the prior low at just below 10800 and then the 161.8% Fibonacci extension level of the BC swing at 10690. While the index remains inside the bearish channel and below key resistance at 11600, the near term technical outlook would therefore remain bearish.
However if the DAX manages to break out of its bearish channel then a major rally could get underway. That’s because the potential bottom at just below 10800 has been formed near the relatively-shallow 38.2% Fibonacci retracement level of the long-term upswing. In healthy bull markets, a pullback to around the 38.2% Fibonacci level often precedes a rally that extends at least to the 127.2% Fibonacci level of the corrective move. In the case of the DAX, the 127.2% extension (i.e. of the AD swing) comes in at 12840. Now, that level is a long way away and as such it is a long term bullish target. In the more near-term outlook, the bulls will need to keep a close eye on the Fibonacci retracement levels of the abovementioned swing, at 11790 (61.8%) and 12060 (78.6%), which could offer some resistance.
In summary, going into the weekend, things are looking highly uncertain for the German DAX index and European stock markets in general. The bulls will require the DAX to break out of its bearish channel before more gains could be seen. Obviously a deal for Greece at the weekend could be the trigger, though the resulting buying pressure could still be relatively short-lived as some of the good news has already been priced in. Meanwhile, a particularly bad outcome for the stock markets would be if Greece fails to find a deal with its creditors this weekend. An even worse outcome would be if it defaults come Tuesday and worse still would be if it eventually exited the euro zone. Over the longer term however the European stock markets are likely to remain supported by the virtually zero interest rate policy and the on-going bond buying stimulus programme at the ECB.
Source: FOREX.com. Please note this product is not available to US clients
Look Ahead: Commodities
Yet again, crude failed to move higher in response to news of a sharper-than-expected draw of 4.9 million barrels in US oil stocks in midweek. It appears as though investors are growing worried about the possibility of Iran flooding the already-saturated global oil market soon. After all, the P5+1 group of Western powers’ self-imposed June 30 deadline for negotiating a final nuclear agreement with Iran is just days away now and the signs are that, unlike the Greek situation, the talks are going well – though by no means the outcome is certain. If sanctions over Iranian oil are lifted, this could have a major impact on oil prices. At the moment though, the market seem relaxed, probably for two reasons. First, the market does not think that the oil sanctions will be lifted completely. Second, that even if the sanctions are lifted completely, it would take the Iranian oil industry a long time to recover. However these assumptions are dangerous in our view. For a start, the infrastructure is already there which means production could increase more quickly than some might think. What’s more, even if it takes a long time for Iranian oil output to return near the pre-sanctions levels, it is the market’s expectations about this additional supply that could weigh on oil prices.
Iran’s oil minister recently said that Tehran’s crude output could increase by almost 1 million barrels per day within 6 months after the time the sanctions are lifted. With the OPEC already producing about 1 million barrels more than its agreed quota of 30 million barrels per day, it wouldn’t take a rocket scientist to come to the conclusion that the supply glut would exacerbate in the event of Iran making a full return to the market. Worried about its lost market share to US shale producers, it is unlikely that the Saudis will make room for this additional output. Libya, which has suffered supply outages of its own in recent times, is also unlikely to make changes to its output and for that matter neither might Iraq. Other OPEC members are only likely to trim their productions levels if the Saudis, Iraqis and co do the same which, as mentioned, appear unlikely. Against these backdrops, any potential falls in non-OPEC supply output may easily be absorbed. This, in our view, is exactly while oil prices have failed to move higher despite signs of falling US oil production and destocking of crude from the admittedly record levels.
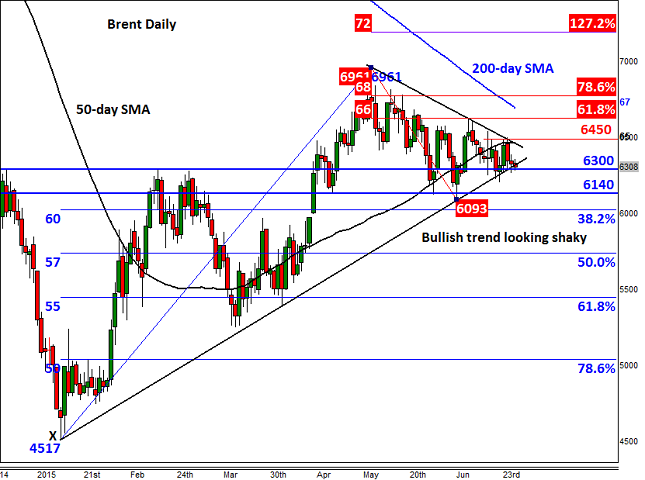
Ahead of the June 30 deadline, Brent is consolidating in between the converging trend lines which you can see on the daily chart. The support trend is looking shaky and given the abovementioned fundamental backdrops we wouldn’t be surprised if it broke it down even before we hear anything on Iran. If broken, Brent could easily drop to the next level of support at $61.40 or revisit this month’s low of just below $61.00, before making its next move. The Fibonacci levels are among the longer term targets for the bears, though Brent could get to those levels fairly quickly if Iran was allowed to make a full return to the market. Meanwhile a potential break above the bearish trend and resistance at $64.50 could pave the way for a move towards the 61.8% Fibonacci retracement level from the May high, around $66.25. Thereafter is the 200-day moving average at $67.15 and then the May high itself at $69.60.
Source: FOREX.com. Please note this product is not available to US clients
Global Data Highlights
Eurozone:
Confidence data, June: 29th June, 0900 BST
The market is expecting a fairly solid reading of economic, service and consumer confidence, although the business climate indicator is expected to tick down a notch. An unexpected increase in the index could trigger a rally in the EUR, which managed to stay fairly well supported last week even in the face of Greek uncertainty.
Unemployment rate, May: 30th June, 0900 GMT
The market expects no change in the unemployment rate, which is expected to stay steady at 11.1%. This is still an extremely high level and masks big regional differences. Unless we see a big surprise in data then we don’t think that this data will be a major market-moving event.
CPI estimate, June: 30th June, 0900 GMT
The market is expecting the second consecutive monthly increase in prices for the currency bloc in June; however the pace of increase is expected to slow. The market is looking for a 0.2% rise after a 0.3% rise in May. The core rate of inflation may also moderate to 0.8% from 0.9%. We continue to believe that the price trajectory will be higher for the currency bloc, although it could take some time for the CPI rate to reach the ECB’s preferred target of 2%. If inflation is weaker than expected we could see weakness in the single currency.
ECB minutes, 1130 GMT
We don’t expect these minutes to tell us anything that we don’t know already, however it will be interesting to see what discussions were taking place at the Bank and if there were any dissenters. We will be looking for any signs that Germany is not happy with the current pace of QE, and if they could push to cut the programme short. We will also watch out for any discussions about emergency funding for Greek banks. Unless we get a juicy nugget of new information within these minutes then they are unlikely to be market moving.
Retail sales, May: 3rd July, 0900 GMT
The market is expecting a moderate increase after April’s Easter-inspired jump in sales for the currency bloc. 0.1% is expected, anything larger could have a positive impact on the single currency.
US:
Pending home sales, May: 29th June, 1400 GMT
The market is looking for another month of fairly decent home sales data; pending sales are transactions that haven’t gone through yet, but the recent boost to actual home sales data suggest that the pipeline of sales could be strong. A larger than expected increase could reignite the dollar rally.
Chicago Purchasing Manager’s Index, June: June 30th, 1345 GMT
The market expects a strong pick-up to 50.0 – just in expansion territory – after May’s unexpected decline to 46.2, the lowest reading since March. This index has been volatile so far this year and struggled through the winter months. The market will be looking for a large rebound to help boost confidence in Q2 GDP growth. A downward surprise could hurt the buck.
ADP Employment change, June: 1st July, 1215 GMT
The market is looking for another strong reading in private sector employment, this time of 210k, after 201k in May. The ADP has been above consistently above 150k since Jan 2013, and we expect it to remain so in June. A strong number could give the dollar a boost and take the shine off the EUR and GBP.
ISM manufacturing, June: 1st July, 1400 GMT
This index is expected to edge up to 53.1 from 52.8 in May; however, the risk could be to the downside after a weaker reading from the US Markit PMI index for June. More interesting for traders could be the prices paid index, this is expected to show a rise to 52.0 from 49.5, which would be the highest reading since October 2014. A pick-up in inflation could boost the dollar even if the headline ISM index is weaker than expected.
Labour market data, June: 2nd July, 1230 GMT
The market is looking for another +200k figure, 230k for June vs. 280k for May. The unemployment rate is expected to edge down to 5.4% from 5.5%, and hourly earnings are expected to inch up by 0.2% on the month, while the annual rate of wage growth is expected to remain steady at 2.3%. This is a major data release and we expect it to set the tone for markets for the rest of the month. Watch wage data, another strong reading could boost expectations of a Fed rate rise and increase the attractiveness of the greenback.
UK:
Mortgage and credit data, May: 29th June, 0830 GMT
The market is expecting a GBP 1.1bn increase in consumer credit and a GBP 2.1bn boost to mortgage lending, which could lead to an increase in mortgage approvals, the market expects a rise of 68.9k in May, up from 68.1k April. Overall, lending remains strong in the UK and mortgage approvals are expected to maintain their upward trend, especially after election uncertainties were put to bed.
Q1 GDP: 30th June, 0830 GMT
This is the final reading of GDP and unless there is a big revision to the previous figure then it may not be particularly market-moving. The market is looking for a quarterly rise of 0.4%, which would push up annual growth to 2.5% from 2.4%, which would be a decent rate of growth for a G10 economy. A larger than expected upward revision may boost the pound.
Manufacturing PMI, June: 1st July, 0830 GMT
The market expects a pick-up to 52.4 vs. 52.0 in May, which is below the average level of the last 18 months, which comes in at 54.2. We will be watching to see if this index has bottomed, and digging a bit deeper into the data to see if forward-looking indicators such as new orders are also picking up in line with expectations for continued economic strength this year.
Services PMI, June: 3rd June, 0830 GMT
The market is looking for a strong increase in this all-important index to 57.5 from 56.5 in May. If this is confirmed then it would be a positive omen for Q2 GDP. 57.5 would erase some of the losses in May; however, overall service sector growth has been fairly solid so far this year. A stronger than expected reading could be GBP positive.
Japan:
Retail sales, May: 28th June, 2350 GMT
The market is expecting a strong monthly reading for retail sales of 1%, up from 0.3% in April. If this is confirmed then it would be the largest rate of growth since September 2014. However, due to statistical factors the annual rate is expected to decline to 2.2% from 4.9%. A stronger than expected reading could trigger some strength in the JPY.
Tankan index, Q2: 30th June, 2350 GMT
The Japanese industrial index is expected to show an increase in the outlook for large manufacturers to 14 from 10 in Q1, if confirmed then this would be the biggest increase for a year. Small manufacturers are expected to remain stable, while both large and small non-manufacturing businesses are expected to see a pick-up in confidence. It is also worth watching the capex figure. The large all-industry capex is expected to increase by 5.3%, up from a 1.2% decline in Q1. Please note that a weaker capex figure could knock sentiment towards the JPY.
Information on these pages contains forward-looking statements that involve risks and uncertainties. Markets and instruments profiled on this page are for informational purposes only and should not in any way come across as a recommendation to buy or sell in these assets. You should do your own thorough research before making any investment decisions. FXStreet does not in any way guarantee that this information is free from mistakes, errors, or material misstatements. It also does not guarantee that this information is of a timely nature. Investing in Open Markets involves a great deal of risk, including the loss of all or a portion of your investment, as well as emotional distress. All risks, losses and costs associated with investing, including total loss of principal, are your responsibility. The views and opinions expressed in this article are those of the authors and do not necessarily reflect the official policy or position of FXStreet nor its advertisers. The author will not be held responsible for information that is found at the end of links posted on this page.
If not otherwise explicitly mentioned in the body of the article, at the time of writing, the author has no position in any stock mentioned in this article and no business relationship with any company mentioned. The author has not received compensation for writing this article, other than from FXStreet.
FXStreet and the author do not provide personalized recommendations. The author makes no representations as to the accuracy, completeness, or suitability of this information. FXStreet and the author will not be liable for any errors, omissions or any losses, injuries or damages arising from this information and its display or use. Errors and omissions excepted.
The author and FXStreet are not registered investment advisors and nothing in this article is intended to be investment advice.
Recommended Content
Editors’ Picks
USD/JPY holds above 155.50 ahead of BoJ policy announcement

USD/JPY is trading tightly above 155.50, off multi-year highs ahead of the BoJ policy announcement. The Yen draws support from higher Japanese bond yields even as the Tokyo CPI inflation cooled more than expected.
AUD/USD consolidates gains above 0.6500 after Australian PPI data

AUD/USD is consolidating gains above 0.6500 in Asian trading on Friday. The pair capitalizes on an annual increase in Australian PPI data. Meanwhile, a softer US Dollar and improving market mood also underpin the Aussie ahead of the US PCE inflation data.
Gold price keeps its range around $2,330, awaits US PCE data

Gold price is consolidating Thursday's rebound early Friday. Gold price jumped after US GDP figures for the first quarter of 2024 missed estimates, increasing speculation that the Fed could lower borrowing costs. Focus shifts to US PCE inflation on Friday.
Stripe looks to bring back crypto payments as stablecoin market cap hits all-time high

Stripe announced on Thursday that it would add support for USDC stablecoin, as the stablecoin market exploded in March, according to reports by Cryptocompare.
US economy: Slower growth with stronger inflation

The US Dollar strengthened, and stocks fell after statistical data from the US. The focus was on the preliminary estimate of GDP for the first quarter. Annualised quarterly growth came in at just 1.6%, down from the 2.5% and 3.4% previously forecast.
