![]()
The Swiss National Bank today decided to maintain the ceiling on the franc at 1.20 per euro and its interest-rate target range at 0 to 0.25 per cent. This was in line with the expectations. However, hopes that the SNB would impose negative deposit rates (like the ECB) were not satisfied and this led to a sharp rally in the franc. Nevertheless, the Bank stressed its “utmost determination” to do what it takes to keep the cap on the exchange rate and is prepared to take “further steps immediately if necessary.” Meanwhile officials at the Bank cut their inflation forecast, warning that the risk of deflation has “increased again”, and that the economic outlook has “deteriorated considerably”. The warnings imply that the SNB may well be forced to loosen policy further in the near future, which could lift the stubbornly low EUR/CHF rate by a considerable amount. Meanwhile the US Federal Reserve last night somehow managed to keep everyone happy: contrary to widespread speculation, it decided to keep the “considerable time” pledge until the first rate hike in its statement. This boosted stocks, sending the Dow to a fresh record high. The dollar bulls were also satisfied with the so-called “dot plot” of Fed members’ forecasts for interest rates edging higher. “What Do the Dots Say?” is my colleague Matt Weller’s explanation in more detail – worth reading.
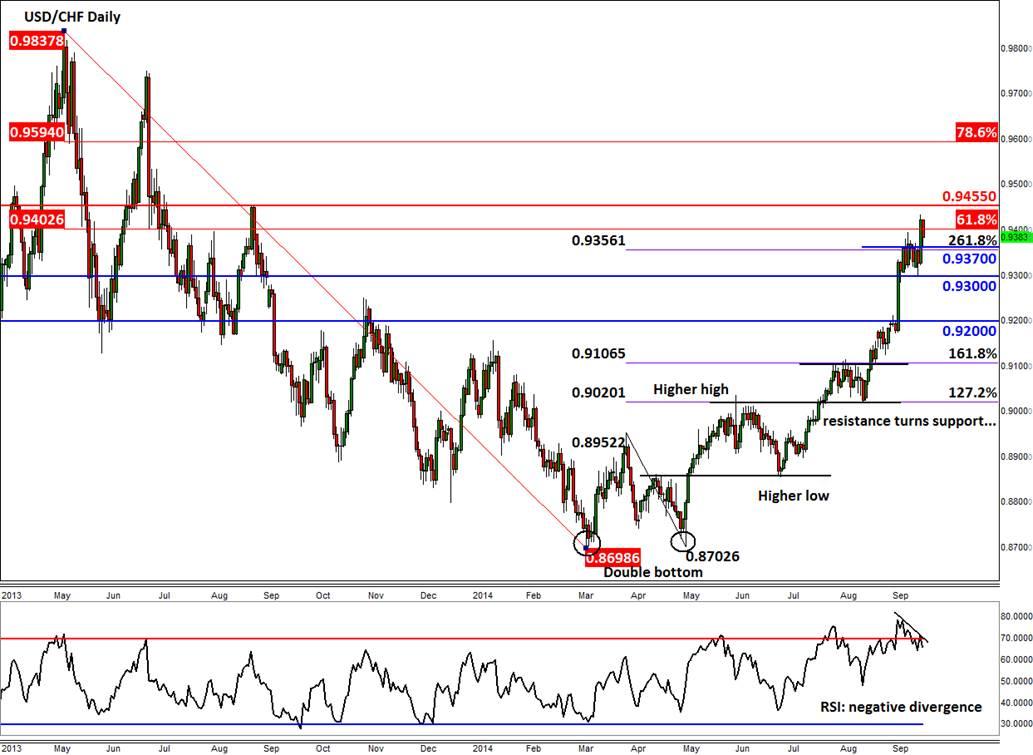
Following the Fed’s policy decision, the USD jumped but has since given back some of its gains particularly against the CHF after the SNB refused to go negative on deposit rates. Nevertheless, the charts are still looking constructive for the Swissy. The daily, for example, shows clear characteristics of a bull market with price continuing to make higher highs and higher lows (see figure 1, below). But there are a couple of warnings signs. For a start, the daily RSI has created a negative divergence, suggesting that the bullish momentum may be fading. This is interesting particularly as the underlying price has now reached the key 61.8% Fibonacci retracement level of the downswing from the 2013 high, at around 0.9400. Having said that, the bears still have a lot of wood to chop: they need to push price below support at 0.9370 first and then 0.9300 (i.e. on a closing basis) before the tide turns. If they manage to do that then 0.9200 could be the next downside target, a level which was formerly support. Meanwhile on the upside there is further resistance seen at 0.9455 followed by the 78.6% Fibonacci retracement level at 0.9595.
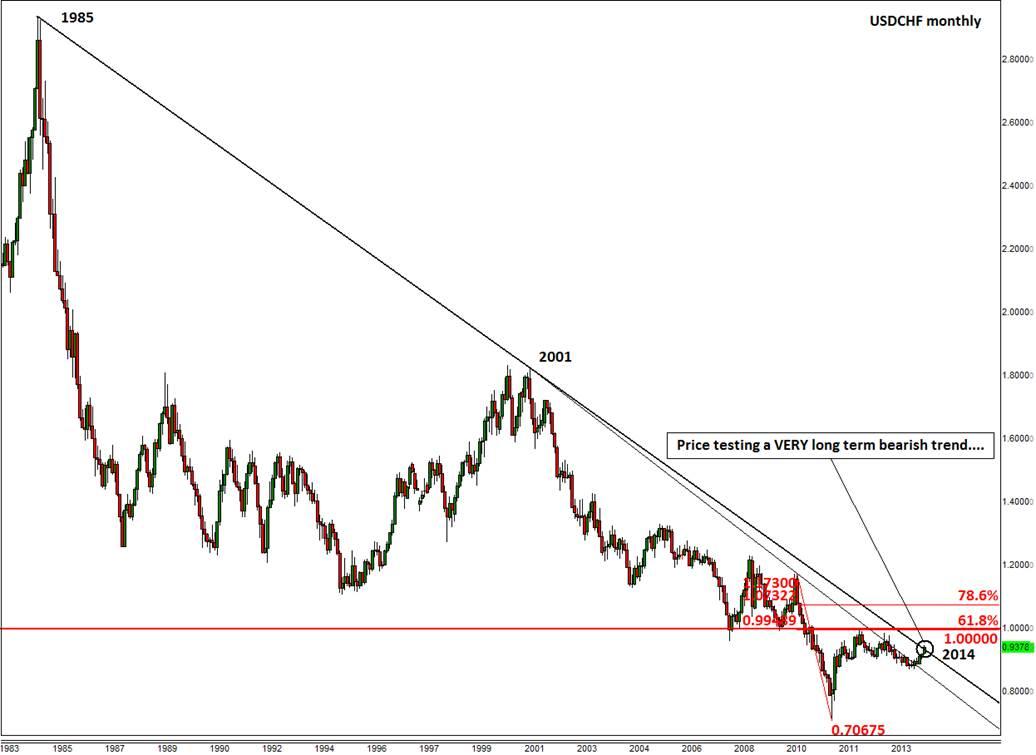
But zooming out a little bit, or a lot in this case, the monthly chart shows (see figure 2, below) a completely different picture, for the Swissy is testing a VERY long-term bearish trend line. This trend has been derived from connecting the high points in 1985 with 2001, and extending the line to the future. As can be seen, price is now testing this trend line which means there is a chance for a major pullback here. However should price break through it, and so far that seems to be the case, then we could see this bull trend continue for the foreseeable future towards higher, much higher, levels. The fundamentals support the latter scenario.
Trading leveraged products such as FX, CFDs and Spread Bets carry a high level of risk which means you could lose your capital and is therefore not suitable for all investors. All of this website’s contents and information provided by Fawad Razaqzada elsewhere, such as on telegram and other social channels, including news, opinions, market analyses, trade ideas, trade signals or other information are solely provided as general market commentary and do not constitute a recommendation or investment advice. Please ensure you fully understand the risks involved by reading our disclaimer, terms and policies.
Recommended Content
Editors’ Picks

EUR/USD advances toward 1.1200 on renewed US Dollar weakness
EUR/USD is extending gains toward 1.1200 on Friday, finding fresh demand near 1.1150. Risk sentiment improves and weighs on the US Dollar, allowing the pair to regain traction. The Greenback also reels from the pain of the dovish Fed outlook, with Fedspeak back on tap.

Gold price advances further beyond $2,600 mark, fresh record high
Gold price (XAU/USD) gains positive traction for the second successive day on Friday and advances to a fresh record high, beyond the $2,600 mark during the early European session.

USD/JPY recovers to 143.00 area during BoJ Governor Ueda's presser
USD/JPY stages a recovery toward 143.00 in the European morning following the initial pullback seen after the BoJ's decision to maintain status quo. In the post-meeting press conference, Governor Ueda reiterated that they will adjust the degree of easing if needed.

Shiba Inu is poised for a rally as price action and on-chain metrics signal bullish momentum
Shiba Inu remains strong on Friday after breaking above a symmetrical triangle pattern on Thursday. This breakout signals bullish momentum, further bolstered by a rise in daily new transactions that suggests a potential rally in the coming days.

Bank of Japan set to keep rates on hold after July’s hike shocked markets
The Bank of Japan is expected to keep its short-term interest rate target between 0.15% and 0.25% on Friday, following the conclusion of its two-day monetary policy review. The decision is set to be announced during the early Asian session.

Moneta Markets review 2024: All you need to know
VERIFIED In this review, the FXStreet team provides an independent and thorough analysis based on direct testing and real experiences with Moneta Markets – an excellent broker for novice to intermediate forex traders who want to broaden their knowledge base.

