As expected, Gold failed at the price of 1385, and has been attempting to find a mid-term direction since then. The commercials are continuing to provide us with a very clear short setup with a commercial index value of 8.7 in the three-yearly comparison.
As early as the end of July, I drew attention to a decisive level in Gold at this point. We have now arrived at this level once more. After the first attack of this level at 1320 dollars stuck, the bulls lost their momentum even before reaching the 1380 dollars. Now we are once again seeing a very weak weekly candle in Gold.
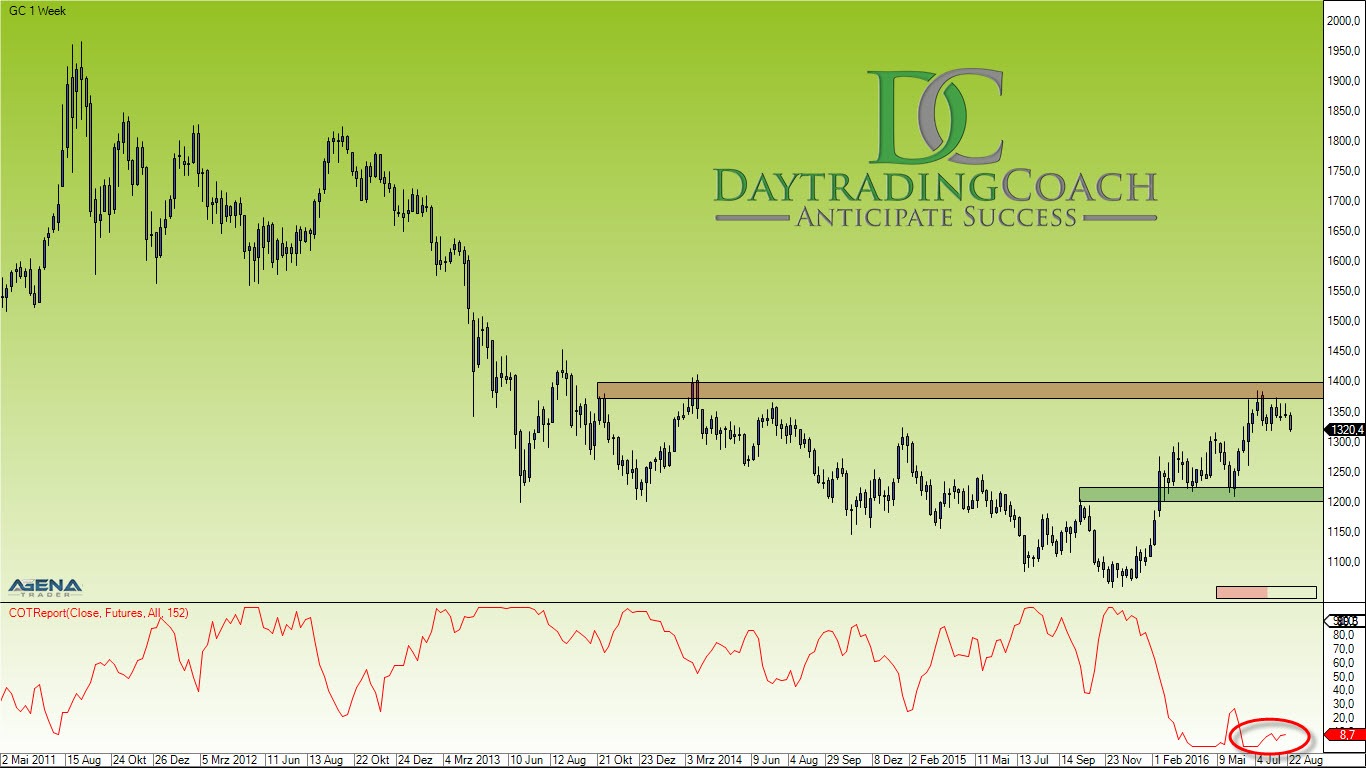
The next support is located in the area of the two weekly highs around 1300 dollars. If this level does not stick, a plunge down into the lower 1200 region is probable. I have marked the big support level on the weekly chart.
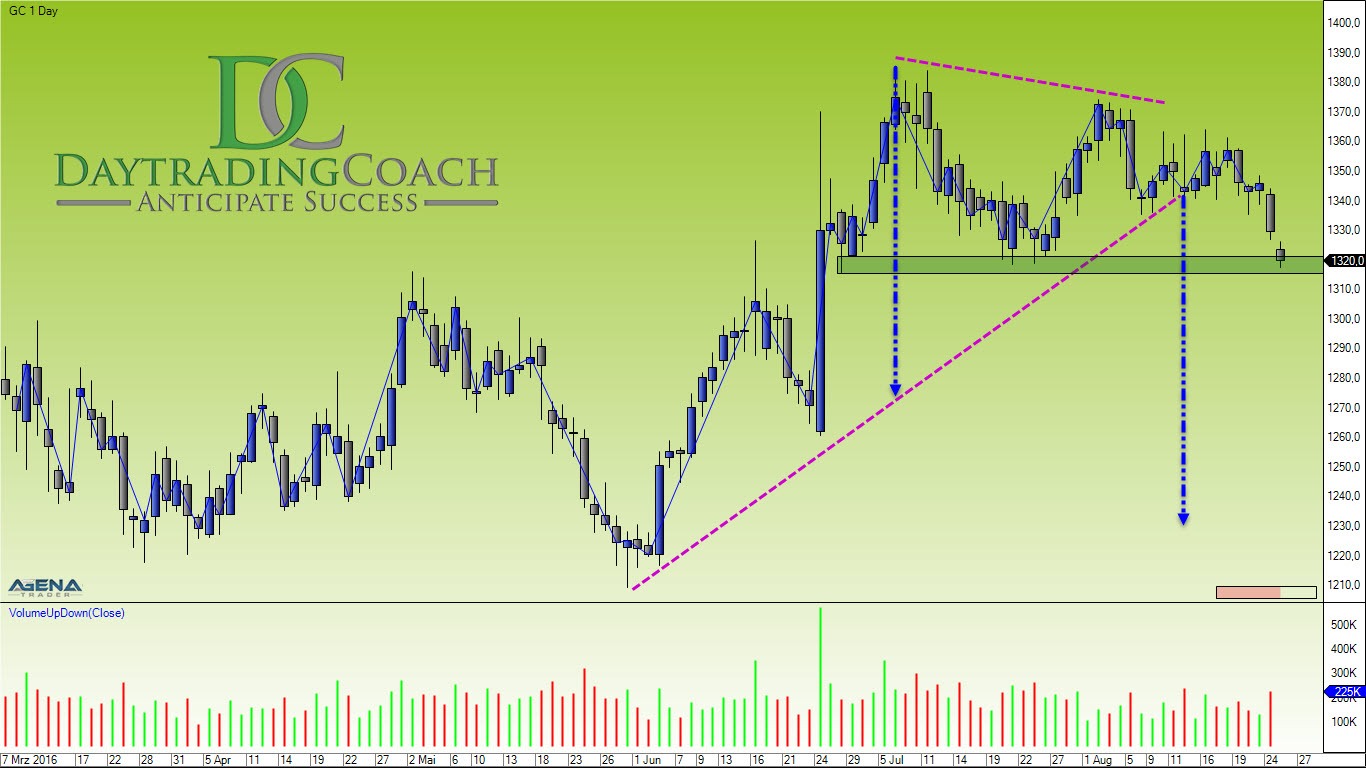
On the daily chart it is easily visible that by now, Gold has clearly broken out of the triangle and has set off with great momentum in the direction of 1320 dollars. A projection of the height of the triangle also brings us to a price target of 1230 dollars starting from the breakout.
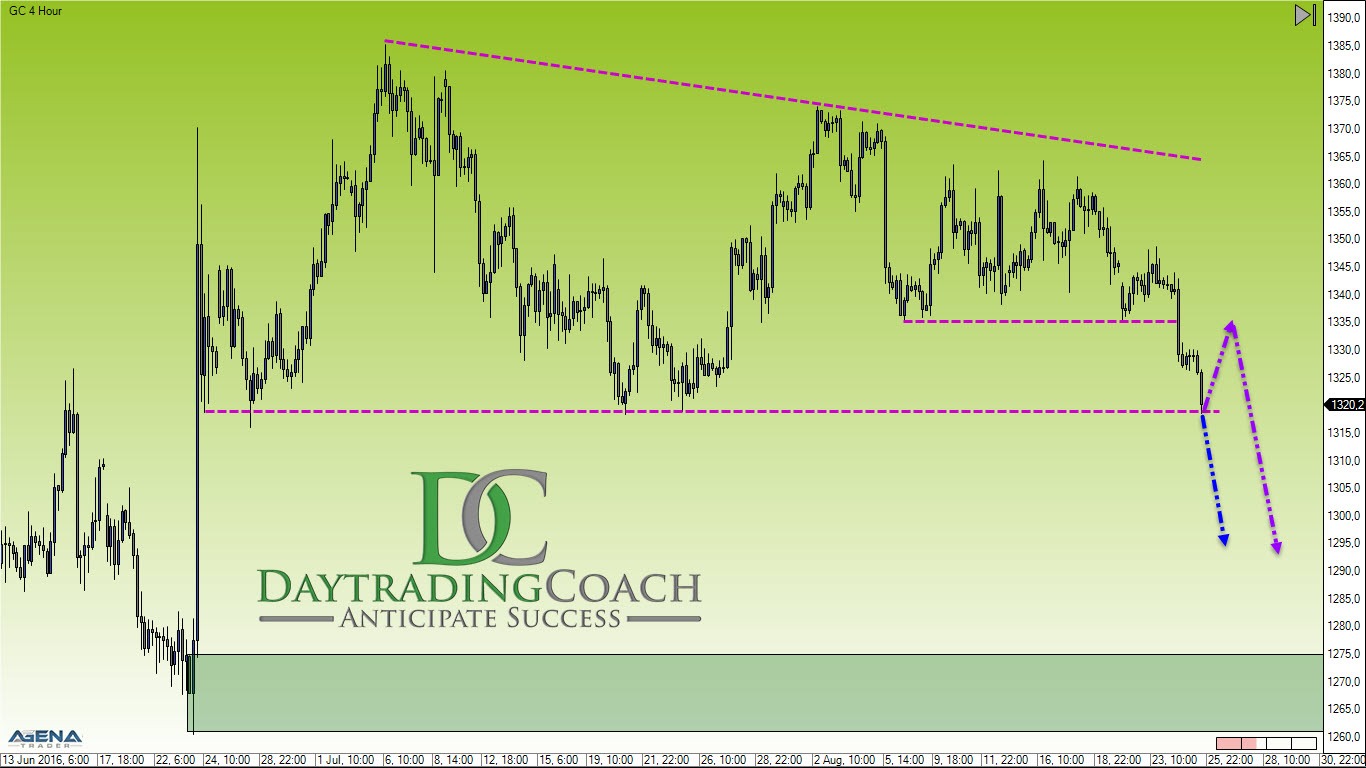
The 4-hour chart makes the picture even clearer, and rounds this analysis off nicely with several clean setups. If the 1320 sticks again, we can expect a setback in the area of 1335, before Gold can then set off for new lows. Here, a short entry with a stop at 1365 and a target at 1275 would be conceivable. This gives us a nice chance-risk ratio of 2:1. The 30-dollar risk is counteracted by a potential profit of 60 dollars.
A further possibility would be to directly trade the breakout under the 1320, with a stop in the area of 1331 and for about 20 dollars’ profit until the 1300.
So here we have two trading opportunities in Gold with good chance-risk ratios going in the same direction as the current advantage. This is exactly what we are looking for as traders…
For presentation purposes the trading software “AgenaTrader” has been used.
Recommended Content
Editors’ Picks
USD/JPY jumps above 156.00 on BoJ's steady policy

USD/JPY has come under intense buying pressure, surging past 156.00 after the Bank of Japan kept the key rate unchanged but tweaked its policy statement. The BoJ maintained its fiscal year 2024 and 2025 inflation forecast, disappointing the Japanese Yen buyers.
AUD/USD consolidates gains above 0.6500 after Australian PPI data

AUD/USD is consolidating gains above 0.6500 in Asian trading on Friday. The pair capitalizes on an annual increase in Australian PPI data. Meanwhile, a softer US Dollar and improving market mood also underpin the Aussie ahead of the US PCE inflation data.
Gold price keeps its range around $2,330, awaits US PCE data

Gold price is consolidating Thursday's rebound early Friday. Gold price jumped after US GDP figures for the first quarter of 2024 missed estimates, increasing speculation that the Fed could lower borrowing costs. Focus shifts to US PCE inflation on Friday.
Stripe looks to bring back crypto payments as stablecoin market cap hits all-time high

Stripe announced on Thursday that it would add support for USDC stablecoin, as the stablecoin market exploded in March, according to reports by Cryptocompare.
US economy: Slower growth with stronger inflation

The US Dollar strengthened, and stocks fell after statistical data from the US. The focus was on the preliminary estimate of GDP for the first quarter. Annualised quarterly growth came in at just 1.6%, down from the 2.5% and 3.4% previously forecast.