![]() Bruce Powers, CMT
Bruce Powers, CMT
Markets Today
- Long-term bullish setup
- Short-term bullish setup
- Bull trend continuation entry setting up for short-term
Low volatility leads to higher volatility
Since June, volatility in Ethereum (ETH/USD) has been declining with a potentially bullish multi-month symmetrical triangle consolidation pattern forming over that time. Keep in mind that low volatility leads to higher volatility.
The pattern seen on the daily chart can also be looked at as a bullish pennant trend continuation pattern on a weekly chart. Either way, since this classic consolidation pattern follows a greater than 6900% rally in 6 months, starting from the December 2016 low, the odds favor an eventual resolution to the upside. At the same time we always must be prepared for the opposite, a breakdown in this case.
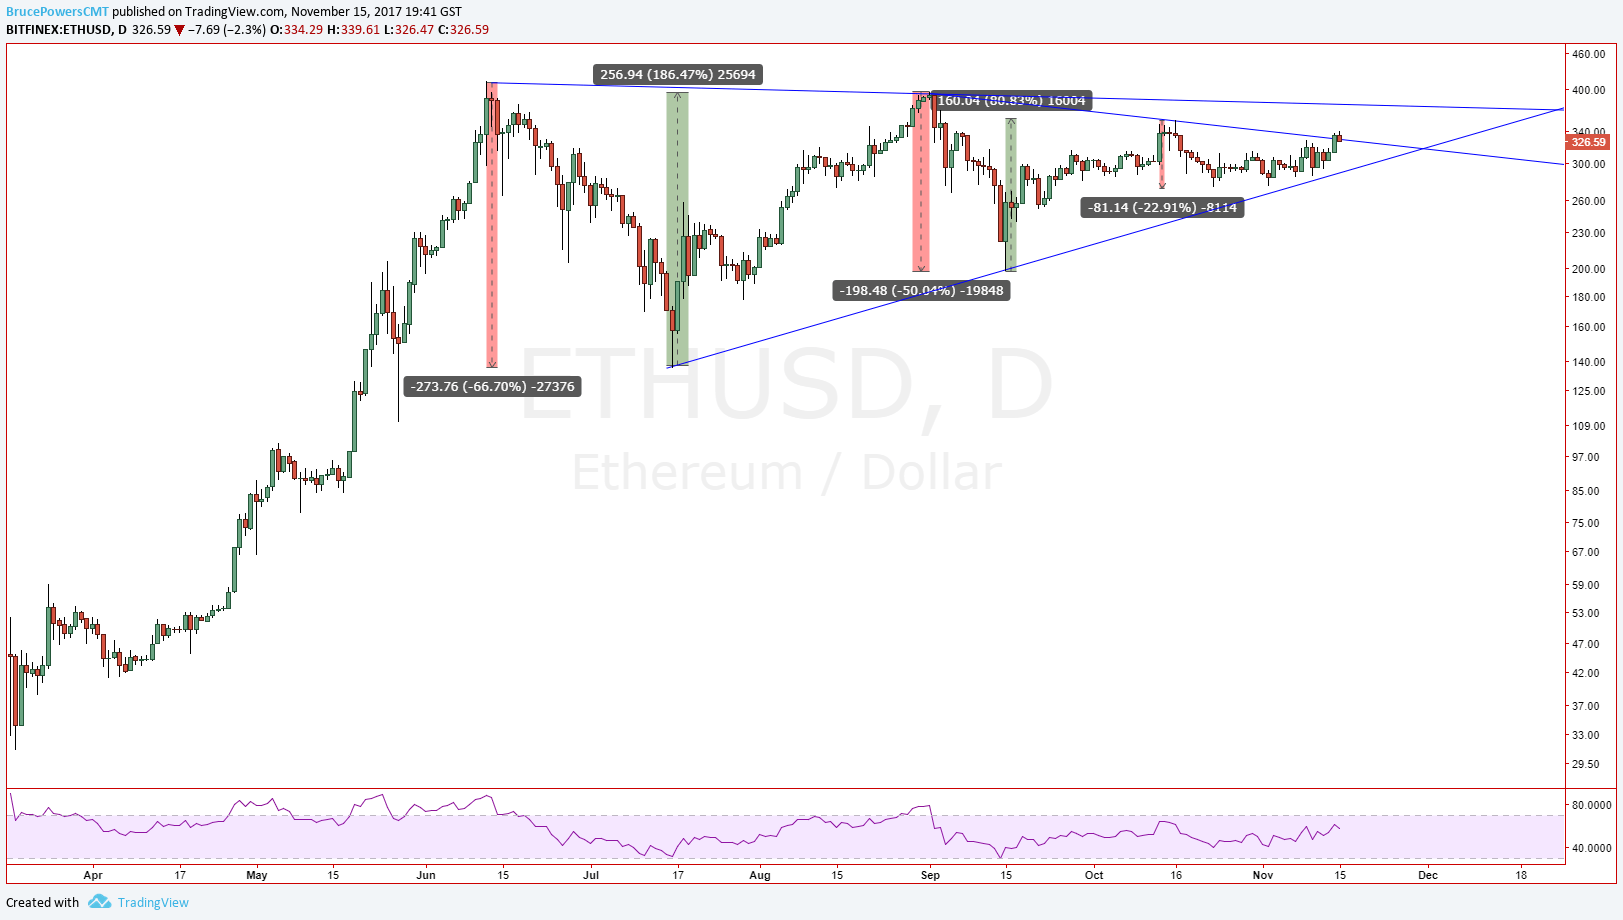
Ethereum is getting closer to the apex of the triangle and we can therefore anticipate that a breakout should occur within 2-3 weeks, if the triangle retains its integrity. After that the validity of the pattern becomes in doubt if a breakout has not yet occurred. Ideally, a breakout would occur this week or next, given where price is now relative to the apex.
Short-term outlook
Nevertheless, the above analysis is also important for the short-term outlook since ETH is inside a narrowing consolidation range and therefore follow-through is likely to continue to be diminished until a breakout of the larger pattern and therefore dominant pattern, occurs.

Since the triangle is an obvious pattern to anyone with basic technical analysis knowledge, we also need to anticipate the possibility of a sharp drop to the downside initially that can shake out weak holders before an upside breakout kicks in, if it is to do so. There’s no way to know if this type of price action will happen but we don’t want to be too surprised if it does.
Breakout potential
If ETH does breakdown then watch for potential entry points to take advantage of a subsequent potential rally back into the pattern in preparation of an upside breakout. Support of the pattern is currently identified with a prior swing low around 273.50. At that point ETH would be below the uptrend line.
This is an aggressive engagement technique and caution is advised as a drop below the trend line is generally considered to be bearish, and it might turn out that way. So, be clear on your trade plan and risk management strategy, and know what would need to happen for you to turn bearish instead.
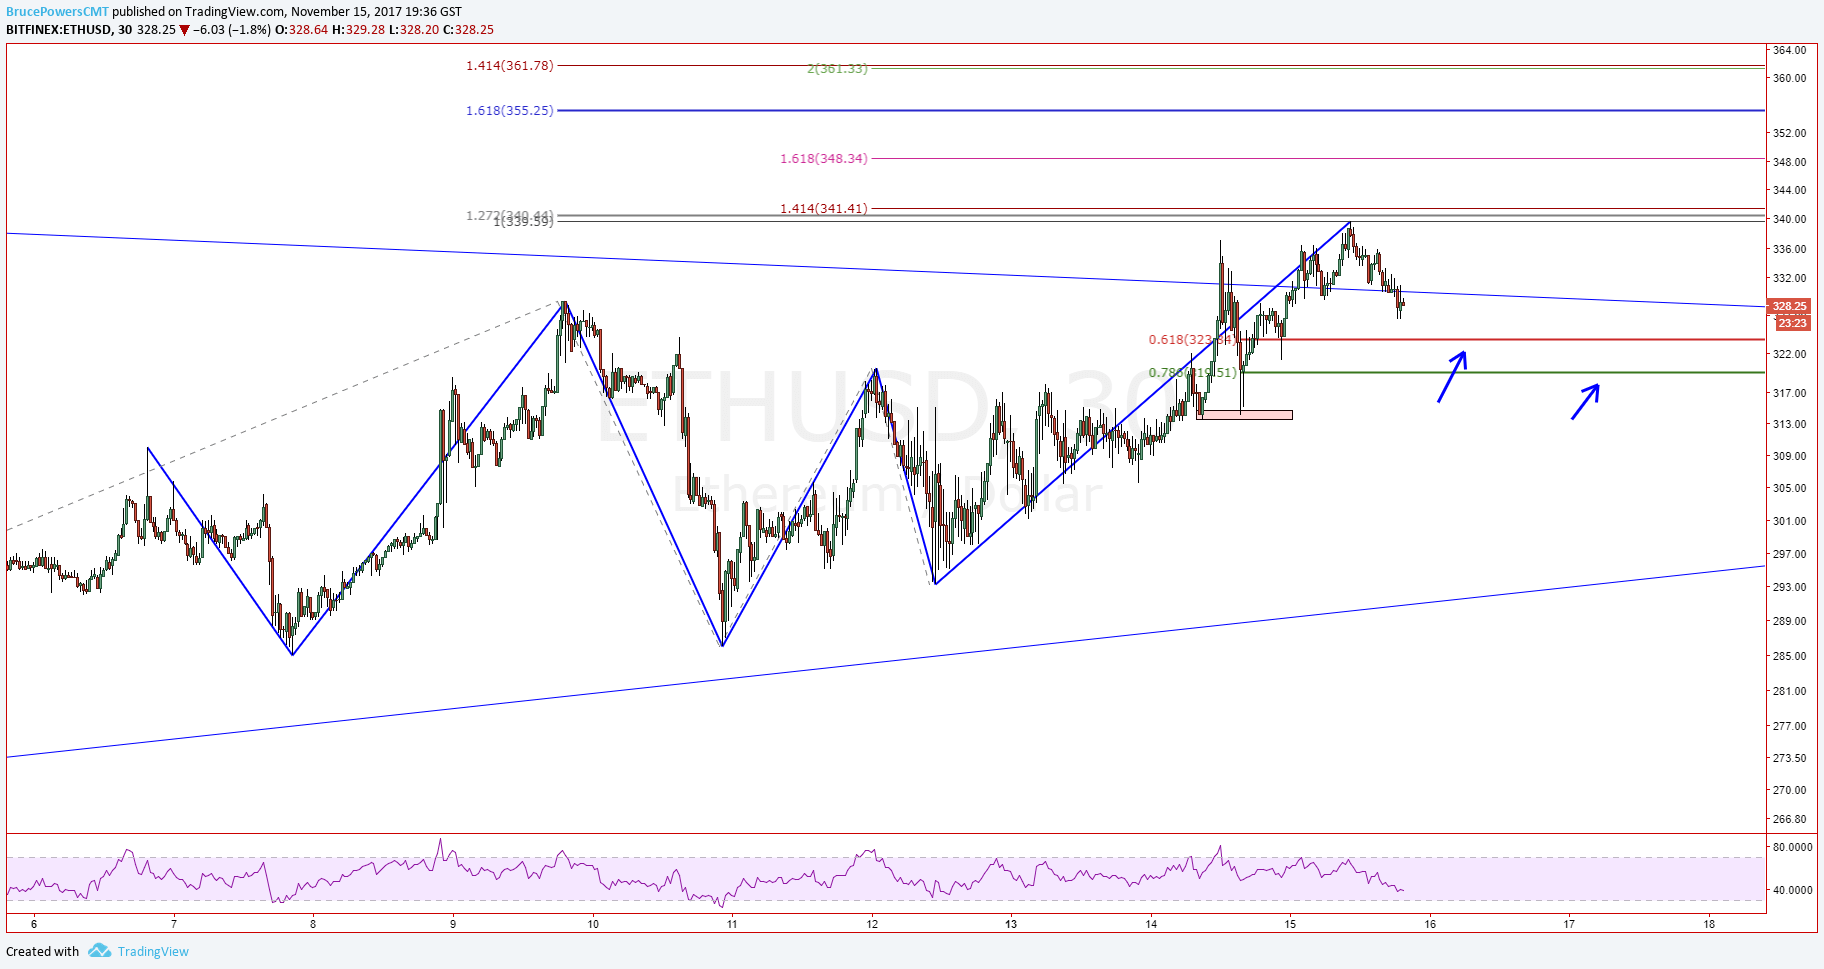
On the upside, the higher downtrend line (top line of triangle) gives us a potential target for a long position in the near-term. Note that in the enclosed 2-hour chart that ETH has already broken above the internal downtrend line (short-term bullish). In addition, the prior swing high of 328.8 has been exceeded thereby triggering a continuation of the uptrend on multiple time frames.
Even though the top of the triangle is up around roughly 375, there are other lower potential targets of resistance from Fibonacci ratio analysis. These can be seen on the enclosed intraday charts.
The views and opinions expressed here are solely those of the authors / contributors and do not necessarily reflect the views of Marketstoday.net. Neither Marketstoday.net nor any person acting on its behalf may be responsible for information contained herein. The content posted here may have been edited to conform to Marketstoday.net policies, terms and conditions. Any investment / trading related article, analysis or commentary are by no means a guarantee of present or future performance and should not be relied upon solely when buying or selling a financial instrument. Every investment no matter how appealing, involves risk and the investor should conduct their own research, consider personal risk tolerance, preference and needs when making an investment or trading decision.
Recommended Content
Editors’ Picks
USD/JPY holds above 155.50 ahead of BoJ policy announcement

USD/JPY is trading tightly above 155.50, off multi-year highs ahead of the BoJ policy announcement. The Yen draws support from higher Japanese bond yields even as the Tokyo CPI inflation cooled more than expected.
AUD/USD extends gains toward 0.6550 after Australian PPI data

AUD/USD is extending gains toward 0.6550 in Asian trading on Friday. The pair capitalizes on an annual increase in Australian PPI data. Meanwhile, a softer US Dollar and improving market mood also underpin the Aussie ahead of the US PCE inflation data.
Gold price keeps its range around $2,330, awaits US PCE data

Gold price is consolidating Thursday's rebound early Friday. Gold price jumped after US GDP figures for the first quarter of 2024 missed estimates, increasing speculation that the Fed could lower borrowing costs. Focus shifts to US PCE inflation on Friday.
Stripe looks to bring back crypto payments as stablecoin market cap hits all-time high

Stripe announced on Thursday that it would add support for USDC stablecoin, as the stablecoin market exploded in March, according to reports by Cryptocompare.
Bank of Japan expected to keep interest rates on hold after landmark hike

The Bank of Japan is set to leave its short-term rate target unchanged in the range between 0% and 0.1% on Friday, following the conclusion of its two-day monetary policy review meeting for April. The BoJ will announce its decision on Friday at around 3:00 GMT.