Dow Jones Forecast H2 2016: Is it different this time? Or will we have bearish divergence?

US stock markets are on the rampage, closing higher for fourth straight week on Friday. Dow Jones clocked a record high of 18,622 levels on July 20. The S&P closed at a new record level on July 22, with utilities leading all ten sectors in the green.
Before discussing the possible action over next five months, let us have a look at what happened in the first six months of this year.
January to mid-Feb sell-off – The year started on a weak note. China’s devaluation of Yuan once again rocked risk assets. In the background, oil sell-off was pushing equities lower as well. Dow dropped to 15,450 in January saw a modest recovery only to fall back to 15,503 levels in February, before resuming the uptrend.
Mid-Feb to mid-April – Oil rebound and sharp drop in the Fed rate hike bets ensured the index continued its march higher. Prices hit a high of 18,167 on April 20th.
Point to note here – oil recovery and dovish Fed ensured the risk sentiment decoupled from sharp rise in the Japanese Yen. (USD/JPY & Dow have been strongly correlated since late 2012).
April end to June end – Sideways action as oil rally ran out of steam, caution ahead of Brexit referendum forced investors to stay on the sidelines.
Minor drop at June end – Brexit vote victory caught markets off guard and pushed prices to a low of 17,063 (June 27 low). On the Brexit day, USD/JPY fell below 100.00 levels and thus forced Japanese government and Bank of Japan to talk about fiscal stimulus and monetary stimulus. This led to…
June end to July rally – The index rallied from June 27 low of 17,063 to 18,622 (July 20 high) on Japanese stimulus talk – inflation trade. On the wires people are talking about US data being strong and decreased prospects of Fed rate hike. However, markets never believed Fed would hike rates this year in the first place. In my opinion, the rally from June 27 low is more due to USD/JPY rise on stimulus talk.
Going forward, following things could influence Dow –
- Japanese stimulus
- Oil
- US elections
- Fed rate hike bets
- Situation in Europe
In short-term, Dow rally is at a risk of disappointment from Japan. If we assume, Japan does not announce fiscal and monetary stimulus package, the index could fall back to post Brexit low of 17,063 levels. The possible drop could be cushioned by oil (if it rallies).
Over the next four months – US elections would take center stage. As of now, it appears markets do not like Trump.
And finally Fed rate hike bets – Post Brexit vote, world has not come to an end. In fact, we have had positive data releases from China to US. China posted a steady Q2 GDP and sharp improvement in the monthly industrial production and retail sales number. (For now ignore the fact that China data cannot be trusted). US non-farm payrolls, advance retail sales and housing data have been strong. Markets across the globe quickly stabilized post Brexit vote. Consequently, December rate hike is back on the table.
However, elections could single handedly kill the probability of Fed rate hike. I have had a view since July 1st 2015 that Fed would be able to hike rates only once or twice before moving back to QE. The report titled - US QE 4 in mid/late 2016… after two symbolic rate hikes in 2015/early 2016 – published on July 1 could be found here.
I still believe there is just one rate hike in the pipeline that too if elections or oil doesn’t play a spoil sport. BOE has made its intentions clear that it stands to clear if things worsen in post Brexit environment and so has Draghi with respect to Italian banking sector. Hence, I am not so concerned about the situation Europe.
If developments surrounding US elections and results are well received a Fed rate hike could come through in December and that would be followed by a prolonged pause… may be a yearlong followed by easing. This also means Dow has little worry till December.
Bulls should keep a close eye on election related news flow as that could derail the rally in stocks. As per Bloomberg report, “If Trump wins the White House, numerous business and economic leaders predict the stock market and economy will tank.” Markets hate uncertainty and that is what Trump seems to have brought to the table till now. If signs of Trump gathering pace hit the wires, risk sentiment could take a hit.
As of now, Wall Street thinks it's highly unlikely that Trump will be the next president of the United States. Clinton has a solid lead in all major forecasts. In CNN's latest poll of polls, Clinton gets 45% of the vote versus Trump's 40%.
To conclude – A mix of Clinton lead in polls + range bound or rallying oil prices ad absence of remote risks like banking crisis in Europe could keep the Dow happy. Note the corporate results could see an improvement in Q3, especially in the oil sector given the oil prices have rallied.
On the other hand, trump lead could single handedly derail the rally. Oil price slide would only add fuel to the fire. On similar lines remote risks mentioned above could hurt global market sentiment as well.
Technicals – watch for bearish divergence; jot down 23.6% and 38.2% Fibo levels
With index at record highs, the only think charts could do is suggest reversal via bearish candle stick formations and/or bearish price RSI divergence. As long as bearish formations do not occur, there is little reason to expect a sell-off although overbought indicators could surely result in a technical pull back.
Daily chart
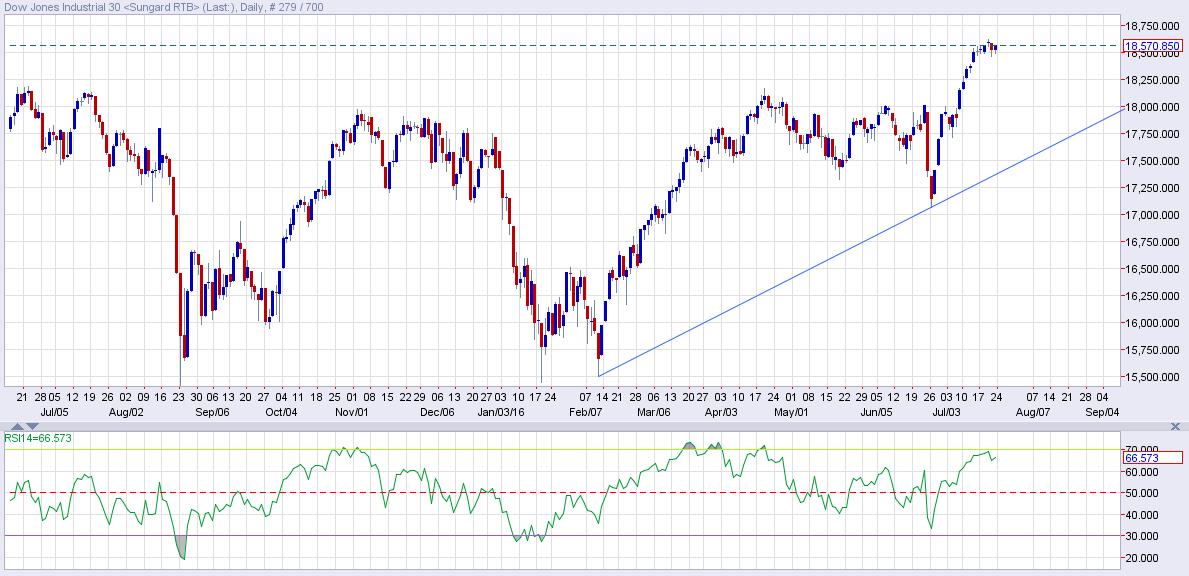
As of now there is sign of bearish RSI divergence. In fact, RSI is till few points away from overbought region. A first sign that a top has been made could be a breach of rising trend line drawn from Feb low – June 27 low.
Tale of two Fibo levels – 38.2% and 23.6%
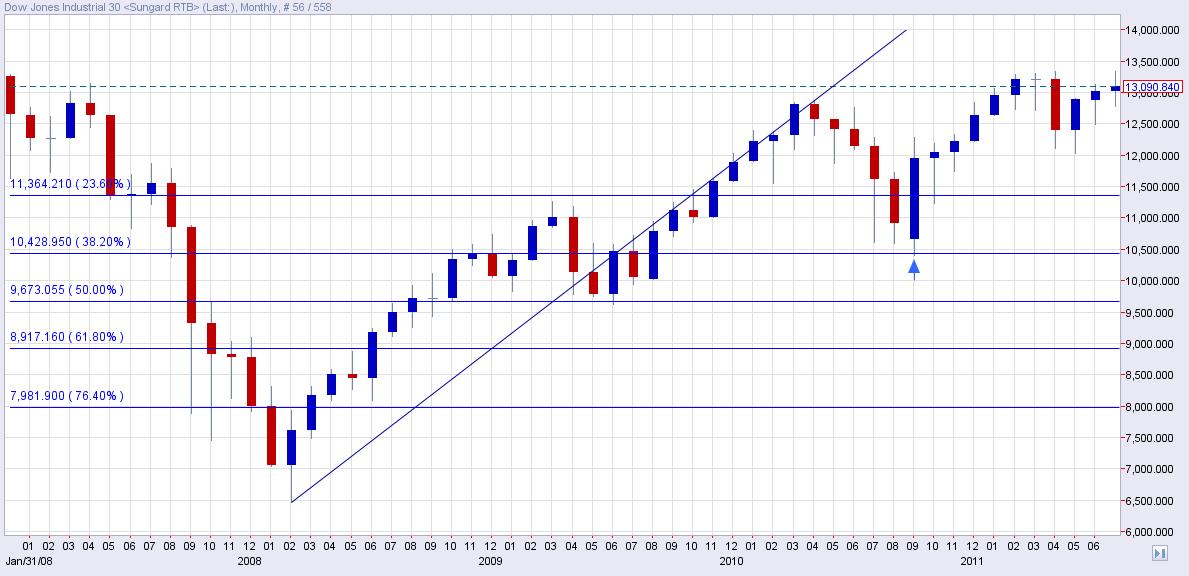
Since bottoming out in 2009, every major correction ran out of steam at 38.2% Fibo and was followed by fresh record highs.
Dow 2009-2011 rally – prices rebounded from 38.2% of 10,428.95 and rallied to record highs.
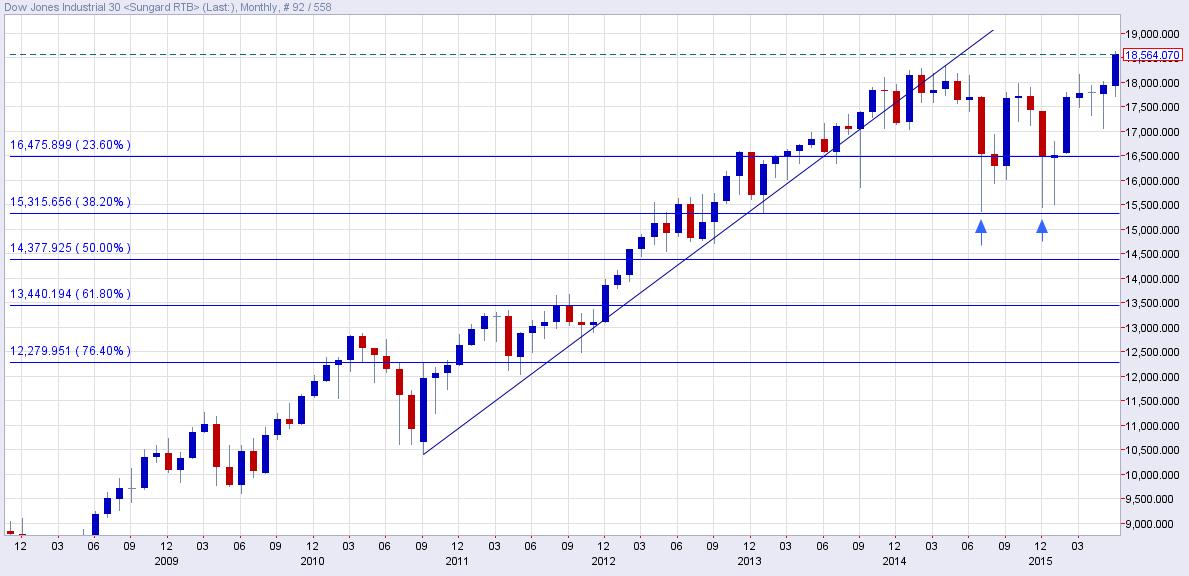
Oct 2011 – 2015 rally – once again a drop to 38.2% lower (in Aug 2015, Jan 2016) followed by a rise to record highs.
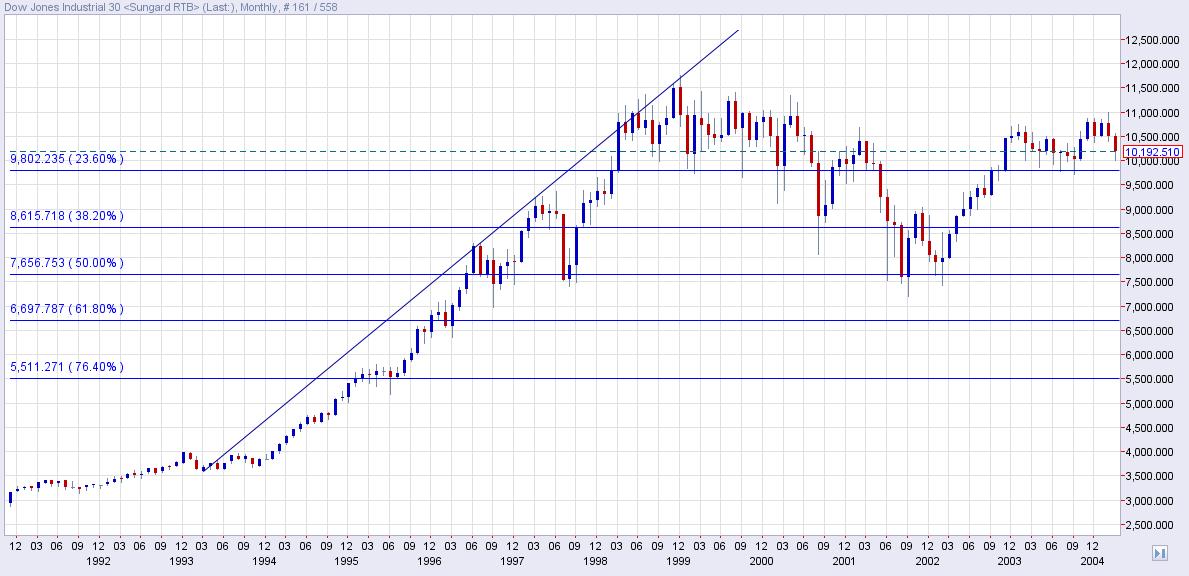
If we look at the Dow rally from 1994-2000, the action witnessed then around the top appears remarkably similar to the one seen today.
1994-2000
2009-2015
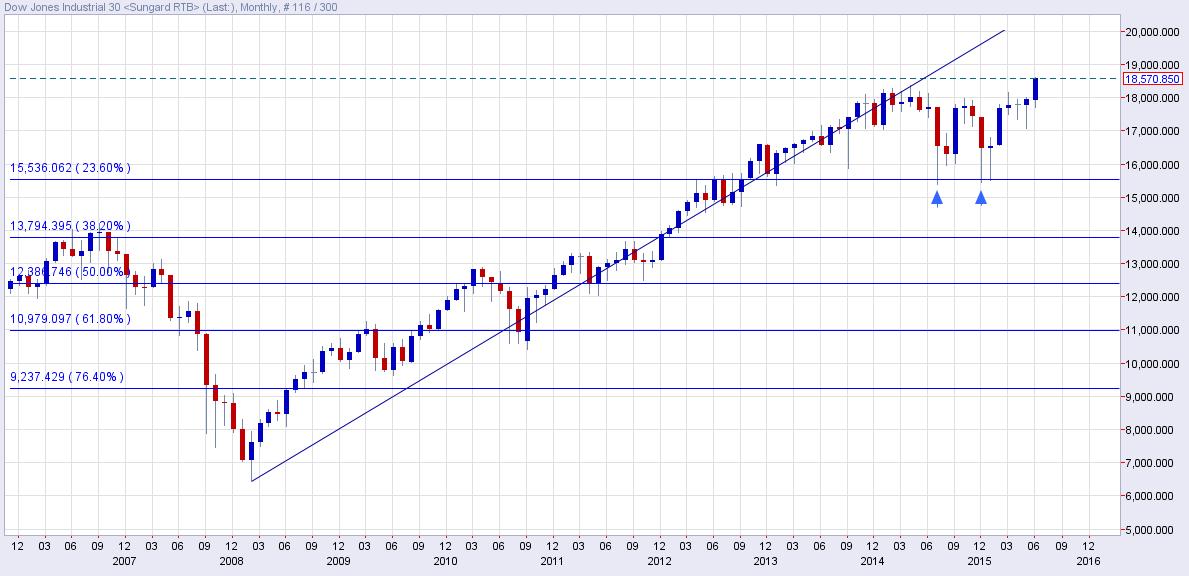
- Multiple attempts to take out 23.6% Fibo followed by an eventual break lower, formation of lower highs and a drop to 50% Fibo.
- In the current rally – 2009-2015 – we have seen multiple attempts to take out 23.6% Fibo, but prices are breaking on the higher side. The monthly closing isn’t confirmed yet, but if it is above 18,351 (May 2015 high), the odds of the index repeating the action seen on 1994-2000 chart would drop.
If we go back further, the Dot com bubble took the index down to 50% of the rally from 1994 to 2000. The crash of 1987 also took the index down to 50% retracement of the rally from 1982-1987.
What this means is if things get bad as discussed above and a sell-off happens –
- Traders could be sure that a drop to 23.6% would be followed by a further slide to 38.2%.
- Bears should remain cautious once the index tests 38.2% Fibo.
- And should be extremely cautious between 38.2% Fibo to 50% Fibo.
On the higher side, sky is the limit. As said earlier, bulls need to watch out for bearish price-RSI divergence on 4-hour, then daily, and then weekly chart.
Meanwhile, bears should watch out for a rebound from 38.2% Fibo. Retracements drawn from 2009 low – last week’s high show 38.2% Fibo at 13,979 – which almost coincides with 2007 high.
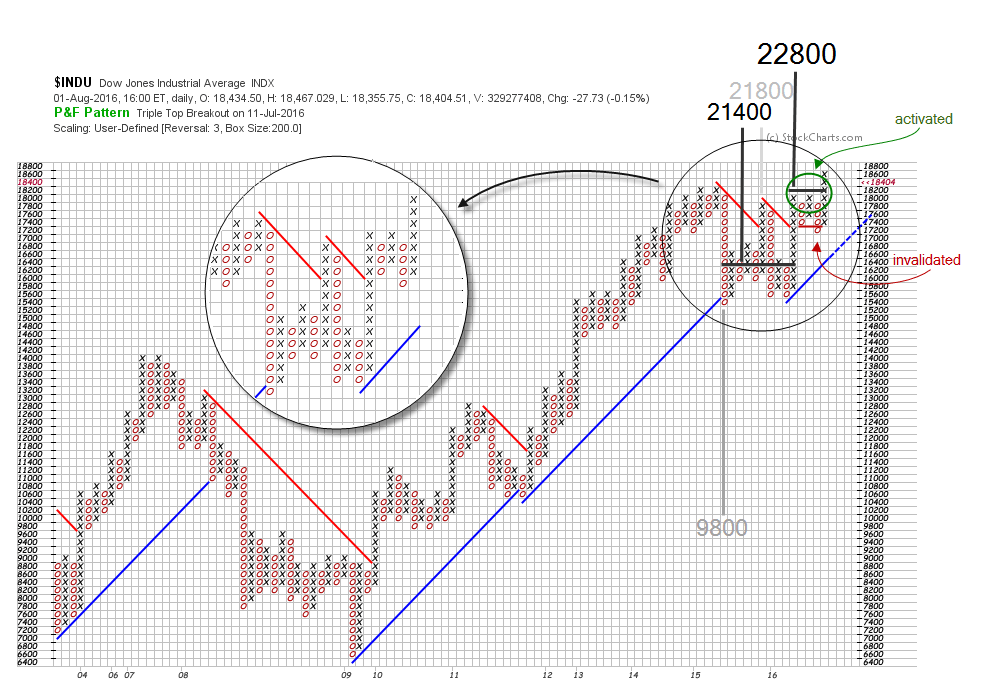
Dow Jones Point & Figure Analysis, by Gonçalo Moreira
Author

Omkar Godbole
FXStreet Contributor
Omkar Godbole, editor and analyst, joined FXStreet after four years as a research analyst at several Indian brokerage companies.


