The Bank of Japan announced this exact thing the past week and this is the present we currently live in and is likely to be the case for the foreseeable future. This should see the USDJPY now trade higher.
Let’s analyse the daily chart and then look at the quarterly chart to get an idea of when this crazy period might conclude.
USDJPY DAILY CHART
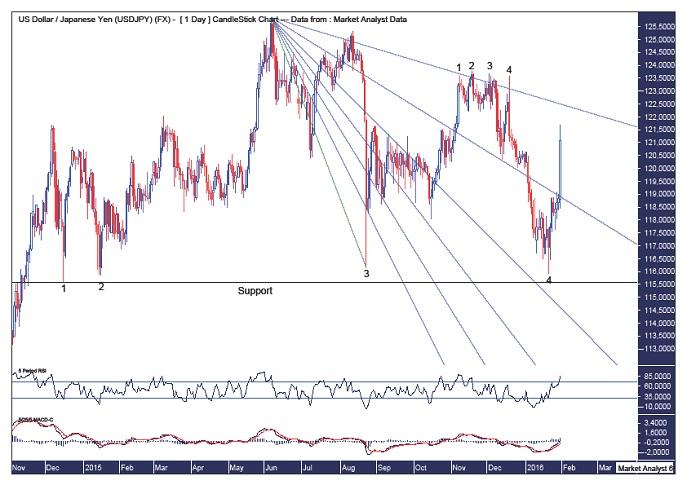
Previous analysis outlined a bearish quadruple top and this did indeed see price move down strongly. The move was stopped at strong support and set up an even more bullish quadruple bottom as this bottom has taken much more time to form. This should see a much more explosive move higher and the BOJ announcement has just confirmed this.
The horizontal line denotes support from the first low in the quadruple bottom and stands at 115.56. I doubt we will see price trade below that level for quite some time now.
The Fibonacci Fan shows price busting below the 76.4% angle after the quadruple top and price has now busted back above with the 88.6% angle the next resistance.
Price cracking above the quadruple top level at 123.75 will give much confidence that the long side is the place to be.
The RSI is in overbought territory and I expect some short term consolidation to occur in the very near future.
The MACD indicator is bullish.
Let’s now turn to the quarterly chart and see just where price may be headed over the next year or so.
USDJPY QUARTERLY CHART
Normal 0 false false false EN-IN X-NONE X-NONE
/* Style Definitions */ table.MsoNormalTable {mso-style-name:"Table Normal"; mso-tstyle-rowband-size:0; mso-tstyle-colband-size:0; mso-style-noshow:yes; mso-style-priority:99; mso-style-qformat:yes; mso-style-parent:""; mso-padding-alt:0cm 5.4pt 0cm 5.4pt; mso-para-margin-top:0cm; mso-para-margin-right:0cm; mso-para-margin-bottom:10.0pt; mso-para-margin-left:0cm; line-height:115%; mso-pagination:widow-orphan; font-size:11.0pt; font-family:"Calibri","sans-serif"; mso-ascii-font-family:Calibri; mso-ascii-theme-font:minor-latin; mso-fareast-font-family:"Times New Roman"; mso-fareast-theme-font:minor-fareast; mso-hansi-font-family:Calibri; mso-hansi-theme-font:minor-latin; mso-bidi-font-family:"Times New Roman"; mso-bidi-theme-font:minor-bidi;}
Normal 0 false false false EN-IN X-NONE X-NONE
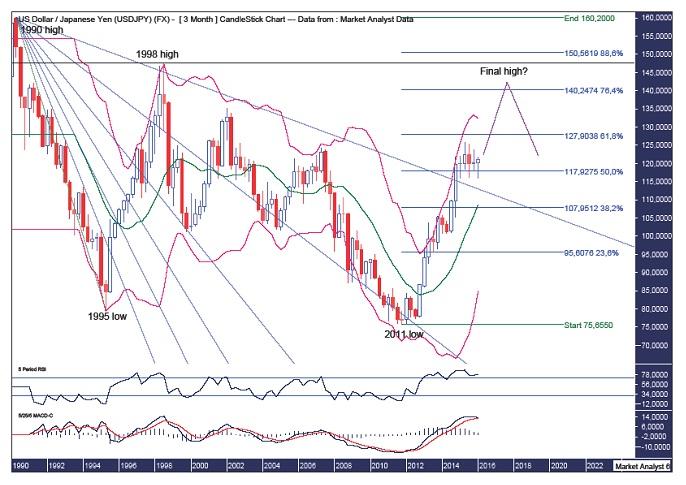
I have drawn a Fibonacci Fan from the 1990 high to 1995 low which has shown some very nice symmetry with price. The 1995 high was at resistance from the 88.6% angle and the subsequent move down found support at the 61.8% angle. Price then traded down into a low in 2011 which was at support from the 76.4% angle.
Since the 2011 low, price has exploded higher and recent busted above the 88.6% angle which was a bullish sign. There has been some consolidation and I though price may even get back down to test support from the 88.6% angle but that looks to be it and it appears price is now headed higher.
The Bollinger Bands show price has left the upper band but doesn’t look to be threatening the middle band. On the contrary, I now expect price to surge higher back up to the upper band and extend higher.
I have added Fibonacci retracement levels of the move down from the 1990 high to 2011 low. I favour price testing the 76.4% level at 140.24 and perhaps a touch higher as it tests the 1998 high which stands at 147.62 and is denoted by the horizontal line. Price turning back down there would set up a massively bearish double top.
The RSI recently made a new high and I would like to see a bearish divergence form at the final high.
The MACD indicator shows the averages coming back together but it remains bullish and I expect it to inch higher in bullish formation for several more quarters yet.
Summing up, the pullback in the USDJPY now appears over with the bull trend back in play.
Bio
Austin Galt is The Voodoo Analyst. I have studied charts for over 20 years and am currently a private trader. Several years ago I worked as a licensed advisor with a well known Australian stock broker. While there was an abundance of fundamental analysts, there seemed to be a dearth of technical analysts. My aim here is to provide my view of technical analysis that is both intriguing and misunderstood by many. I like to refer to it as the black magic of stock market analysis.
The above is a matter of opinion provided for general information purposes only and is not intended as investment advice. Information and analysis above are derived from sources and utilising methods believed to be reliable, but we cannot accept responsibility for any losses you may incur as a result of this analysis. Individuals should consult with their personal financial advisors. Put simply, it is JUST MY OPINION.
Recommended Content
Editors’ Picks

EUR/USD advances toward 1.1200 on renewed US Dollar weakness
EUR/USD is extending gains toward 1.1200 on Friday, finding fresh demand near 1.1150. Risk sentiment improves and weighs on the US Dollar, allowing the pair to regain traction. The Greenback also reels from the pain of the dovish Fed outlook, with Fedspeak back on tap.

Gold hits new highs on expectations of global cuts to interest rates
Gold (XAU/USD) breaks to a new record high near $2,610 on Friday on heightened expectations that global central banks will follow the Federal Reserve (Fed) in easing policy and slashing interest rates.

USD/JPY recovers to 143.00 area during BoJ Governor Ueda's presser
USD/JPY stages a recovery toward 143.00 in the European morning following the initial pullback seen after the BoJ's decision to maintain status quo. In the post-meeting press conference, Governor Ueda reiterated that they will adjust the degree of easing if needed.

Shiba Inu is poised for a rally as price action and on-chain metrics signal bullish momentum
Shiba Inu remains strong on Friday after breaking above a symmetrical triangle pattern on Thursday. This breakout signals bullish momentum, further bolstered by a rise in daily new transactions that suggests a potential rally in the coming days.

Bank of Japan set to keep rates on hold after July’s hike shocked markets
The Bank of Japan is expected to keep its short-term interest rate target between 0.15% and 0.25% on Friday, following the conclusion of its two-day monetary policy review. The decision is set to be announced during the early Asian session.

Moneta Markets review 2024: All you need to know
VERIFIED In this review, the FXStreet team provides an independent and thorough analysis based on direct testing and real experiences with Moneta Markets – an excellent broker for novice to intermediate forex traders who want to broaden their knowledge base.

