![]()
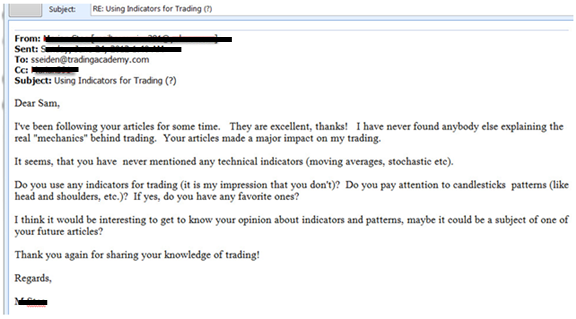
I received an email a while back with a question regarding my opinion of indicators and chart patterns. I began to reply to the email and then stopped. I thought, if this reader has this question perhaps others do as well. Given that many short term traders lose money and that most long term investors never come close to achieving their long term financial goals, I felt it was my responsibility to give my honest opinion of conventional chart patters and indicators from the world of technical analysis.
Let me first take you back to when I first learned how trading markets worked and how money is really made and lost in the markets; in short, how to properly speculate in markets. Starting on the floor of the Chicago Mercantile Exchange (CME), I was responsible for facilitating institutional order flow. Each morning I would take buy and sell orders from banks, institutions, money managers, hedge funds and some retail traders. I would have huge buy (demand) and sell (supply) orders in front of me all day. Each day price would move from demand to supply and back again… Anyone who made money would be either buying where demand exceeded supply for a long position or selling short at price levels where supply exceeded demand. In other words, anyone I saw who made money trading and investing would be buying at wholesale prices and selling at retail prices, period.
Fast forward to today, nothing has changed, this is and will always be how you make money buying and selling anything. This picture of bank and institution demand and supply is exactly what we teach our students to see on price charts so they can buy at wholesale prices and sell at retail prices. Anyway, this is how I learned to trade and this is exactly what my brain is focused on, really buying low and really selling high.
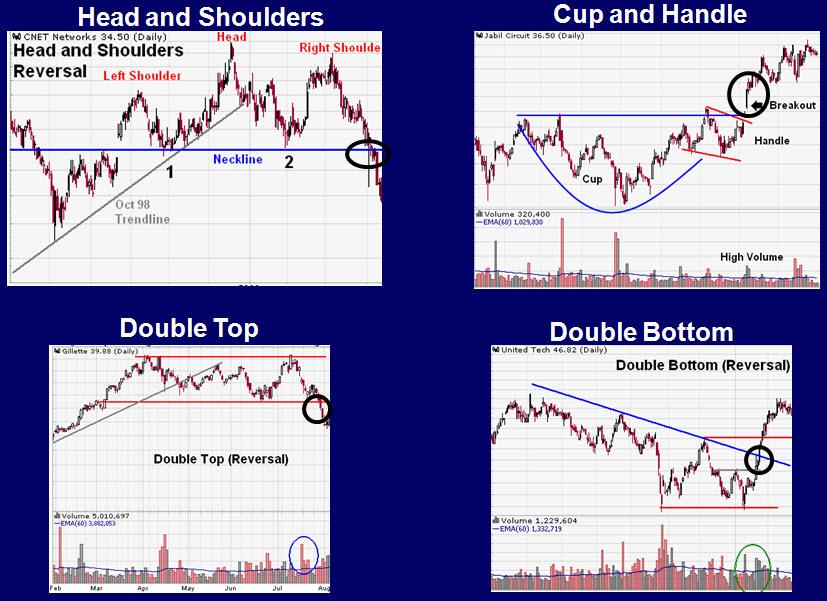
Months into my career at the CME, I was walking to lunch with a friend of mine from the trading floor. He said, “The markets are going to go higher tomorrow.” I said, “Oh, how do you know that?” He replied that the Stochastics were doing this and the MACD was doing that and so on. We were on our way to lunch so when he said MACD, my first thought was McDonalds because I was hungry. I stopped him mid-sentence and told him I didn’t understand what he was talking about. I had never heard of any of that stuff. He said, “Technical Analysis.” I said, “What’s that?”… He explained a bit but I didn’t understand and I was more focused on getting lunch… A few days later he took me into the CME library and showed me a technical analysis book. I flipped though it for the first time and my first thought was how ridiculous the information was. I looked at him and asked, “Who would use these strategies?” My friend said, “Everyone…” To illustrate why I thought that way, take a look at the chart patterns below that are in just about every trading book ever written: the Head and Shoulders, Cup and Handle, Double Top, and Double Bottom. There are many more but I thought I would share the most popular ones in the history of conventional technical analysis.
When you look at all these, notice the circled areas. The circles represent where the entry points are for these patterns. The big question is this, what do they all have in common? Notice they all have you buying AFTER a big rally in price and selling AFTER a big decline in price! In my world and the world of anyone I knew that made money trading, we did exactly the opposite. To me, all the information in the book was a recipe for losses, not gains. Why in the world would you wait for price to rally that much before buying or wait for such a big decline (or any decline at all) before selling? This made absolutely no sense to me. I was conditioned to do the opposite.
During the years that followed, I really began to understand why most active retail traders lose money and why most long term investors never achieve their financial goals. It’s because they are taught completely backwards. In fact, everything in the book my friend showed me had you buying after a rally in price and selling after a decline in price. You would never take that novice action when buying and selling anything else in life and profits and the financial markets are no different. Do you think Goldman Sachs sits around looking for Head and Shoulder patterns? Do you think they make their billions in profits waiting for price to rally and form a Cup and Handle before buying? They laugh at conventional trading books.
The key is to both think like a bank or financial institution and act like one when trading and investing. To make an already long story short, I don’t use indicators and oscillators in my trading and we don’t focus on them at Online Trading Academy. They lag price, which means that if we add anything to our decision making process that lags price we are only increasing risk and decreasing profit.
Editors’ Picks

EUR/USD stays below 1.1850 after dismal German sentiment data
EUR/USD stays in negative territory below 1.1850 in the second half of the day on Tuesday. Renewed US Dollar strength, combined with a softer risk tone keep the pair undermined alongside downbeat German ZEW sentiment readings for February.

GBP/USD falls toward 1.3550, pressured by weak UK jobs report
GBP/USD remains under bearish pressure and extends its decline below 1.3600 on Tuesday. The United Kingdom employment data suggested worsening labor market conditions, bolstering bets for a BoE interest rate cut next month and making it difficult for Pound Sterling to stay resilient against its peers.

Gold pares intraday losses; keeps the red above $4,900 amid receding safe-haven demand
Gold (XAU/USD) attracts some follow-through selling for the second straight day and dives to over a one-week low, around the $4,858 area, heading into the European session on Tuesday.

Canada CPI expected to show sticky inflation in January, still above BoC’s target
Economists see the headline CPI rising by 2.4% in a year to January, still above the BoC’s target and matching December’s increase. On a monthly basis, prices are expected to rise by 0.1%.

UK jobs market weakens, bolstering rate cut hopes
In the UK, the latest jobs report made for difficult reading. Nonetheless, this represents yet another reminder for the Bank of England that they need to act swiftly given the collapse in inflation expected over the coming months.
RECOMMENDED LESSONS
Making money in forex is easy if you know how the bankers trade!
I’m often mystified in my educational forex articles why so many traders struggle to make consistent money out of forex trading. The answer has more to do with what they don’t know than what they do know. After working in investment banks for 20 years many of which were as a Chief trader its second knowledge how to extract cash out of the market.
5 Forex News Events You Need To Know
In the fast moving world of currency markets where huge moves can seemingly come from nowhere, it is extremely important for new traders to learn about the various economic indicators and forex news events and releases that shape the markets. Indeed, quickly getting a handle on which data to look out for, what it means, and how to trade it can see new traders quickly become far more profitable and sets up the road to long term success.
Top 10 Chart Patterns Every Trader Should Know
Chart patterns are one of the most effective trading tools for a trader. They are pure price-action, and form on the basis of underlying buying and selling pressure. Chart patterns have a proven track-record, and traders use them to identify continuation or reversal signals, to open positions and identify price targets.
7 Ways to Avoid Forex Scams
The forex industry is recently seeing more and more scams. Here are 7 ways to avoid losing your money in such scams: Forex scams are becoming frequent. Michael Greenberg reports on luxurious expenses, including a submarine bought from the money taken from forex traders. Here’s another report of a forex fraud. So, how can we avoid falling in such forex scams?
What Are the 10 Fatal Mistakes Traders Make
Trading is exciting. Trading is hard. Trading is extremely hard. Some say that it takes more than 10,000 hours to master. Others believe that trading is the way to quick riches. They might be both wrong. What is important to know that no matter how experienced you are, mistakes will be part of the trading process.
The challenge: Timing the market and trader psychology
Successful trading often comes down to timing – entering and exiting trades at the right moments. Yet timing the market is notoriously difficult, largely because human psychology can derail even the best plans. Two powerful emotions in particular – fear and greed – tend to drive trading decisions off course.
