![]()
One thing that has puzzled me over the years when reading what trading books have to offer, books on candlesticks, trading education on the internet, and trading education anywhere for that matter is the main focus of the education. Always, the focus is on the chart and volume. There are books written solely about candlesticks and others that deal only with volume because conventional wisdom says those two contain the most important pieces of the trading decision making process. If we step backwards for a moment and ask ourselves the basic question of how and why prices turn and move in markets, I think you will find that conventional focus is way off.
The goal is to have a rule based strategy that helps you determine where price will turn and where price will move to with a very high degree of accuracy. So, what is the governing dynamic behind price turns and moves? Simple, price turns (changes direction) at levels where supply and demand are out of balance. It will then move until it reaches a price level where there is another significant supply and demand imbalance. So, what does a supply and demand imbalance that causes price to turn look like on a price chart? To answer this question, many would quickly start talking about candlestick patterns and formations and also include volume. Most people suggest you should focus on price levels where there was a turn in the past and to watch for heavy volume, above average volume. This is where the focus gets off track in my opinion. Think about it, at price levels where supply and demand are most out of balance which creates the highest probability turn, is there going to be lots of trading activity or very little? Like anything in life, the more unbalanced an equation or two competing forces are, the quicker and more predictable the outcome is. In a market, the more out of balance supply and demand is at a price level, the less the trading activity will be. What this picture will look like on a price chart is not heavy trading activity and above average volume like all the trading education promotes, it’s actually the opposite.
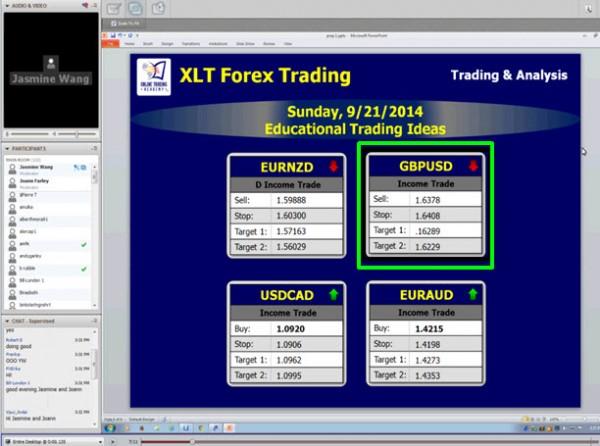
To illustrate what I am talking about, let’s look at a trading idea that was given to our students inside our live trading rooms, the XLT (Extended Learning Track). This was from September 21st, last week in our live Forex trading room. Each session begins with the information you see below in the screenshot of the live session. We give students trading ideas based on our core supply and demand strategy. We give them the entry, protective stop, and profit target at the beginning of the sessions. The trade setup here was to sell short the GBPUSD at supply for a move lower.
GBPUSD – The Live Setup (9.21.2014)
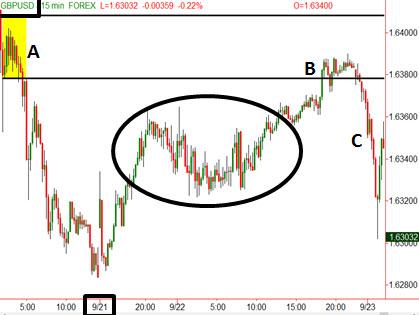
The chart below is the result which worked out well. “A” represents supply (banks selling) as we have a “Rally – Base – Drop” which shows supply exceeds demand. “B” is the time to sell short as you are selling to a buyer who is paying retail prices, just before price is most likely to decline. “C” is the profitable price decline for those who took the trade during that live trading session. However, notice the circled area on the chart which is the focus of this piece. Conventional Technical Analysis would suggest you should not sell short at “B” because there is so much trading activity below which will make a price decline challenging. Many traders would look at all that trading activity in the circled area and not sell short at “B” because they would not think price could fall through that area. Again, to me, the focus and understanding is way off. The fact that there was so much trading activity in that circled area tells me price is very likely to fall through that level and should do so with ease. If supply and demand were really that much out of balance in that area, you would not have so much trading activity. Price proceeded to fall through that area after “B” which was expected if your focused on the right logic. In summary, the major price turns in a market don’t typically happen at price levels where there is lots of trading activity, it’s the opposite. When looking for this on a price chart, don’t focus on levels surrounded by lots of pretty candles. The focus should be on price action mainly surrounded by white space.
GBPUSD – The Result
So why has this puzzled me for so long? Because when you break a solution to a challenge down logically, the answer is typically so simple, Occam’s Razor. My experience on a trading floor years ago dealing with order flow from banks, institutions, money managers, and so on made this basic concept I am writing about today very clear for me. All I did was train my eye to see this on a price chart which now allows me to share the information with you.
Hope this was helpful, have a great day.
Note: All information on this page is subject to change. The use of this website constitutes acceptance of our user agreement. Please read our privacy policy and legal disclaimer. Opinions expressed at FXstreet.com are those of the individual authors and do not necessarily represent the opinion of FXstreet.com or its management. Risk Disclosure: Trading foreign exchange on margin carries a high level of risk, and may not be suitable for all investors. The high degree of leverage can work against you as well as for you. Before deciding to invest in foreign exchange you should carefully consider your investment objectives, level of experience, and risk appetite. The possibility exists that you could sustain a loss of some or all of your initial investment and therefore you should not invest money that you cannot afford to lose. You should be aware of all the risks associated with foreign exchange trading, and seek advice from an independent financial advisor if you have any doubts.
Editors’ Picks

EUR/USD consolidates weekly gains above 1.1150
EUR/USD moves up and down in a narrow channel slightly above 1.1150 on Friday. In the absence of high-tier macroeconomic data releases, comments from central bank officials and the risk mood could drive the pair's action heading into the weekend.

GBP/USD stabilizes near 1.3300, looks to post strong weekly gains
GBP/USD trades modestly higher on the day near 1.3300, supported by the upbeat UK Retail Sales data for August. The pair remains on track to end the week, which featured Fed and BoE policy decisions, with strong gains.

Gold extends rally to new record-high above $2,610
Gold (XAU/USD) preserves its bullish momentum and trades at a new all-time high above $2,610 on Friday. Heightened expectations that global central banks will follow the Fed in easing policy and slashing rates lift XAU/USD.

Week ahead – SNB to cut again, RBA to stand pat, PCE inflation also on tap
SNB is expected to ease for third time; might cut by 50bps. RBA to hold rates but could turn less hawkish as CPI falls. After inaugural Fed cut, attention turns to PCE inflation.

Bank of Japan set to keep rates on hold after July’s hike shocked markets
The Bank of Japan is expected to keep its short-term interest rate target between 0.15% and 0.25% on Friday, following the conclusion of its two-day monetary policy review. The decision is set to be announced during the early Asian session.
RECOMMENDED LESSONS
Making money in forex is easy if you know how the bankers trade!
Discover how to make money in forex is easy if you know how the bankers trade!
5 Forex News Events You Need To Know
In the fast moving world of currency markets, it is extremely important for new traders to know the list of important forex news...
Top 10 Chart Patterns Every Trader Should Know
Chart patterns are one of the most effective trading tools for a trader. They are pure price-action, and form on the basis of underlying buying and...
7 Ways to Avoid Forex Scams
The forex industry is recently seeing more and more scams. Here are 7 ways to avoid losing your money in such scams: Forex scams are becoming frequent. Michael Greenberg reports on luxurious expenses, including a submarine bought from the money taken from forex traders. Here’s another report of a forex fraud. So, how can we avoid falling in such forex scams?
What Are the 10 Fatal Mistakes Traders Make
Trading is exciting. Trading is hard. Trading is extremely hard. Some say that it takes more than 10,000 hours to master. Others believe that trading is the way to quick riches. They might be both wrong. What is important to know that no matter how experienced you are, mistakes will be part of the trading process.

Moneta Markets review 2024: All you need to know
VERIFIED In this review, the FXStreet team provides an independent and thorough analysis based on direct testing and real experiences with Moneta Markets – an excellent broker for novice to intermediate forex traders who want to broaden their knowledge base.


