In this article we’ll cover three of the most common technical indicators, the Relative Strength Index (RSI), Bollinger Bands, as well as a Simple Moving Average Cross (SMA Cross), and how they can be used to identify different market conditions.
Let’s get started!
RSI
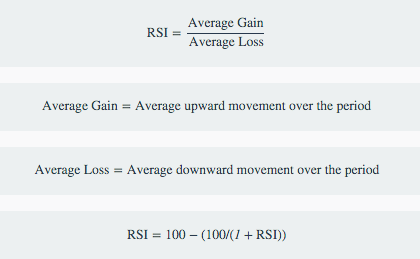
The RSI is one of the most widely-known technical indicators with many traders using it both to identify overbought and oversold conditions as well as to measure the strength of a trend. We’ll explore both applications but let’s first look at the underlying calculation:

So as the RS gets larger, i.e. the Average Gains grow larger than the Average Losses, the second part of the equation approaches 0 and the denominator approaches infinity, effectively leading to:
And as the RS gets smaller, i.e. the Average Gains are smaller than the Average Losses, the RSI approaches 0:
RSI as a Counter-Trend Indicator
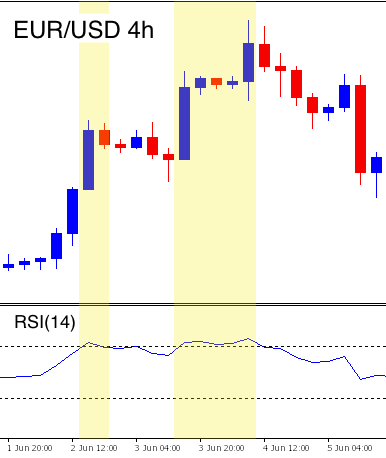
Conventional wisdom uses the RSI as “Over 70 = Overbought” and “Under 30 = Oversold”. But what do those numbers really mean?
The 70 mark is reached when the Average Gains are 2.33 larger than the Average Losses (the opposite being true for the 30 RSI value). The logic is that anytime the Average Gains are that much larger than the average losses the market is due for a correction.
Depending on the asset and timeframe you are trading, 2.33 times larger may be enough but it could just as easily signify a growing trend. If you were looking for a more pronounced difference, such as the Average Gains being 4 times larger than the Average Losses, you would want to look for an RSI value of 80 (or 20 to go long). This leads to a much more pronounced reversion from the mean but could also signify a strong breakout.
RSI as a Trend-Following Indicator
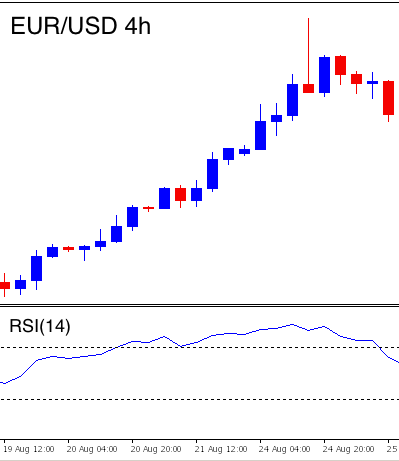
The RSI, looking at the underlying calculation, is measuring the strength of a trend by comparing the size of the upward movements to the size of downward movements. As the upward movements become larger than the downward movements we are thought to be in an uptrend. Can it be that simple?
Not quite. Let’s take the case where the RSI is at 60, meaning the Average Gains are 1.5 times larger than the Average Losses. This seems like the market could be in a moderate bullish trend. But what if the previous RSI value was 65? So the Average Gains used to be almost 2 times the Average Losses but they have been getting smaller. The trend would appear to be diminishing.
In order to use the RSI as a Trend-Following indicator, you want to look at where it is compared to its most recent range. For example, if the RSI has ranged between 55 and 45 for the last week and suddenly breaks above 60, there’s a good chance you are in an uptrend.
To do this we can use the Stochastic RSI. The Stochastic RSI applies the Stochastic formula to the RSI to give you a sense of where the current value is relative to the most recent range:

High Stochastic RSI values mean that the RSI is in the top of its range, signaling a potential bullish trend, while low Stochastic RSI values show that it is in the bottom of its range and demonstrate a bearish trend.
Editors’ Picks

USD/JPY gathers strength to near 157.50 as Takaichi’s party wins snap elections
The USD/JPY pair attracts some buyers to around 157.45 during the early Asian session on Monday. The Japanese Yen weakens against the US Dollar after Japan’s ruling Liberal Democratic Party won an outright majority in Sunday’s lower house election, opening the door to more fiscal stimulus by Prime Minister Sanae Takaichi.

Gold: Volatility persists in commodity space
After losing more than 8% to end the previous week, Gold remained under heavy selling pressure on Monday and dropped toward $4,400. Although XAU/USD staged a decisive rebound afterward, it failed to stabilize above $5,000. The US economic calendar will feature Nonfarm Payrolls and Consumer Price Index data for January, which could influence the market pricing of the Federal Reserve’s policy outlook and impact Gold’s performance.

AUD/USD eyes 0.7050 hurdle amid supportive fundamental backdrop
AUD/USD builds on Friday's goodish rebound from sub-0.6900 levels and kicks off the new week on a positive note, with bulls awaiting a sustained move and acceptance above mid-0.7000s before placing fresh bets. The widening RBA-Fed divergence, along with the upbeat market mood, acts as a tailwind for the risk-sensitive Aussie amid some follow-through US Dollar selling for the second straight day.

Week ahead: US NFP and CPI data to shake Fed cut bets, Japan election looms
US NFP and CPI data awaited after Warsh’s nomination as Fed chief. Yen traders lock gaze on Sunday’s snap election. UK and Eurozone Q4 GDP data also on the agenda. China CPI and PPI could reveal more weakness in domestic demand.

Three scenarios for Japanese Yen ahead of snap election Premium
The latest polls point to a dominant win for the ruling bloc at the upcoming Japanese snap election. The larger Sanae Takaichi’s mandate, the more investors fear faster implementation of tax cuts and spending plans.
RECOMMENDED LESSONS
Making money in forex is easy if you know how the bankers trade!
I’m often mystified in my educational forex articles why so many traders struggle to make consistent money out of forex trading. The answer has more to do with what they don’t know than what they do know. After working in investment banks for 20 years many of which were as a Chief trader its second knowledge how to extract cash out of the market.
5 Forex News Events You Need To Know
In the fast moving world of currency markets where huge moves can seemingly come from nowhere, it is extremely important for new traders to learn about the various economic indicators and forex news events and releases that shape the markets. Indeed, quickly getting a handle on which data to look out for, what it means, and how to trade it can see new traders quickly become far more profitable and sets up the road to long term success.
Top 10 Chart Patterns Every Trader Should Know
Chart patterns are one of the most effective trading tools for a trader. They are pure price-action, and form on the basis of underlying buying and selling pressure. Chart patterns have a proven track-record, and traders use them to identify continuation or reversal signals, to open positions and identify price targets.
7 Ways to Avoid Forex Scams
The forex industry is recently seeing more and more scams. Here are 7 ways to avoid losing your money in such scams: Forex scams are becoming frequent. Michael Greenberg reports on luxurious expenses, including a submarine bought from the money taken from forex traders. Here’s another report of a forex fraud. So, how can we avoid falling in such forex scams?
What Are the 10 Fatal Mistakes Traders Make
Trading is exciting. Trading is hard. Trading is extremely hard. Some say that it takes more than 10,000 hours to master. Others believe that trading is the way to quick riches. They might be both wrong. What is important to know that no matter how experienced you are, mistakes will be part of the trading process.
The challenge: Timing the market and trader psychology
Successful trading often comes down to timing – entering and exiting trades at the right moments. Yet timing the market is notoriously difficult, largely because human psychology can derail even the best plans. Two powerful emotions in particular – fear and greed – tend to drive trading decisions off course.


