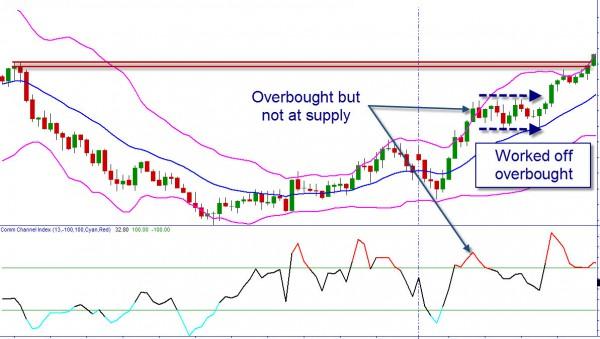
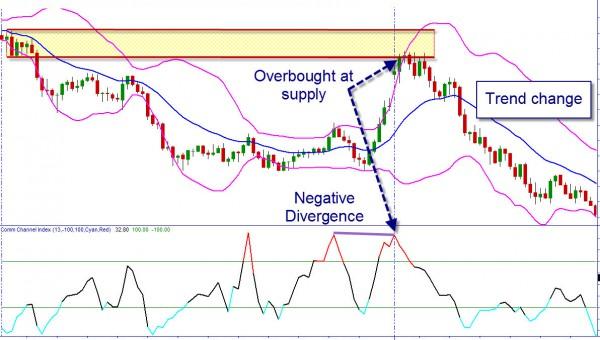
No, this isn’t an article about weight loss! It is more about preventing financial loss. As traders we often rely in technical indicators for signals to help identify turning points in the prices of both the markets and our stocks. In fact, many people rely on them as the basis for their software to tell them when to buy or sell. There is a major problem with trading in only this manner. While it is true that a signal from a technical indicator can foretell a reversal in price, it can also signal a pause in price before resumption of trend. Additionally, these signals usually appear after the turn in price. They are late and if you wait for them you are missing out on the best entry price for the security. A trader who solely relies on those signals for their trading decisions will often take trades that are stopped out for a loss.
So what should a trader do? Obviously they need to look at supply and demand and price action as a major decision maker for trading or investing. If you are a regular reader of these articles, you will know how successful traders like Sam Seiden, Gabe Velasquez, Sam Evans, Don Dawson, and others emphasize using the levels rather than indicators for decision making.
When most think of the market trends, they tend to think of only two directions, up or down. However there is another direction the markets can take and that is sideways. Imagine if you were in the lobby of a 40 story building with no elevator. Now, if I told you that there was 1 crore Rupees in a briefcase at the top of the building that you could have if you climbed the stairs, what would you do? Of course you would start climbing! Most of us would tire at some point and need to rest. Would you stop climbing and go down stairs to rest? Of course you wouldn’t. You would stay at the highest level you had reached and wait until you gathered strength to resume climbing.
Prices will often move sideways in a strong trend for a rest as well. Prices rise due to aggressive buyers pushing prices higher. When prices have risen too high, many potential buyers will back away as price has become too expensive. When they see that no one is selling to make the price cheaper, they will resume in the buying for fear that they will miss out on profits. This pause will cause many traders who are already in the stock to book profits too early for fear of a reversal that never comes. It may also tempt traders into unwarranted shorts as they try to pick the top of the markets.
Watch the price action as you come away from those overbought/oversold situations. Prices may simply pause and move sideways at those areas in order to work off the indication and allow more traders to enter into the trend. As with real estate, they key is location. An overbought indication at supply is one to heed as is an oversold at strong demand. Other indications may be false and lead to overtrading.
So use the indicators as they are intended, as a decision support tool for your trading on supply and demand. To learn more, attend a course at the Online Trading Academy center nearest you. Until next week, trade safe and trade well!
Neither Freedom Management Partners nor any of its personnel are registered broker-dealers or investment advisers. I will mention that I consider certain securities or positions to be good candidates for the types of strategies we are discussing or illustrating. Because I consider the securities or positions appropriate to the discussion or for illustration purposes does not mean that I am telling you to trade the strategies or securities. Keep in mind that we are not providing you with recommendations or personalized advice about your trading activities. The information we are providing is not tailored to any individual. Any mention of a particular security is not a recommendation to buy, sell, or hold that or any other security or a suggestion that it is suitable for any specific person. Keep in mind that all trading involves a risk of loss, and this will always be the situation, regardless of whether we are discussing strategies that are intended to limit risk. Also, Freedom Management Partners’ personnel are not subject to trading restrictions. I and others at Freedom Management Partners could have a position in a security or initiate a position in a security at any time.
Editors’ Picks
AUD/USD hovers around 0.6500 amid light trading, ahead of US GDP

AUD/USD is trading close to 0.6500 in Asian trading on Thursday, lacking a clear directional impetus amid an Anzac Day holiday in Australia. Meanwhile, traders stay cautious due ti risk-aversion and ahead of the key US Q1 GDP release.
USD/JPY finds its highest bids since 1990, near 155.50

USD/JPY keeps breaking into its highest chart territory since June of 1990 early Thursday, testing 155.50 for the first time in 34 years as the Japanese Yen remains vulnerable, despite looming Japanese intervention risks. Focus shifts to Thursday's US GDP report and the BoJ decision on Friday.
Gold price treads water near $2,320, awaits US GDP data

Gold price recovers losses but keeps its range near $2,320 early Thursday. Renewed weakness in the US Dollar and the US Treasury yields allow Gold buyers to breathe a sigh of relief. Gold price stays vulnerable amid Middle East de-escalation, awaiting US Q1 GDP data.
Injective price weakness persists despite over 5.9 million INJ tokens burned

Injective price is trading with a bearish bias, stuck in the lower section of the market range. The bearish outlook abounds despite the network's deflationary efforts to pump the price. Coupled with broader market gloom, INJ token’s doomed days may not be over yet.
Meta Platforms Earnings: META sinks 10% on lower Q2 revenue guidance Premium

This must be "opposites" week. While Doppelganger Tesla rode horrible misses on Tuesday to a double-digit rally, Meta Platforms produced impressive beats above Wall Street consensus after the close on Wednesday, only to watch the share price collapse by nearly 10%.
RECOMMENDED LESSONS
Making money in forex is easy if you know how the bankers trade!
Discover how to make money in forex is easy if you know how the bankers trade!
5 Forex News Events You Need To Know
In the fast moving world of currency markets, it is extremely important for new traders to know the list of important forex news...
Top 10 Chart Patterns Every Trader Should Know
Chart patterns are one of the most effective trading tools for a trader. They are pure price-action, and form on the basis of underlying buying and...
7 Ways to Avoid Forex Scams
The forex industry is recently seeing more and more scams. Here are 7 ways to avoid losing your money in such scams: Forex scams are becoming frequent. Michael Greenberg reports on luxurious expenses, including a submarine bought from the money taken from forex traders. Here’s another report of a forex fraud. So, how can we avoid falling in such forex scams?
What Are the 10 Fatal Mistakes Traders Make
Trading is exciting. Trading is hard. Trading is extremely hard. Some say that it takes more than 10,000 hours to master. Others believe that trading is the way to quick riches. They might be both wrong. What is important to know that no matter how experienced you are, mistakes will be part of the trading process.


