Every morning traders wake up looking at their charts in an effort to find opportunities. They are faced with making decisions on whether to go long or short the particular markets they trade. This can be challenging as the markets are in a constant state of motion. One day up, the next down, and on some days the market can change direction intraday. So, with markets constantly changing it’s important that a trader gain the right perspective to start every day.
One way to do that is to look at the big picture. This means looking at daily, weekly or monthly charts. The objective here is to identify the environment a trader is going to encounter. This will enable them to be better prepared to tackle the day’s trading challenges. If you think about it, the markets can only be in two types of environments: trending or in a range (sideways market).
A common misconception many traders have is that they think the markets tend to trend more often than they’re in a range. Regression studies have actually shown that this not the case. Markets generally have larger spells were they are range bound. In looking at larger timeframe trends (weekly and monthly) in the stock index futures or currencies, what you will find is that these markets spend weeks, sometimes months going sideways before they resume the next leg of the trend. Look at the charts and you will see the sideways market for yourself. If this is indeed the case, then traders need to know where the lowest risk trades are found in this environment.
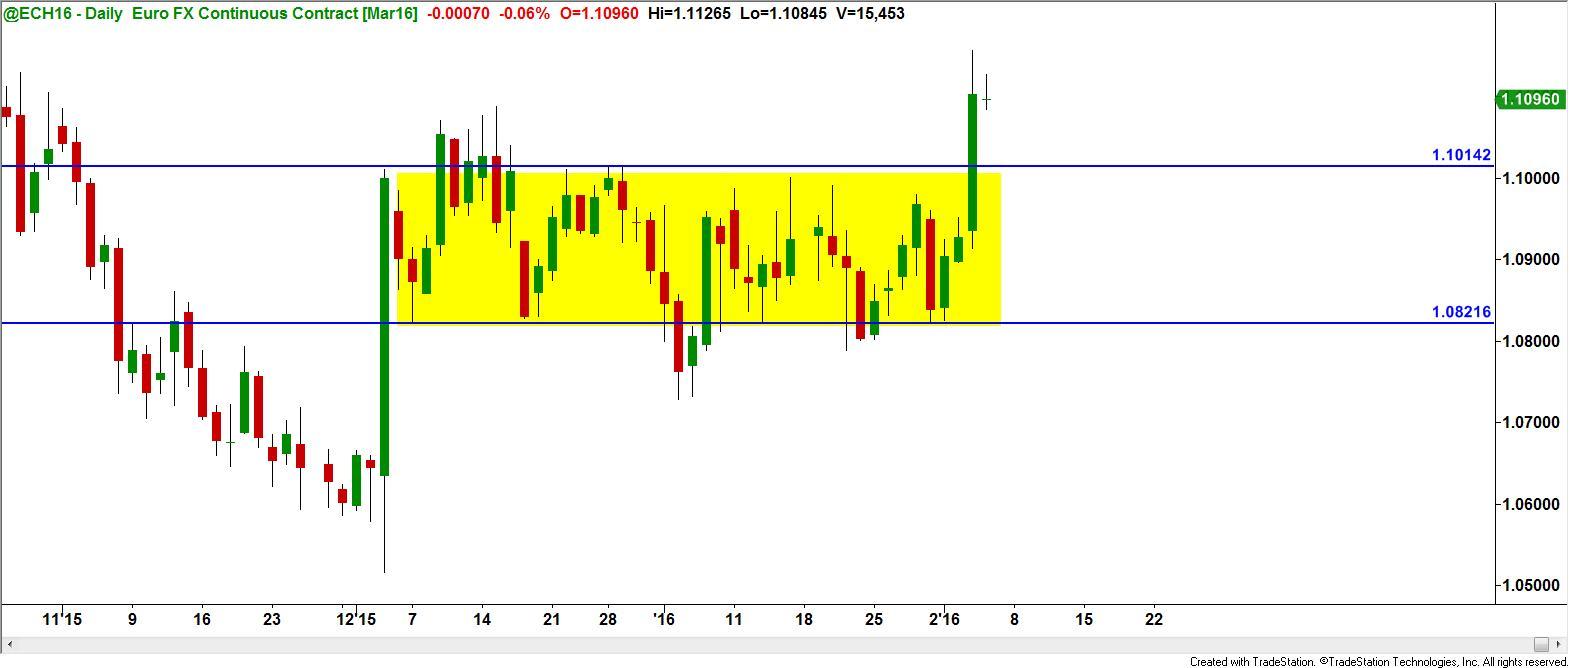
Recently the Euro Currency futures contract has been in a large range for about a month. We can see this on the daily chart below.
In this type of environment the lowest risk, highest probability trades would be at the top and bottom of the range. In other words, look to buy at the bottom of the range and short as we near the top of the range.
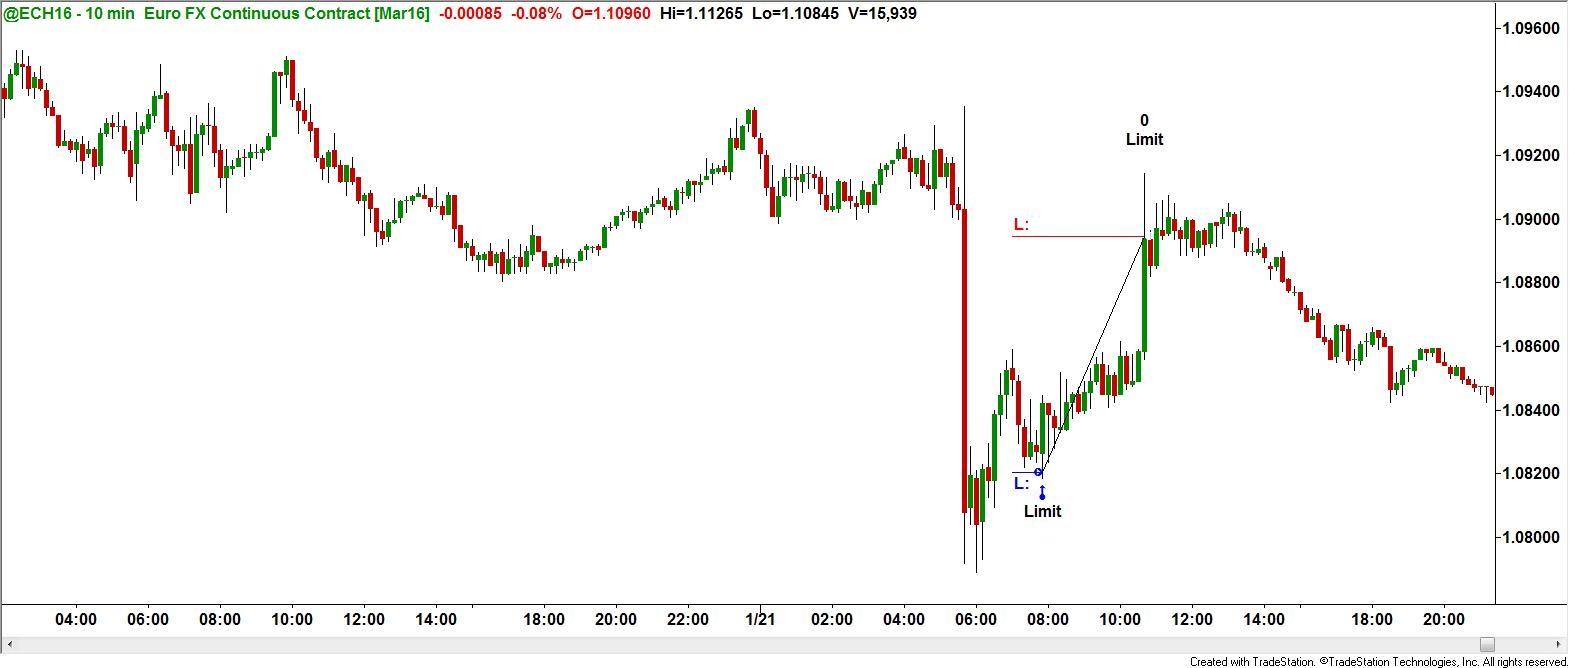
Implementing this strategy, I recently took a trade look in the Euro Futures near the lower part of the range. As we can see from the chart, I took the entry at the origin of a strong move in price (demand) and achieved the profit target right below a supply zone identified by the strong move lower.
Also of note is that the demand zone was located near the lower extremity of the range.
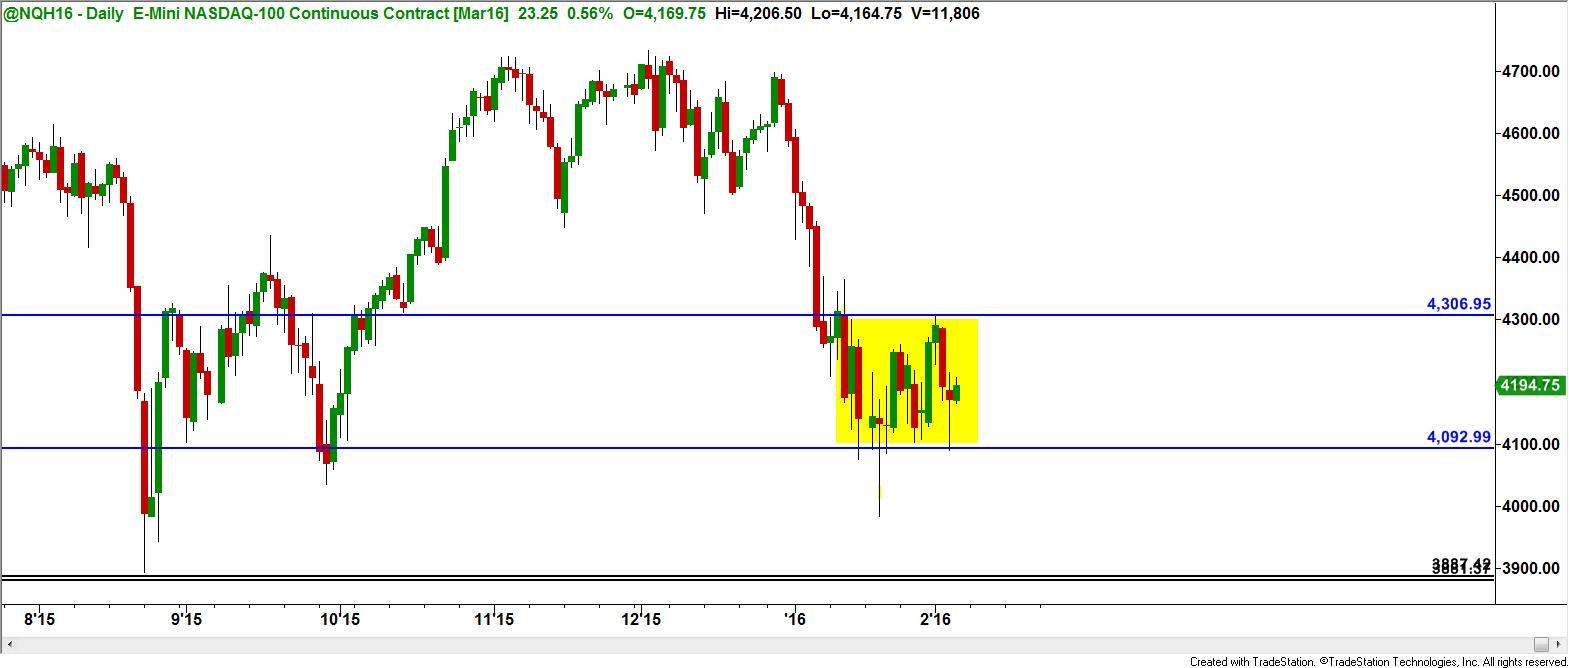
In the next example, we see the Nasdaq mini futures also in a daily range.
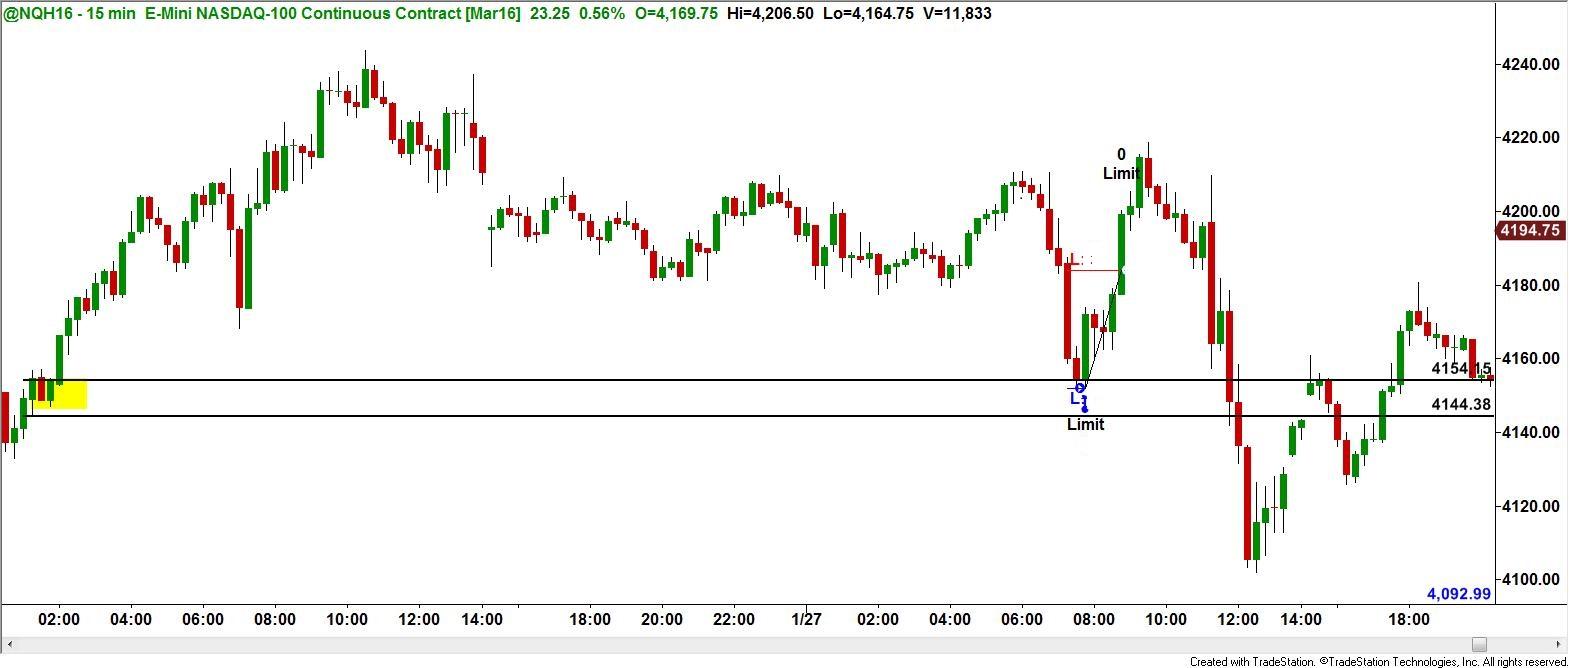
Similarly, an opportunity at the lower part of the sideways market presented itself and I took that trade as well. As we can see from the lower chart, the demand zone (highlighted by the two horizontal lines) was the entry and the target was achieved at the opposing level of supply.
As we can see, having the right perspective can assist us in finding low risk trading opportunities. This requires learning a rules based strategy that is consistent in its approach. In this missive, we focused on range-bound or sideways markets. In the next one, we’ll tackle trending markets and how to trade those. Stay tuned…
Until next time, I hope everyone has a great week.
This content is intended to provide educational information only. This information should not be construed as individual or customized legal, tax, financial or investment services. As each individual's situation is unique, a qualified professional should be consulted before making legal, tax, financial and investment decisions. The educational information provided in this article does not comprise any course or a part of any course that may be used as an educational credit for any certification purpose and will not prepare any User to be accredited for any licenses in any industry and will not prepare any User to get a job. Reproduced by permission from OTAcademy.com click here for Terms of Use: https://www.otacademy.com/about/terms
Editors’ Picks
AUD/USD failed just ahead of the 200-day SMA

Finally, AUD/USD managed to break above the 0.6500 barrier on Wednesday, extending the weekly recovery, although its advance faltered just ahead of the 0.6530 region, where the key 200-day SMA sits.
EUR/USD met some decent resistance above 1.0700

EUR/USD remained unable to gather extra upside traction and surpass the 1.0700 hurdle in a convincing fashion on Wednesday, instead giving away part of the weekly gains against the backdrop of a decent bounce in the Dollar.
Gold keeps consolidating ahead of US first-tier figures

Gold finds it difficult to stage a rebound midweek following Monday's sharp decline but manages to hold above $2,300. The benchmark 10-year US Treasury bond yield stays in the green above 4.6% after US data, not allowing the pair to turn north.
Bitcoin price could be primed for correction as bearish activity grows near $66K area

Bitcoin (BTC) price managed to maintain a northbound trajectory after the April 20 halving, despite bold assertions by analysts that the event would be a “sell the news” situation. However, after four days of strength, the tables could be turning as a dark cloud now hovers above BTC price.
Bank of Japan's predicament: The BOJ is trapped

In this special edition of TradeGATEHub Live Trading, we're joined by guest speaker Tavi @TaviCosta, who shares his insights on the Bank of Japan's current predicament, stating, 'The BOJ is Trapped.'
RECOMMENDED LESSONS
Making money in forex is easy if you know how the bankers trade!
Discover how to make money in forex is easy if you know how the bankers trade!
5 Forex News Events You Need To Know
In the fast moving world of currency markets, it is extremely important for new traders to know the list of important forex news...
Top 10 Chart Patterns Every Trader Should Know
Chart patterns are one of the most effective trading tools for a trader. They are pure price-action, and form on the basis of underlying buying and...
7 Ways to Avoid Forex Scams
The forex industry is recently seeing more and more scams. Here are 7 ways to avoid losing your money in such scams: Forex scams are becoming frequent. Michael Greenberg reports on luxurious expenses, including a submarine bought from the money taken from forex traders. Here’s another report of a forex fraud. So, how can we avoid falling in such forex scams?
What Are the 10 Fatal Mistakes Traders Make
Trading is exciting. Trading is hard. Trading is extremely hard. Some say that it takes more than 10,000 hours to master. Others believe that trading is the way to quick riches. They might be both wrong. What is important to know that no matter how experienced you are, mistakes will be part of the trading process.


