George Santayana is popularly known for aphorisms such as, “Those who cannot remember the past are condemned to repeat it.” When it comes to the markets, this is often the rule more than the exception. In fact, Online Trading Academy’s core strategy is based on locating repeatable patterns that demonstrate where the institutional traders are placing their orders.
When you look at charts, you are looking at the historical picture of price action. This price action is caused by the thoughts and perceptions of the market participants. During various economic and political conditions these thoughts and perceptions influence traders and investors in predictable manners. By viewing similar patterns, we can often predict future behavior of the financial markets.
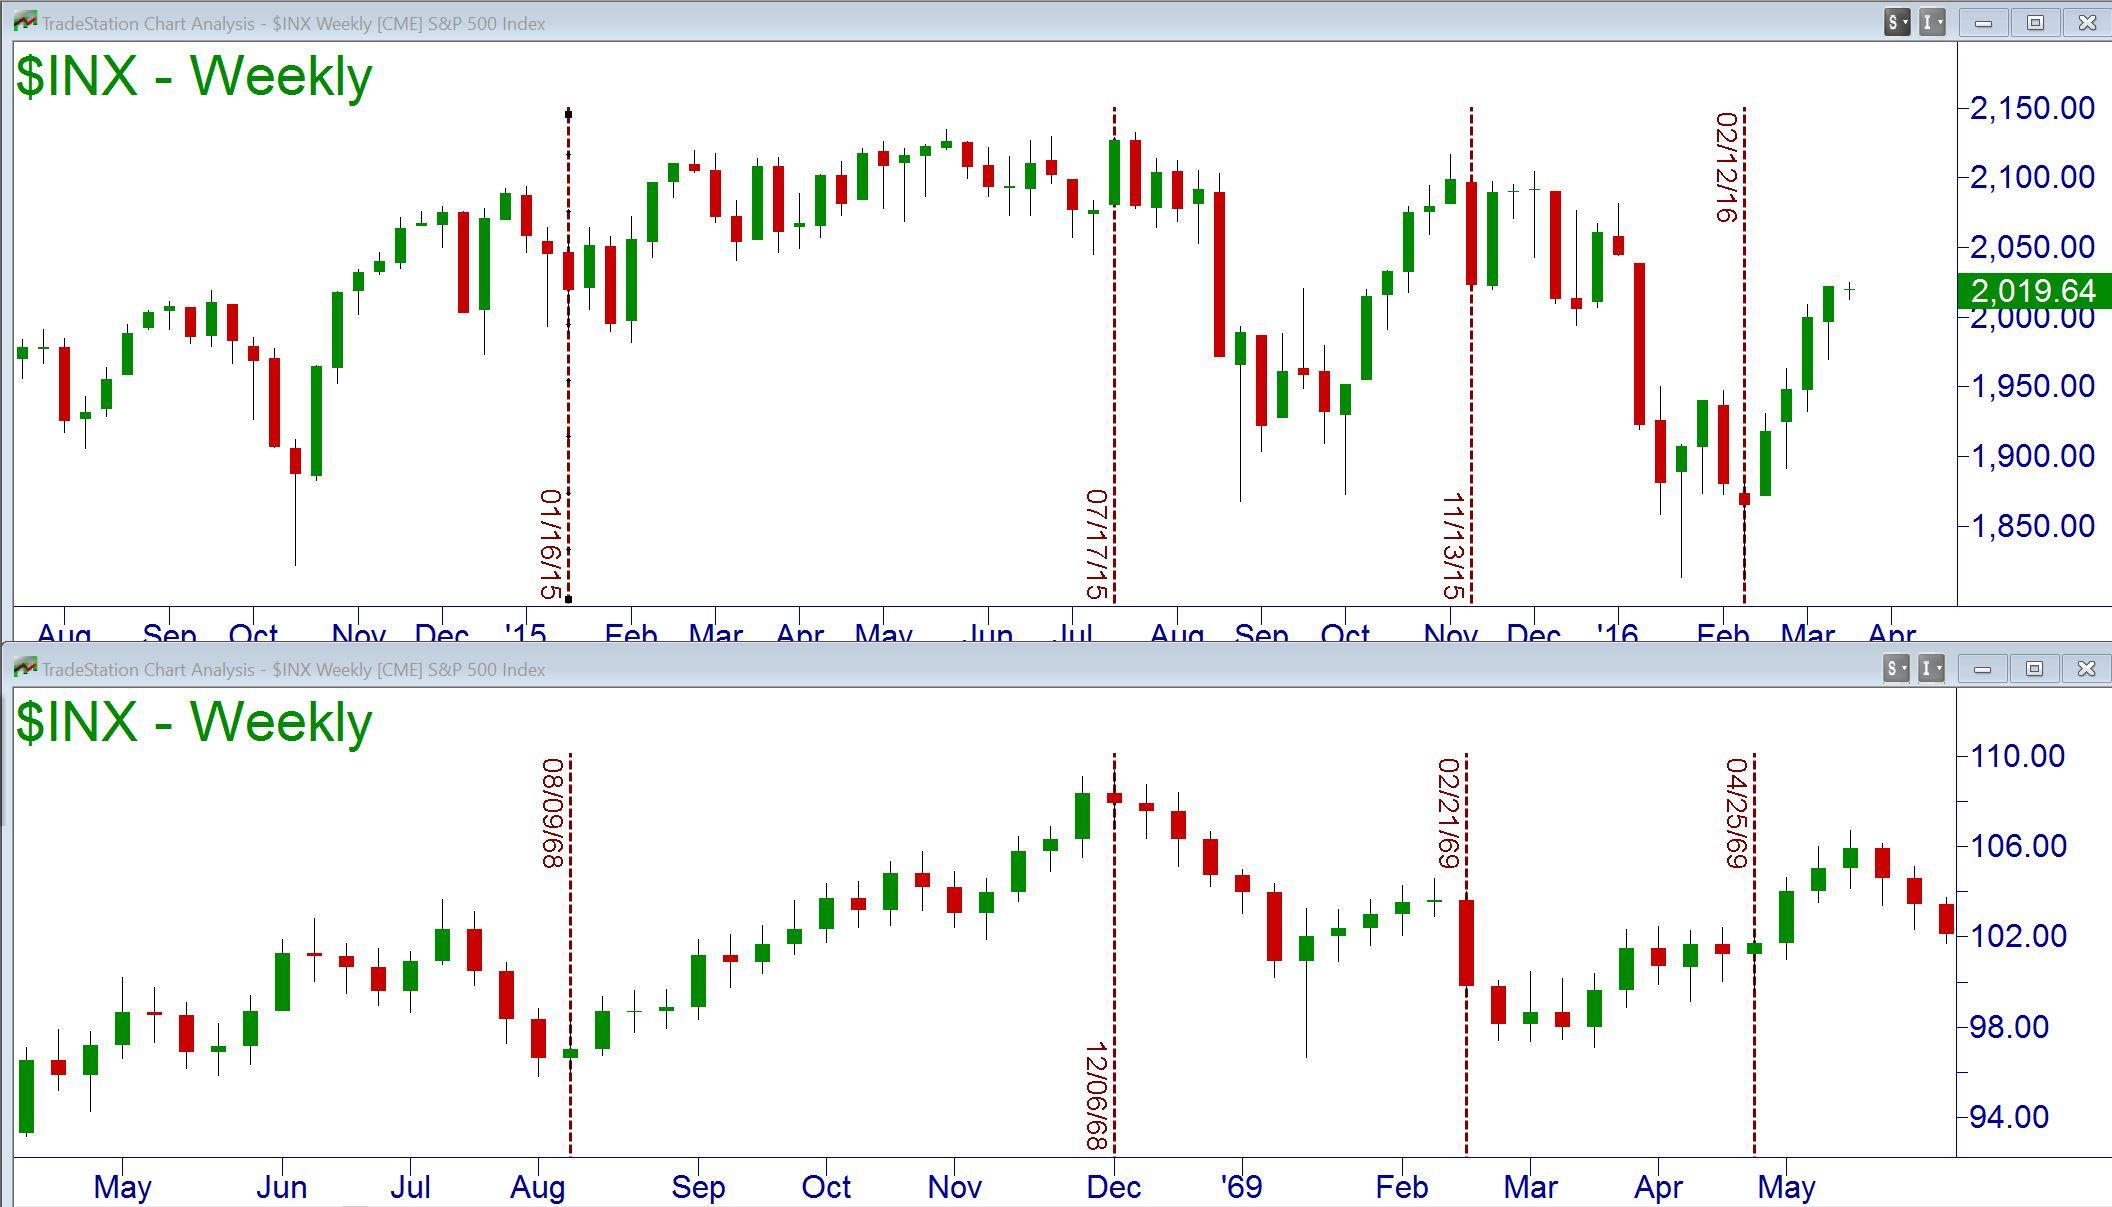
Purely by accident, I was viewing charts of the S&P 500 from the past with one of my classes when I noticed a period of time where the markets looked eerily similar to the price patterns we are currently experiencing. Looking at the following chart, you can see the top chart is a weekly picture of the S&P 500 index. The bottom chart is also a weekly chart of the S&P 500, but from 1968 to 1969.
While not exact, the price patterns are extremely similar. The dips and rallies occurred in nearly the same pattern in 2015 and 2016 as they did in the late 1960’s.
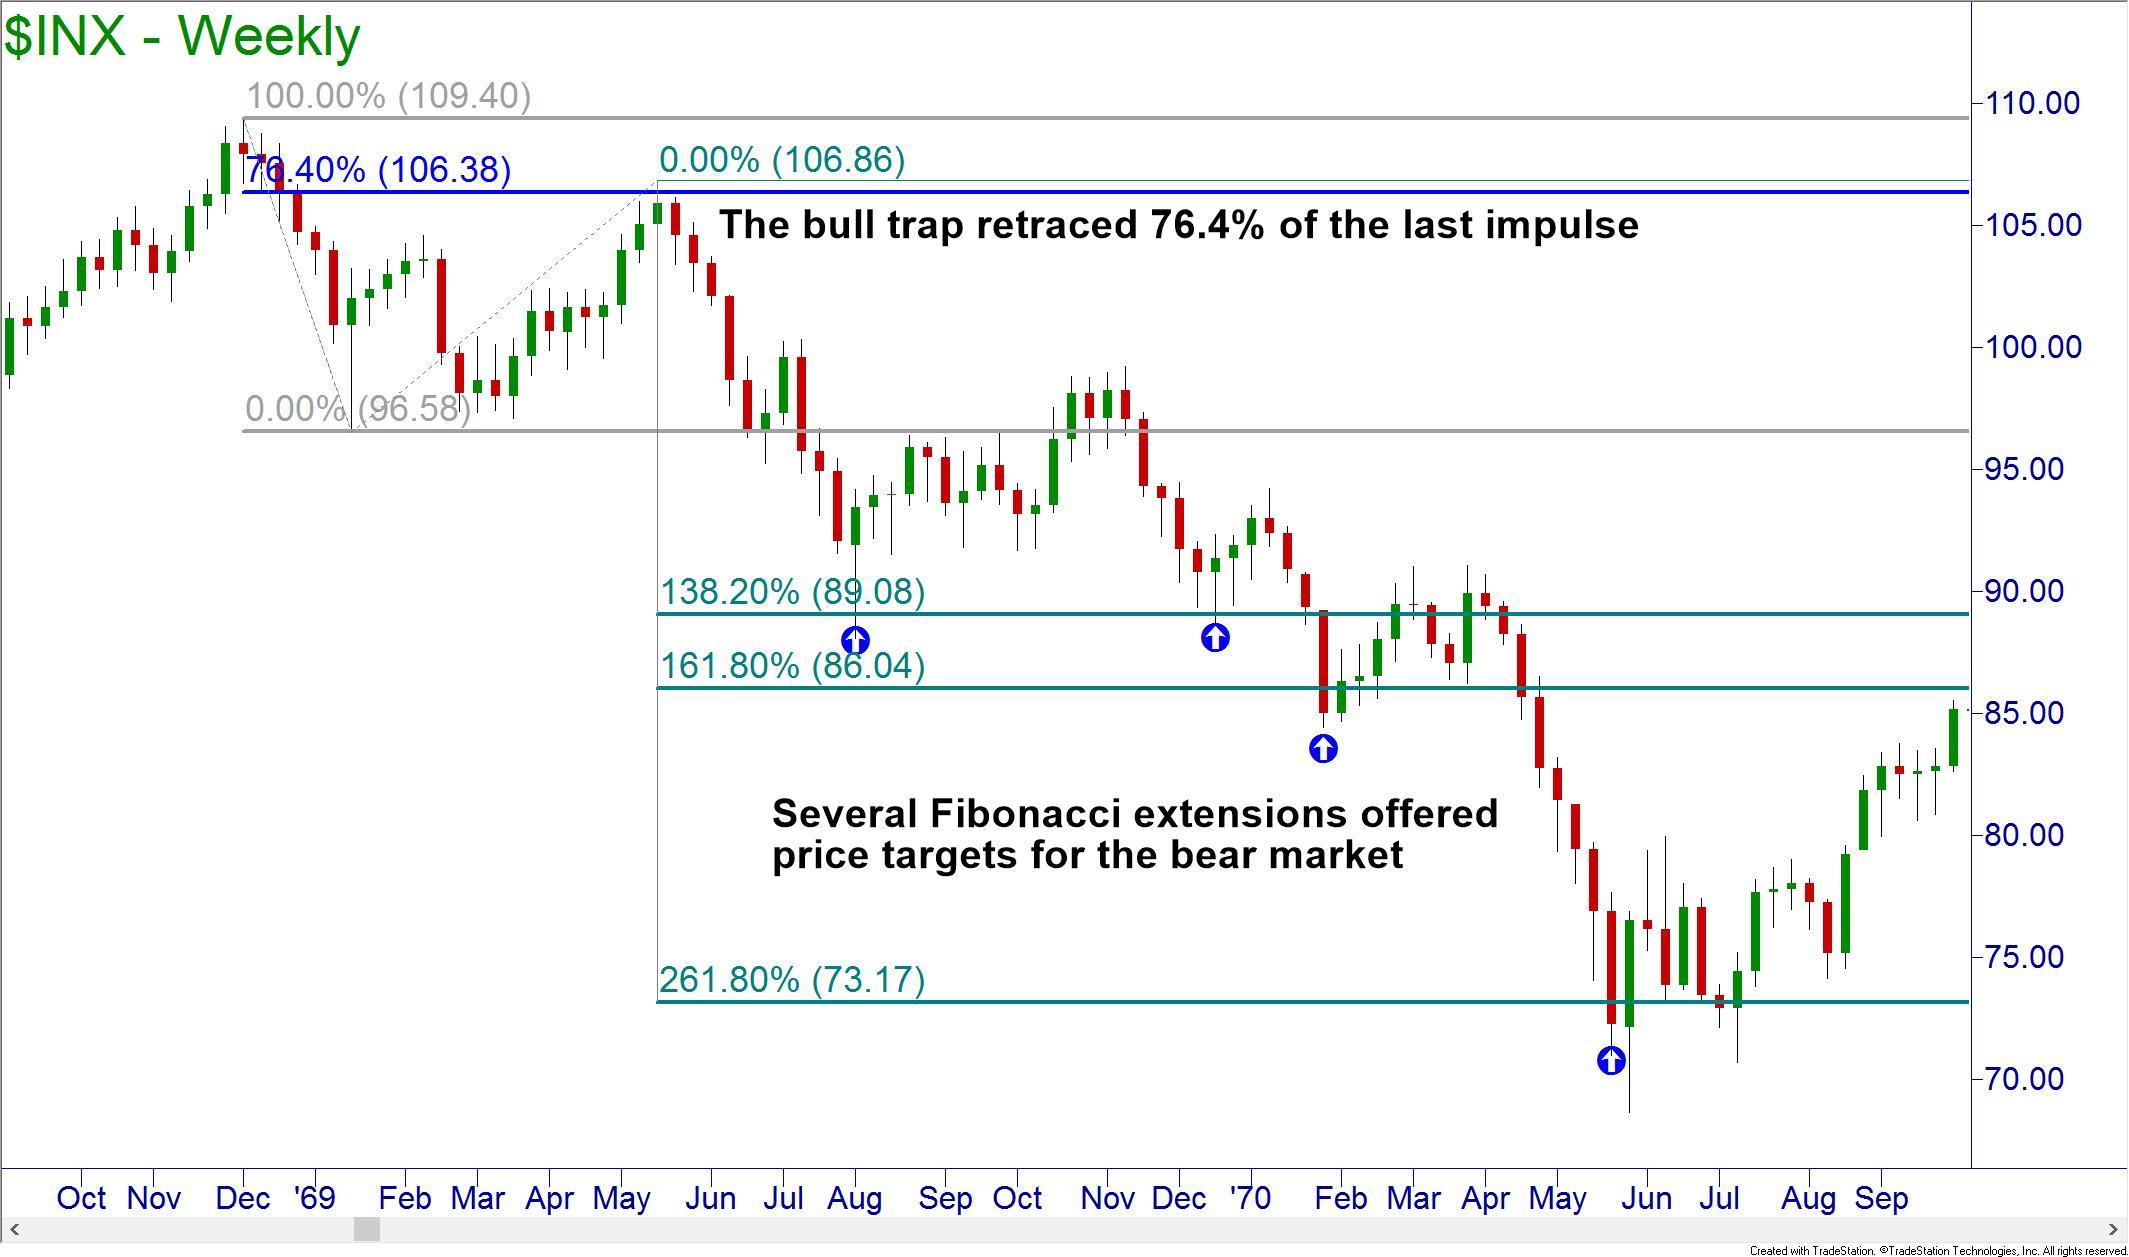
Applying some advanced technical analysis techniques, such as Fibonaccis, to the price action of the 1960s, you can see that there was a bull trap just before the bear market that extended from 1969 through 1970. A bull trap is when prices rise after a sharp decline from a major price peak. This rapid rise leads investors to believe that the drop was only a small correction and that the bull market will shortly resume. This is a pattern that has repeated itself for every bubble burst and bear market.
There was a sharp rise in early 1969 that retraced 76.4% of the drop from the peak in prices. Once the decline began, the Fibonacci Extensions offered potential targets for shorting opportunities, including the bottom of the bear market.
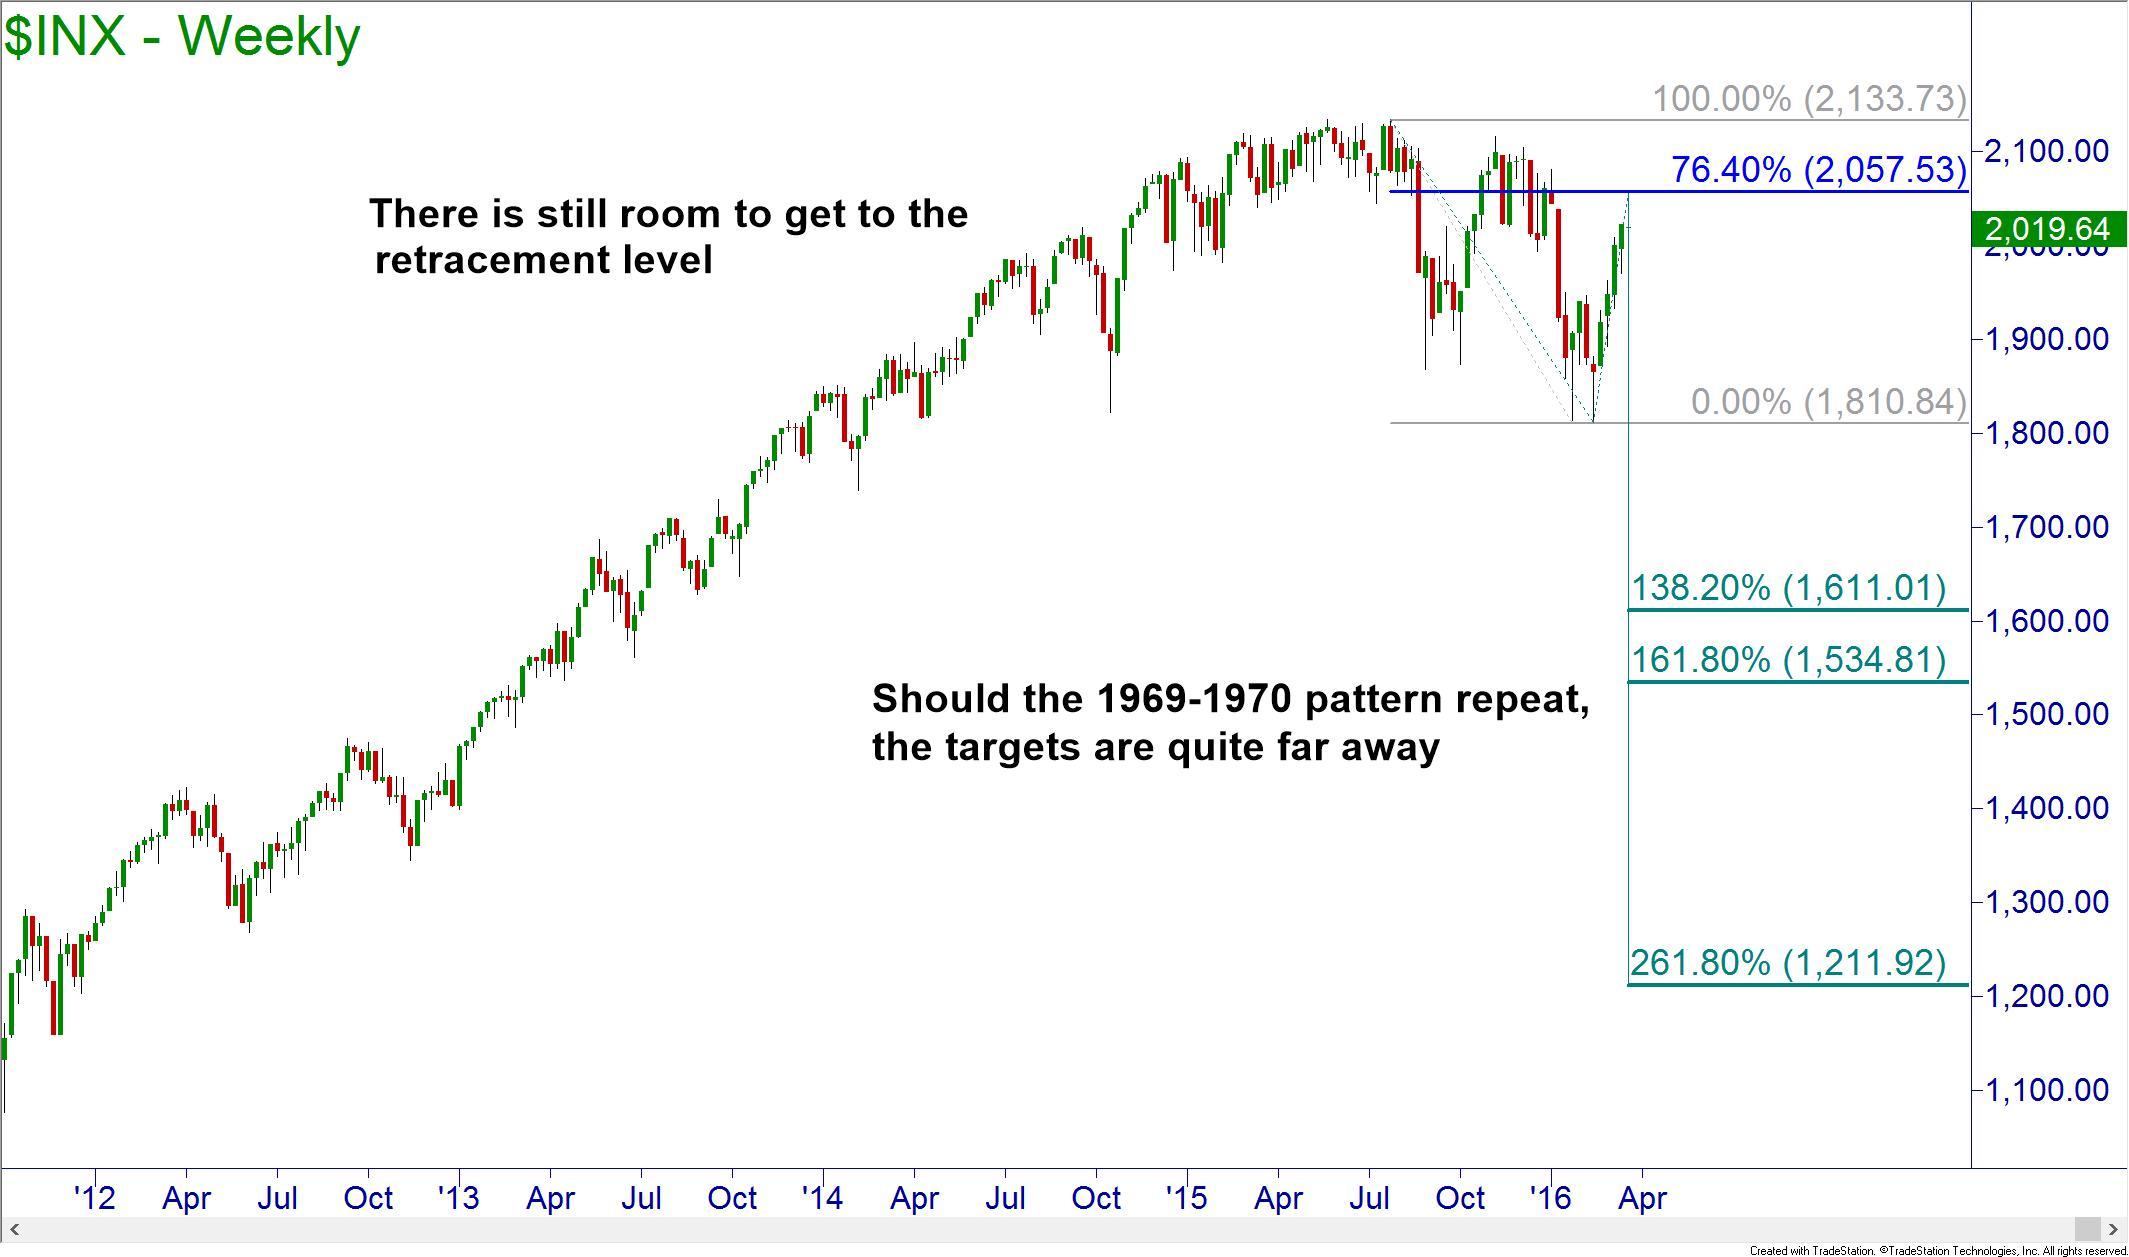
Applying the same Fibonacci techniques to the current S&P 500 price chart, the bull trap appears to be in place and ready to spring on unsuspecting traders and investors. Should we follow the same pattern as the 1960s, the index will continue to climb until approximately 2057. Once there the bear market should begin with prices targeting a few points along the way.
The first major target for bearish price action would be in the low 1600s. Once there, price would likely see a small bounce. The bear market would definitely be in full swing as that would be a price drop from the highs of about 25%. Further price targets are 1530 and the potential bottom of the market at the low 1200s. There is a strong weekly demand at 1440 that could be the bottom instead of the Fibonacci projection.
That brings up an important point. Supply and demand zones are the primary driving force of price. The Fibonacci tools are just to be used as a supporting tool, not the decision maker itself. The retracement to 2057 also corresponds to a supply zone which makes the level stronger. Trust your levels when navigating the markets in order to increase your chances for success.
To learn how to identify the proper zones, visit your local Online Trading Academy Education Center and enroll in a course today!
Neither Freedom Management Partners nor any of its personnel are registered broker-dealers or investment advisers. I will mention that I consider certain securities or positions to be good candidates for the types of strategies we are discussing or illustrating. Because I consider the securities or positions appropriate to the discussion or for illustration purposes does not mean that I am telling you to trade the strategies or securities. Keep in mind that we are not providing you with recommendations or personalized advice about your trading activities. The information we are providing is not tailored to any individual. Any mention of a particular security is not a recommendation to buy, sell, or hold that or any other security or a suggestion that it is suitable for any specific person. Keep in mind that all trading involves a risk of loss, and this will always be the situation, regardless of whether we are discussing strategies that are intended to limit risk. Also, Freedom Management Partners’ personnel are not subject to trading restrictions. I and others at Freedom Management Partners could have a position in a security or initiate a position in a security at any time.
Editors’ Picks

EUR/USD stays weak near 1.1850 after dismal German ZEW data
EUR/USD remains in the red near 1.1850 in the European session on Tuesday. A broad US Dollar bullish consolidation combined with a softer risk tone keep the pair undermined alongside downbeat German ZEW sentiment readings for February.

GBP/USD holds losees near 1.3600 after weak UK jobs report
GBP/USD is holding moderate losses near the 1.3600 level in Tuesday's European trading. The United Kingdom employment data suggested worsening labor market conditions, bolstering bets for a BoE interest rate cut next month. This narrative keeps the Pound Sterling under bearish pressure.

Gold pares intraday losses; keeps the red above $4,900 amid receding safe-haven demand
Gold (XAU/USD) attracts some follow-through selling for the second straight day and dives to over a one-week low, around the $4,858 area, heading into the European session on Tuesday.

Canada CPI expected to show sticky inflation in January, still above BoC’s target
Economists see the headline CPI rising by 2.4% in a year to January, still above the BoC’s target and matching December’s increase. On a monthly basis, prices are expected to rise by 0.1%.

UK jobs market weakens, bolstering rate cut hopes
In the UK, the latest jobs report made for difficult reading. Nonetheless, this represents yet another reminder for the Bank of England that they need to act swiftly given the collapse in inflation expected over the coming months.
RECOMMENDED LESSONS
Making money in forex is easy if you know how the bankers trade!
I’m often mystified in my educational forex articles why so many traders struggle to make consistent money out of forex trading. The answer has more to do with what they don’t know than what they do know. After working in investment banks for 20 years many of which were as a Chief trader its second knowledge how to extract cash out of the market.
5 Forex News Events You Need To Know
In the fast moving world of currency markets where huge moves can seemingly come from nowhere, it is extremely important for new traders to learn about the various economic indicators and forex news events and releases that shape the markets. Indeed, quickly getting a handle on which data to look out for, what it means, and how to trade it can see new traders quickly become far more profitable and sets up the road to long term success.
Top 10 Chart Patterns Every Trader Should Know
Chart patterns are one of the most effective trading tools for a trader. They are pure price-action, and form on the basis of underlying buying and selling pressure. Chart patterns have a proven track-record, and traders use them to identify continuation or reversal signals, to open positions and identify price targets.
7 Ways to Avoid Forex Scams
The forex industry is recently seeing more and more scams. Here are 7 ways to avoid losing your money in such scams: Forex scams are becoming frequent. Michael Greenberg reports on luxurious expenses, including a submarine bought from the money taken from forex traders. Here’s another report of a forex fraud. So, how can we avoid falling in such forex scams?
What Are the 10 Fatal Mistakes Traders Make
Trading is exciting. Trading is hard. Trading is extremely hard. Some say that it takes more than 10,000 hours to master. Others believe that trading is the way to quick riches. They might be both wrong. What is important to know that no matter how experienced you are, mistakes will be part of the trading process.
The challenge: Timing the market and trader psychology
Successful trading often comes down to timing – entering and exiting trades at the right moments. Yet timing the market is notoriously difficult, largely because human psychology can derail even the best plans. Two powerful emotions in particular – fear and greed – tend to drive trading decisions off course.


