Most traders believe that all technical indicators are alike and can simply be substituted one for another. If you are of that belief then you are probably not using these indicators successfully. A person who thinks all tools are the same may try to use a hammer or screwdriver to repair a leaky faucet. They will likely fail at that task. All they needed was a pipe wrench to fix the trouble but since they poorly assessed the problem and chose the wrong tool, they may have a larger dilemma than when they started.
Trading without a full understanding of the markets and using the wrong tools is something I see often when prospective traders come to Online Trading Academy’s courses. Fortunately we are here to educate you and guide you in reaching your financial goals. Our courses are filled with information that you need to learn to properly trade and protect your capital.
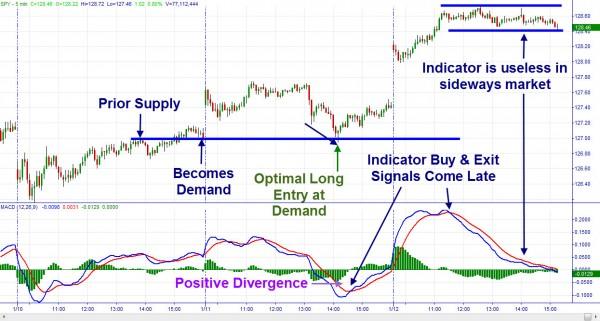
Let me get back to the technical indicators. You have heard me and other instructors stress the importance of price action and supply and demand as the best indication for potential future price movement. Even though I may have a great knowledge of many indicators and do use a few in my trading, they are only used to support my decisions that are being made on price and/or volume. The signals generated by these indicators typically come after the optimal entry and confirm that my decision was correct.
There are two types of technical indicators: the momentum indicator and the oscillator. Knowing the difference and choosing the right indicator for the market environment you are trading in may be just as critical as choosing the right security to trade. Using the wrong indicator can lead to false or early signals that cause losing trades or scare traders out of winning positions too early.
The momentum indicator as its name suggests, measures the strength of a trend. Momentum is a measurement of the rate of change in price. Just like Newton’s Third Law suggests, an object in motion tends to stay in motion. Building momentum usually suggests continuation of trend. A decline in momentum suggests a pause or reversal due to opposing forces of buyers or sellers.
Momentum indicators include popular tools like MACD, ADX, Momentum, ROC, Money Flow and a host of others. Momentum indicators work best in trending markets to gauge the strength or weakness of the trend. A momentum indicator will yield false signals in a sideways, choppy market and cause you to overtrade. You must also be careful not to trade against the trend. For instance, a buy signal generated from a MACD at a support zone in an uptrend is a good entry signal. However, the sell signal from that MACD may be an indication to take profits, not to short the market against the prevailing trend.
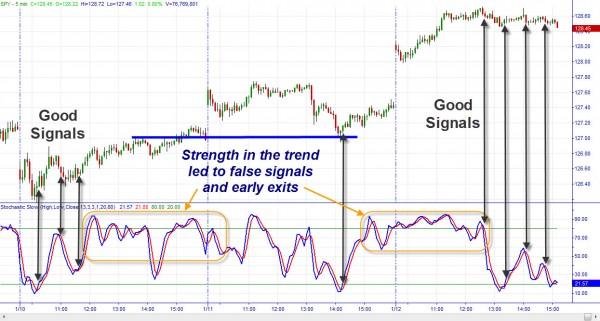
So if we should not use momentum indicators in a channeling market, what can we use to assist us in price prediction? Oscillators are a useful tool in that scenario. Oscillators measure overbought and oversold environments in price. The problem with this type of indicator is that in a strong uptrend, prices become overbought very fast and can become more overbought before declining. Selling or even worse, short selling overbought on an oscillator could lead to cutting profits short or losses. The same happens in a downtrend when oversold leads to more oversold. Oscillators can be used in trends with some modification which we discuss in the Technical Analysis Strategies course at Online Trading Academy.
An oscillator is an indicator that measures when prices have reached an extreme in comparison to normal, or when price action is changing. Most oscillators will have an overbought line and oversold line built into them such as 80-20 on a stochastic or 70-30 on an RSI. When you reach these areas and are at a supply or demand zone, you have a higher probability for success when you act. The same problem arises with oscillators as momentum indicators in that they may give late signals and you shouldn’t fight the dominant trend for the timeframe you are trading.
There is no substitute for price. Understanding supply and demand is critical for any trader to have success in any market. However, using the right technical indicators at the right time can definitely increase your probability of being on the right side of the trade. Make sure you aren’t using a hammer to change a light bulb. It’s the wrong tool and you’ll make a bigger mess. Until next time, trade safe and trade well.
Neither Freedom Management Partners nor any of its personnel are registered broker-dealers or investment advisers. I will mention that I consider certain securities or positions to be good candidates for the types of strategies we are discussing or illustrating. Because I consider the securities or positions appropriate to the discussion or for illustration purposes does not mean that I am telling you to trade the strategies or securities. Keep in mind that we are not providing you with recommendations or personalized advice about your trading activities. The information we are providing is not tailored to any individual. Any mention of a particular security is not a recommendation to buy, sell, or hold that or any other security or a suggestion that it is suitable for any specific person. Keep in mind that all trading involves a risk of loss, and this will always be the situation, regardless of whether we are discussing strategies that are intended to limit risk. Also, Freedom Management Partners’ personnel are not subject to trading restrictions. I and others at Freedom Management Partners could have a position in a security or initiate a position in a security at any time.
Editors’ Picks
EUR/USD clings to daily gains above 1.0650

EUR/USD gained traction and turned positive on the day above 1.0650. The improvement seen in risk mood following the earlier flight to safety weighs on the US Dollar ahead of the weekend and helps the pair push higher.
GBP/USD recovers toward 1.2450 after UK Retail Sales data

GBP/USD reversed its direction and advanced to the 1.2450 area after touching a fresh multi-month low below 1.2400 in the Asian session. The positive shift seen in risk mood on easing fears over a deepening Iran-Israel conflict supports the pair.
Gold holds steady at around $2,380 following earlier spike

Gold stabilized near $2,380 after spiking above $2,400 with the immediate reaction to reports of Israel striking Iran. Meanwhile, the pullback seen in the US Treasury bond yields helps XAU/USD hold its ground.
Bitcoin Weekly Forecast: BTC post-halving rally could be partially priced in Premium

Bitcoin price shows no signs of directional bias while it holds above $60,000. The fourth BTC halving is partially priced in, according to Deutsche Bank’s research.
Week ahead – US GDP and BoJ decision on top of next week’s agenda

US GDP, core PCE and PMIs the next tests for the Dollar. Investors await BoJ for guidance about next rate hike. EU and UK PMIs, as well as Australian CPIs also on tap.
RECOMMENDED LESSONS
Making money in forex is easy if you know how the bankers trade!
Discover how to make money in forex is easy if you know how the bankers trade!
5 Forex News Events You Need To Know
In the fast moving world of currency markets, it is extremely important for new traders to know the list of important forex news...
Top 10 Chart Patterns Every Trader Should Know
Chart patterns are one of the most effective trading tools for a trader. They are pure price-action, and form on the basis of underlying buying and...
7 Ways to Avoid Forex Scams
The forex industry is recently seeing more and more scams. Here are 7 ways to avoid losing your money in such scams: Forex scams are becoming frequent. Michael Greenberg reports on luxurious expenses, including a submarine bought from the money taken from forex traders. Here’s another report of a forex fraud. So, how can we avoid falling in such forex scams?
What Are the 10 Fatal Mistakes Traders Make
Trading is exciting. Trading is hard. Trading is extremely hard. Some say that it takes more than 10,000 hours to master. Others believe that trading is the way to quick riches. They might be both wrong. What is important to know that no matter how experienced you are, mistakes will be part of the trading process.


