Traders indulge into various kind of trading: positional trading, intraday-day trading, scalping, swing trading, etc. Where positional trading is of longer duration, the rest of them are of shorter duration ranging from a day to just couple of minutes to take the required benefits. In order to get the optimum gains they depend on various technical indicators which help them to forecast movement on the basis of given price chart. In the following article you’ll find how a trader can benefit from two basic indicators namely, Bollinger band and ADX in order to get required benefits from swing trading.
Swing trading is a type of trading wherein investors look for quick gains. It is very similar to day trading wherein investors don’t hold their positions with long term scenario. It may be for an hour, a day or couple of days that a swing trader is looking for. Given the opportunities provided by market movement, swing traders enter and exit the market in the same day or may be couple of hours. Hence, in order to capitalize the market moves we should know such indicators which help gain the required return as soon as possible. Bollinger band and ADX (Average Directional Movement Index) are two such technical indicators which help benefit from price swings. Let’s understand them in detail.
Bollinger band: Bollinger band is a widely known technical indicator for swing trading as it indicates the probable turnaround in prices. It consists of three curves which are drawn with the help of moving average and standard deviations. The middle band is a moving average of a definite period, where as the upper and lower bands are standard deviations of the middle line. Generally, Middle band is made up of 20 day moving average while upper and lower band are at 2 standard deviations of the middle band.
Usage: When an underlying moves outside the upper Bollinger band, it is considered "overbought" indicating probable profit booking and price liquidation. Conversely, when an underlying trades below the lower Bollinger band, it is considered “oversold” and indicates prices to cover the losses. In case the underlying quote has moved up from the lower band, then middle band would be the first resistance while sustained trading above middle band would lead the quote towards upper band. In case of quote moving down from the upper band the first support would be middle band, if it fails to sustain that support; lower band would be the next level to watch.
ADX (Average Directional Movement Index or Average Directional Index): While Bollinger band indicates a probable turn around, ADX indicates the strength of the existing price move. ADX is exponential moving average of Directional Index (DX) for a specified period of time. Directional Index is made up of two indicators, namely, positive directional indicator (+DI) and negative directional indicator (–DI). The +DI calculates the strength of upward move while the –DI calculates the strength of downward move. Both of them are being plotted with the ADX in the indicator window between a bounded range of zero and 100. The standard time period used in this indicator is 14 periods. Usage: When the ADX is above 40 level, prevailing trend is considered to be a strong one while in case of ADX trading below 20 level, it indicates a weaker trend. In other words, as far as the ADX line trades above 40 level with upward trend, it indicates continuance of the prevailing trend (Be it Bullish or Bearish) while a down ward turn below 40 level would indicate a probable change in trend. In a same way, if the ADX line is trading below 20 level and showing the sign of increase, the prevailing trend is expected to gain momentum.
In the following article you’ll learn how Bollinger Band and ADX (Average Directional Movement Index) would help in swing trading.
Strategy: If the underlying quote is testing upper or lower band of Bollinger, it is expected to reverse, the strength of reversal can be known with the present level and trend of ADX.
Example 1: If the quote is trading above upper band of Bollinger, look for the ADX if it is ranging downward towards below 40 level then selling pressure is expected with the targets of middle band and then lower band of Bollinger.
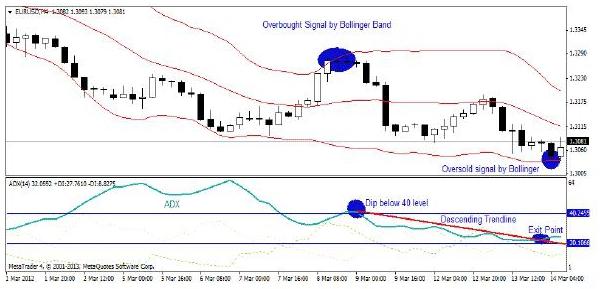
Four Hour Chart: Above mentioned four hourly chart of EURUSD describes how to trade with the help of Bollinger band and ADX. As we can see, the quote crossed the upper band of Bollinger closing above 1.3265, indicating overbought scenario and expectation of profit booking. At the lower panel, a dip below 40 level in ADX also signaled change in the prevailing buying. The trend reversal was supported with the descending trend line on ADX. The quote tested the lower band of Bollinger near 1.3030 indicating a probable turn around in prices. Hence, an investor should book full profits at 1.3030.
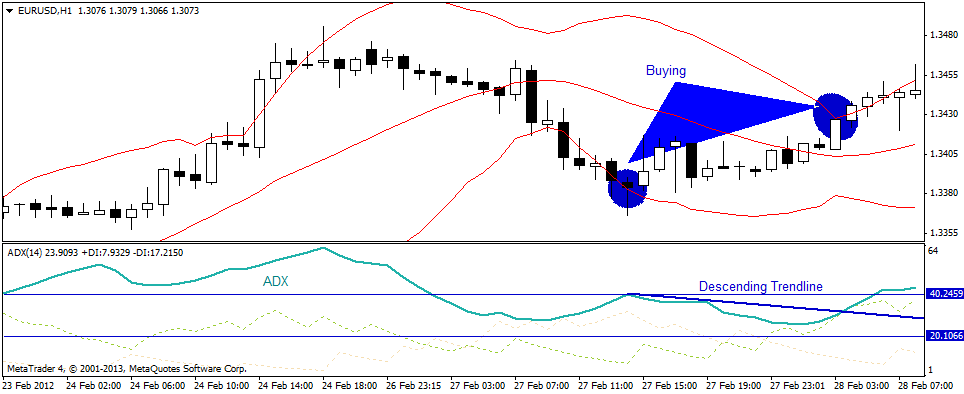
Hourly Chart: Above mentioned hourly chart of EURUSD gives another example of how to trade with the help of ADX and Bollinger band. The quotes traded below the lower band of Bollinger and ADX was also trending downwards indicating a probable trend reversal from the existing liquidation. Hence, by buying at the lower band of Bollinger and drawing a trend line, we should hold our position until the quote tests upper band of Bollinger. As per above mentioned strategy, by buying near 1.3390 and liquidating positions near 1.3430, we can make profits of 40 bps. Example 2: If the prices give breakout from the lower area of Bollinger (or upper area) with ADX ranging upwards from below 20 level, it is expected that prices will trade higher (lower) until the prices gave close above upper band of Bollinger (or below lower band of Bollinger) or the downtick in the ADX, whichever comes first.
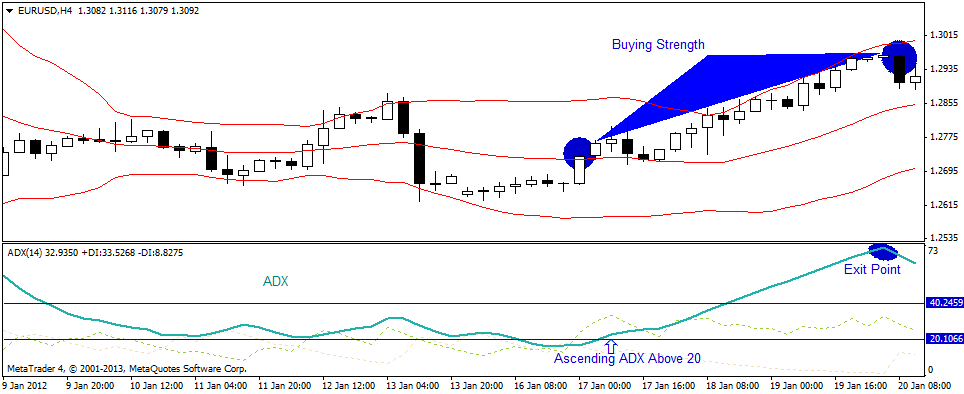
Four Hour Chart: Looking from above mentioned four hourly chart of EURUSD, it can be observed that sudden spurt in EURUSD quote breaking the normal range and forcing the quote to trade above 1.2730 level was well supported by ascending ADX above 20 level. One wouldargue that the quote have touched upper band of Bollinger many a time which should indicateselling, But it should be bear in mind that none of the time it has given a closing above Upper Bollinger Band, merely trading near the upper band would not indicate an overbought market.
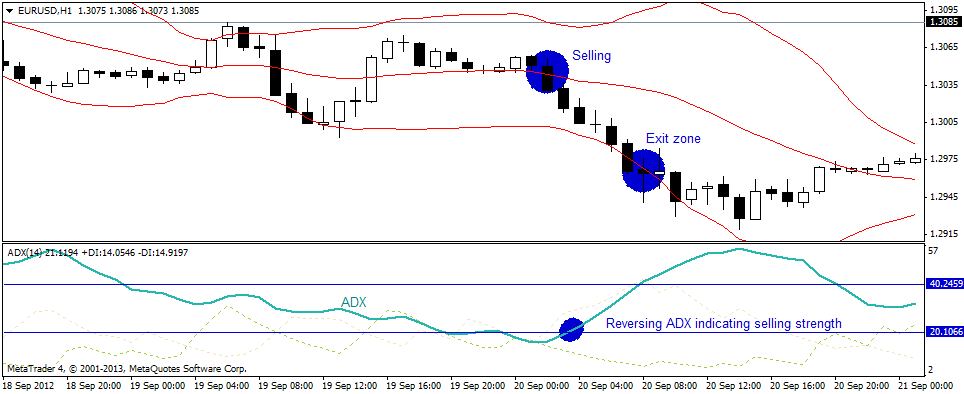
Hourly Chart: Above mentioned hourly chart of EURUSD gives another example of how to trade with the help of ADX and Bollinger band. As the prices were trading in range and sudden spurt of selling initiated, one should look for the ADX which is reversing from 20 level indicating the selling pressure has a strength and would continue. Taking sell position at that level one should have the target of a close below lower Bollinger band. In this example, 60 bps (the difference between 1.3030 and 1.2970) were the gains generated with the help of this strategy.
Rating: 3 out of 5 stars
Feedback: The strategy seems important from the swing trader’s point of view but the point of limitation is stop loss orders. The strategy is mute regarding the point of exit from the existing position in case of adverse price movement. Hence, in order to take due care, it is always expected to use certain other indicators which provide stop loss point in case of adverse price movement.
Information on these pages contains forward-looking statements that involve risks and uncertainties. Markets and instruments profiled on this page are for informational purposes only and should not in any way come across as a recommendation to buy or sell in these assets. You should do your own thorough research before making any investment decisions. FXStreet does not in any way guarantee that this information is free from mistakes, errors, or material misstatements. It also does not guarantee that this information is of a timely nature. Investing in Open Markets involves a great deal of risk, including the loss of all or a portion of your investment, as well as emotional distress. All risks, losses and costs associated with investing, including total loss of principal, are your responsibility. The views and opinions expressed in this article are those of the authors and do not necessarily reflect the official policy or position of FXStreet nor its advertisers. The author will not be held responsible for information that is found at the end of links posted on this page.
If not otherwise explicitly mentioned in the body of the article, at the time of writing, the author has no position in any stock mentioned in this article and no business relationship with any company mentioned. The author has not received compensation for writing this article, other than from FXStreet.
FXStreet and the author do not provide personalized recommendations. The author makes no representations as to the accuracy, completeness, or suitability of this information. FXStreet and the author will not be liable for any errors, omissions or any losses, injuries or damages arising from this information and its display or use. Errors and omissions excepted.
The author and FXStreet are not registered investment advisors and nothing in this article is intended to be investment advice.
Editors’ Picks

EUR/USD holds losses below 1.1650 on renewed USD uptick
EUR/USD is off the low but remains in the red below 1.1650 in European trading on Thursday. The pair faces headwinds from a renewed uptick in the US Dollar amid a negative shift in risk sentiment. Surging energy prices due to the Middle East war keep the bearish pressure intact on the Euro. The US Jobless Claims data are next of note.

GBP/USD stays weak near 1.3350 amid UK stagflation risks
GBP/USD sticks to losses near 1.3350 in the European session on Thursday. The Pound Sterling loses ground amid fears that the United Kingdom economy could face stagflation risks due to higher energy prices, while the US Dollar attracts fresh havem demand ahead of the US Jobless Claims data.

Japanese Yen turns upside down against US Dollar as dovish Fed bets recede
The Japanese Yen gives back its early gains and turns negative against the US Dollar during the European trading session on Thursday. The USD/JPY pair rises to near 157.35 as the US Dollar resumes its upside journey after a corrective move. As of writing, the US Dollar Index trades 0.4% higher to near 99.15.
Editors’ Picks
EUR/USD holds losses below 1.1650 on renewed USD uptick
EUR/USD is off the low but remains in the red below 1.1650 in European trading on Thursday. The pair faces headwinds from a renewed uptick in the US Dollar amid a negative shift in risk sentiment. Surging energy prices due to the Middle East war keep the bearish pressure intact on the Euro. The US Jobless Claims data are next of note.
GBP/USD stays weak near 1.3350 amid UK stagflation risks
GBP/USD sticks to losses near 1.3350 in the European session on Thursday. The Pound Sterling loses ground amid fears that the United Kingdom economy could face stagflation risks due to higher energy prices, while the US Dollar attracts fresh havem demand ahead of the US Jobless Claims data.

Gold climbs near $5,200 as Iran war fuels safe-haven demand
Gold price extends its gains for the second successive session on Thursday as traders seek safety amid the ongoing war in the Middle East. US and Israeli strikes across Iranian territory and widespread Iranian missile and drone retaliation across the Middle East, including attacks on regional targets and military sites, prolong the crisis and its impact.

Top Crypto Gainers: Decred, Zcash, and Dogecoin lead recovery as Bitcoin crosses $72,000
Bitcoin trades above $72,500 at press time on Thursday, holding its 6% gain from the previous day, contributing to a broader market recovery. The total cryptocurrency market capitalization stands at over $2.43 trillion as the broader market sentiment improves significantly.

First Venezuela, now Iran: The US-China energy war escalates Premium
At first glance, the latest escalation involving the United States with both Iran and Venezuela looks like another chapter in a long-running geopolitical story. But viewed through a broader strategic lens, something else may be unfolding: Energy.
RECOMMENDED LESSONS
Making money in forex is easy if you know how the bankers trade!
I’m often mystified in my educational forex articles why so many traders struggle to make consistent money out of forex trading. The answer has more to do with what they don’t know than what they do know. After working in investment banks for 20 years many of which were as a Chief trader its second knowledge how to extract cash out of the market.
5 Forex News Events You Need To Know
In the fast moving world of currency markets where huge moves can seemingly come from nowhere, it is extremely important for new traders to learn about the various economic indicators and forex news events and releases that shape the markets. Indeed, quickly getting a handle on which data to look out for, what it means, and how to trade it can see new traders quickly become far more profitable and sets up the road to long term success.
Top 10 Chart Patterns Every Trader Should Know
Chart patterns are one of the most effective trading tools for a trader. They are pure price-action, and form on the basis of underlying buying and selling pressure. Chart patterns have a proven track-record, and traders use them to identify continuation or reversal signals, to open positions and identify price targets.
7 Ways to Avoid Forex Scams
The forex industry is recently seeing more and more scams. Here are 7 ways to avoid losing your money in such scams: Forex scams are becoming frequent. Michael Greenberg reports on luxurious expenses, including a submarine bought from the money taken from forex traders. Here’s another report of a forex fraud. So, how can we avoid falling in such forex scams?
What Are the 10 Fatal Mistakes Traders Make
Trading is exciting. Trading is hard. Trading is extremely hard. Some say that it takes more than 10,000 hours to master. Others believe that trading is the way to quick riches. They might be both wrong. What is important to know that no matter how experienced you are, mistakes will be part of the trading process.
The challenge: Timing the market and trader psychology
Successful trading often comes down to timing – entering and exiting trades at the right moments. Yet timing the market is notoriously difficult, largely because human psychology can derail even the best plans. Two powerful emotions in particular – fear and greed – tend to drive trading decisions off course.