So read on as we pick out our four must-have Forex indicators for 2015, and explain just why you should be using them every day of your trading life. In no particular order, we start with…
1. Psych Indicator
What It Does
- Displays neat visual aid on your charts
- Tracks market psychology to give clear trading signals
- Measures percentages longs/shorts in a given period
- Seeks to align with dominant market trend
Best Thing About It
- Trades against retail sentiment and trades in line with Banks and smart-money flow.
- Fantastic trend trading system
- Can be used on all timeframes
- Easy to understand, clear signals
- Works extremely well with other indicators to improve entries or even with basic candlestick patterns
What It Looks Like
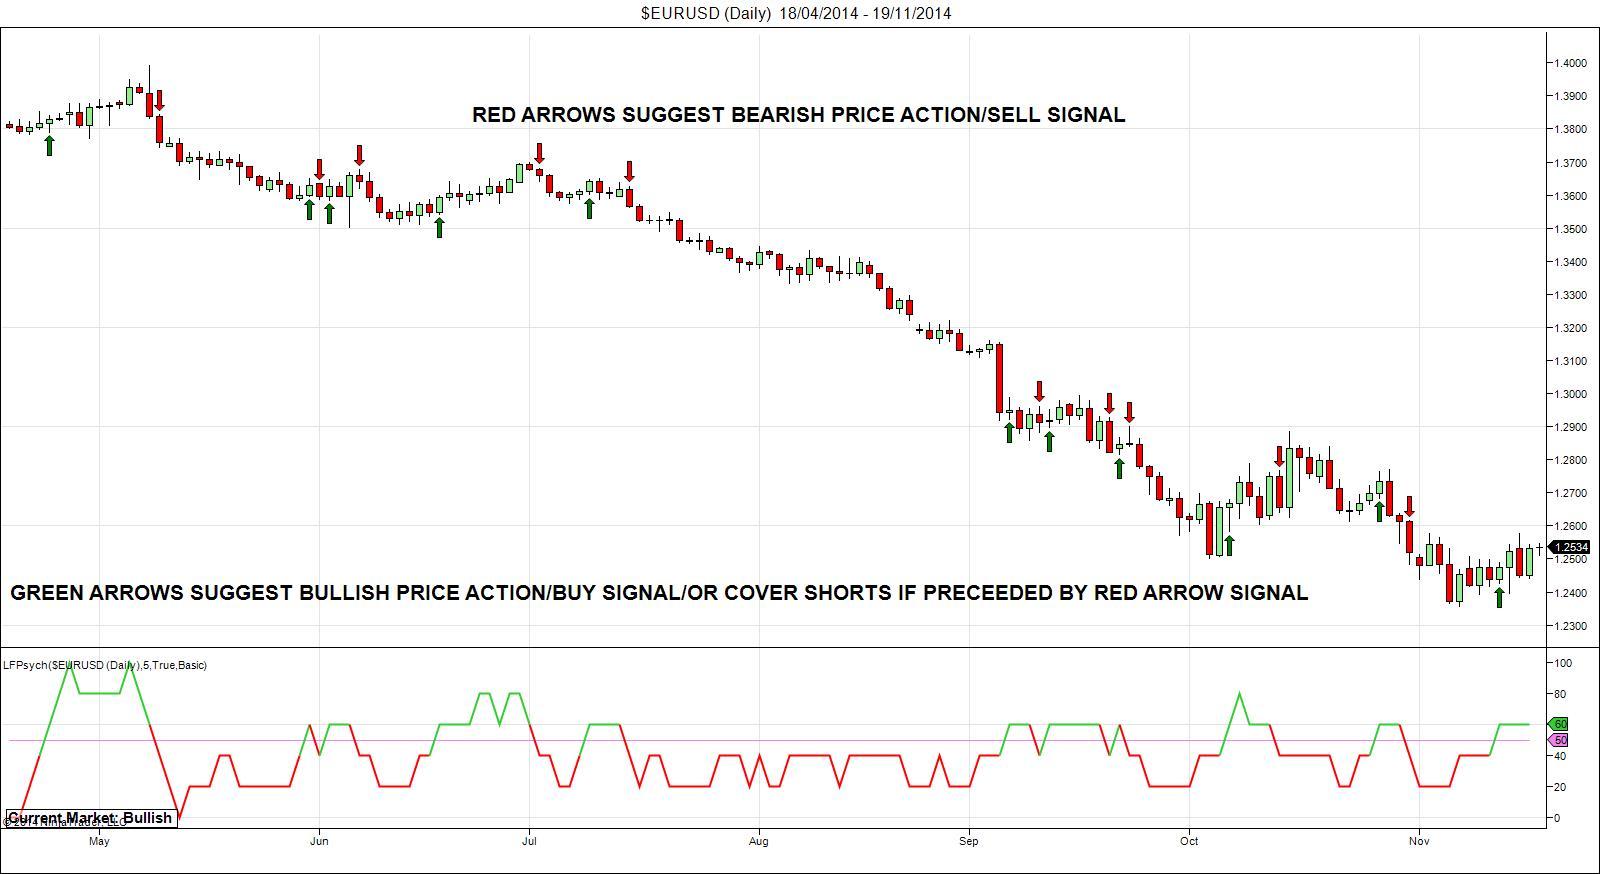
Above we can see an example of the Psych Indicator applied to a candlestick price chart.
The indicator has two key elements to it:
- Firstly, the oscillator in the bottom panel, this oscillator is a pictorial representation of the extremes and mid points of the market psychology. Readings above 80 and below 20 suggest extremes in market participants psychology and suggest the potential for a turning point in the price action.
- Secondly, the arrow alerts that appear on the chart, these arrows suggest a psychological pattern that gives a high probability of price action to follow the candle that the arrow prints above or below. So when a green arrow prints we anticipate bullish price action to follow and when a red arrow prints we anticipate a bearish price action to follow.
Video – More Info
2. LFX Order Flow Trader
What It Does
- Tracks orders in the market to anticipate price movements
- Combines Order Flow techniques with trend following
- Displays neat visual aid on your charts
Best Thing About It
- Made OVER 39,000 Pips in 2014 across six pairs
- Extremely easy to use and very powerful
- Works on all timeframes
- With minor tweaks and optimising per underlying asset, it can make 20% per underlying per year on low to moderate risk
- Could be the only trading product you ever need
What It Looks Like
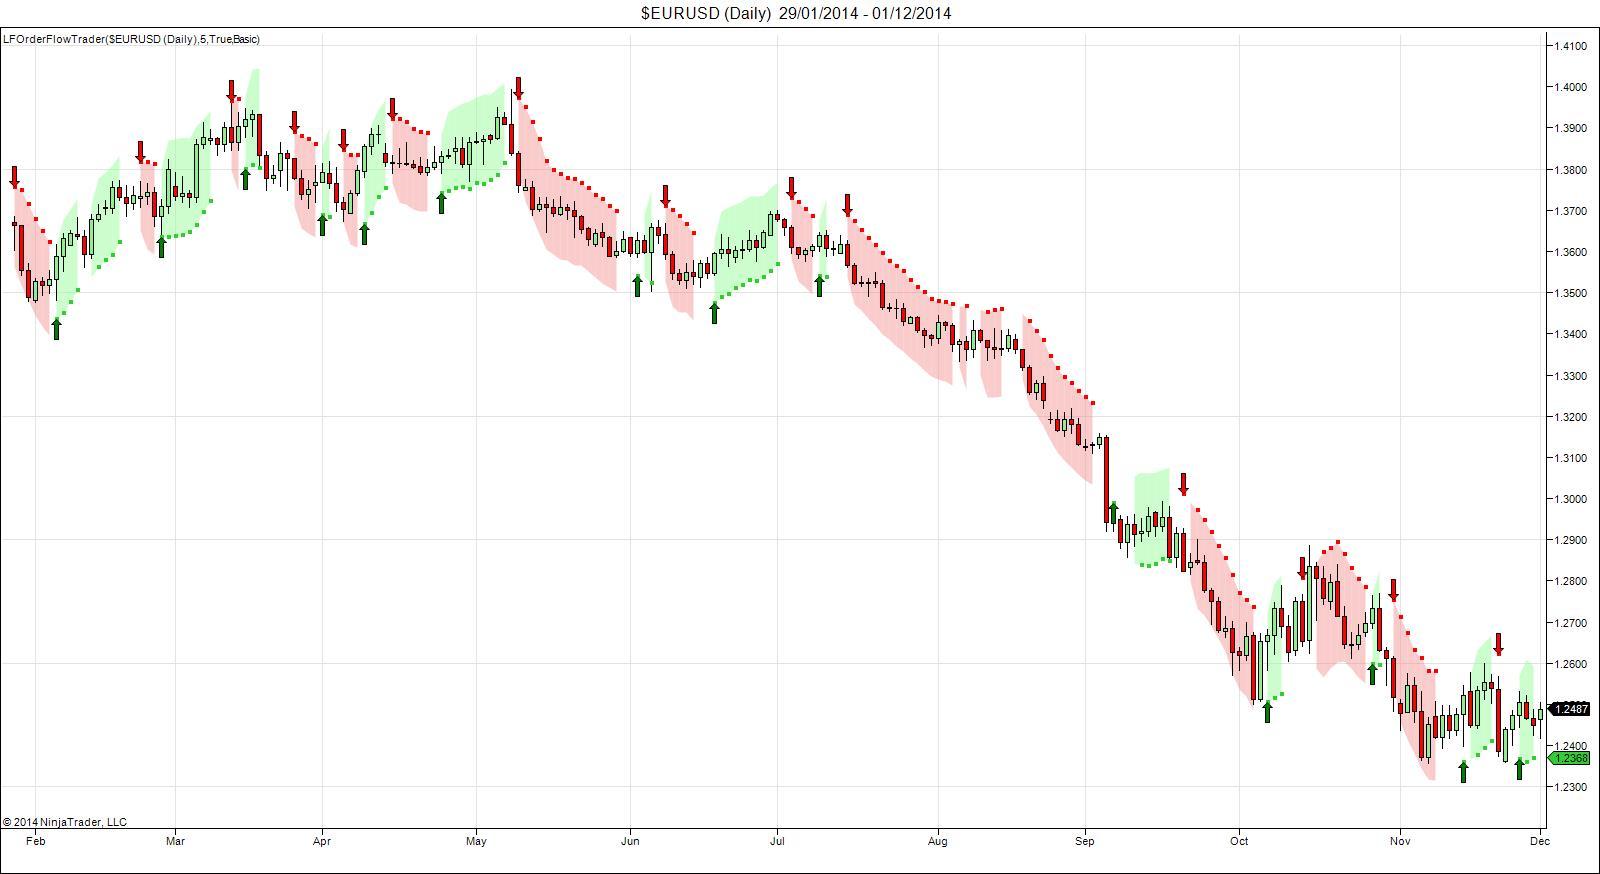
In the chart example above we can see how the Order Flow Trader indicator is represented on our price charts.
The indicator has two key elements to it:
- The indicator creates a pictorial representation of the order flow positioning of the larger market participants It does this in two ways primarily it creates an arrow alert that alerts us to a change in flow green represents buying pressure and red represents selling pressure.
- The second aspect of the indicator which serves as a continuous confirmation or filter is the shading and dot representation on the charts. Once a green/buying pressure arrow appears the next candle if it confirms the continuation of the current order flow will print a dot under the candle and a shaded area around the candle of the same colour as the order flow direction.
Video – More Info
3. Pin Bar Indicator
What It Does
- Automatically highlights Pin Bar on your charts
- Neat, clear visual aid
- Marks entries, stop loss and reward targets on your charts automatically
Best Thing About It
- Scans markets for pin bars so you don’t have to spend hours scouring the screens and ensures you don’t miss any trades
- Fully customisable so you can find and set the parameters for your optimum pin bars
- Works brilliantly with other indicators for high-probability trade setups.
- Extremely effective on all timeframes
What It Looks Like
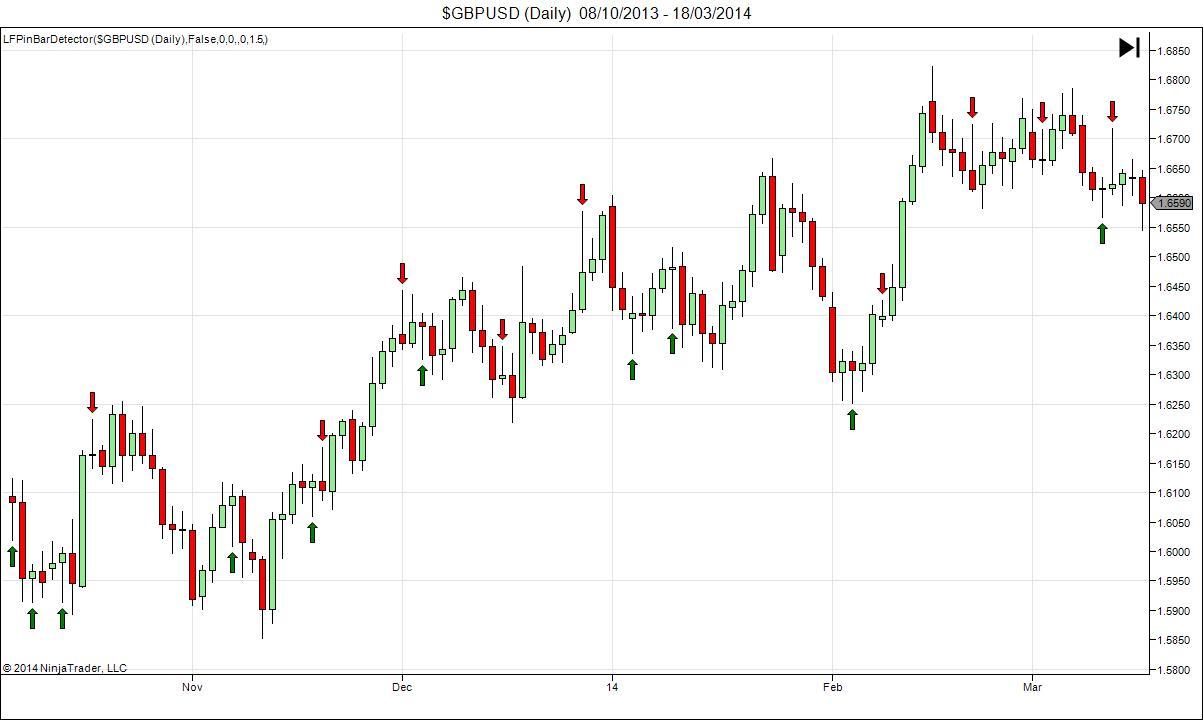
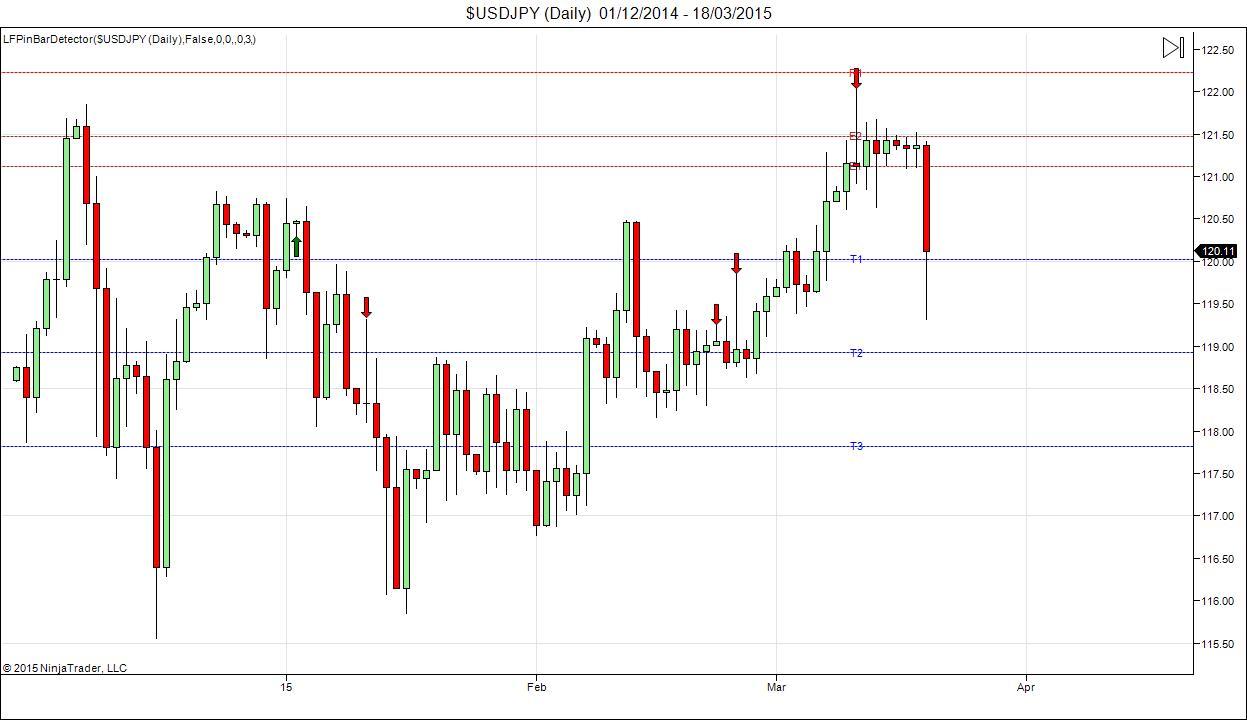
There Are Two Key Elements To This Indicator:
- In the first chart above you can see the Pin Bar detector highlighting Pin Bars with Red arrows for bearish pin bars and green arrows for bullish pin bars.
- In the second chart above you can see the Pin Bar detector markers highlighting the Entry, Stop Loss and reward levels for the Pin Bar.
Video – More Info
4. COT Indicator
What It Does
- Automatically downloads weekly COT data from C.F.T.C report
- Displays clear and easy-to-read measure of positioning both current and historical
- Maps the direction of market participants
Best Thing About It
- Used within many funds and hedge funds to generate consistent annual returns
- If used on 4 or 5 key underlying assets on basic 182 day settings, you can easily return 10% per underlying on low to moderate risk per year. As a retail trader you can use leverage and easily multiply this.
- Means you don’t have to spend time deciphering the weekly data which can be daunting
- Gives you a clear directional guide of where Banks & Institutions are trading
- Allows you to track historical positioning against historical price movement to build profitable trading strategies easily.
What It Looks Like
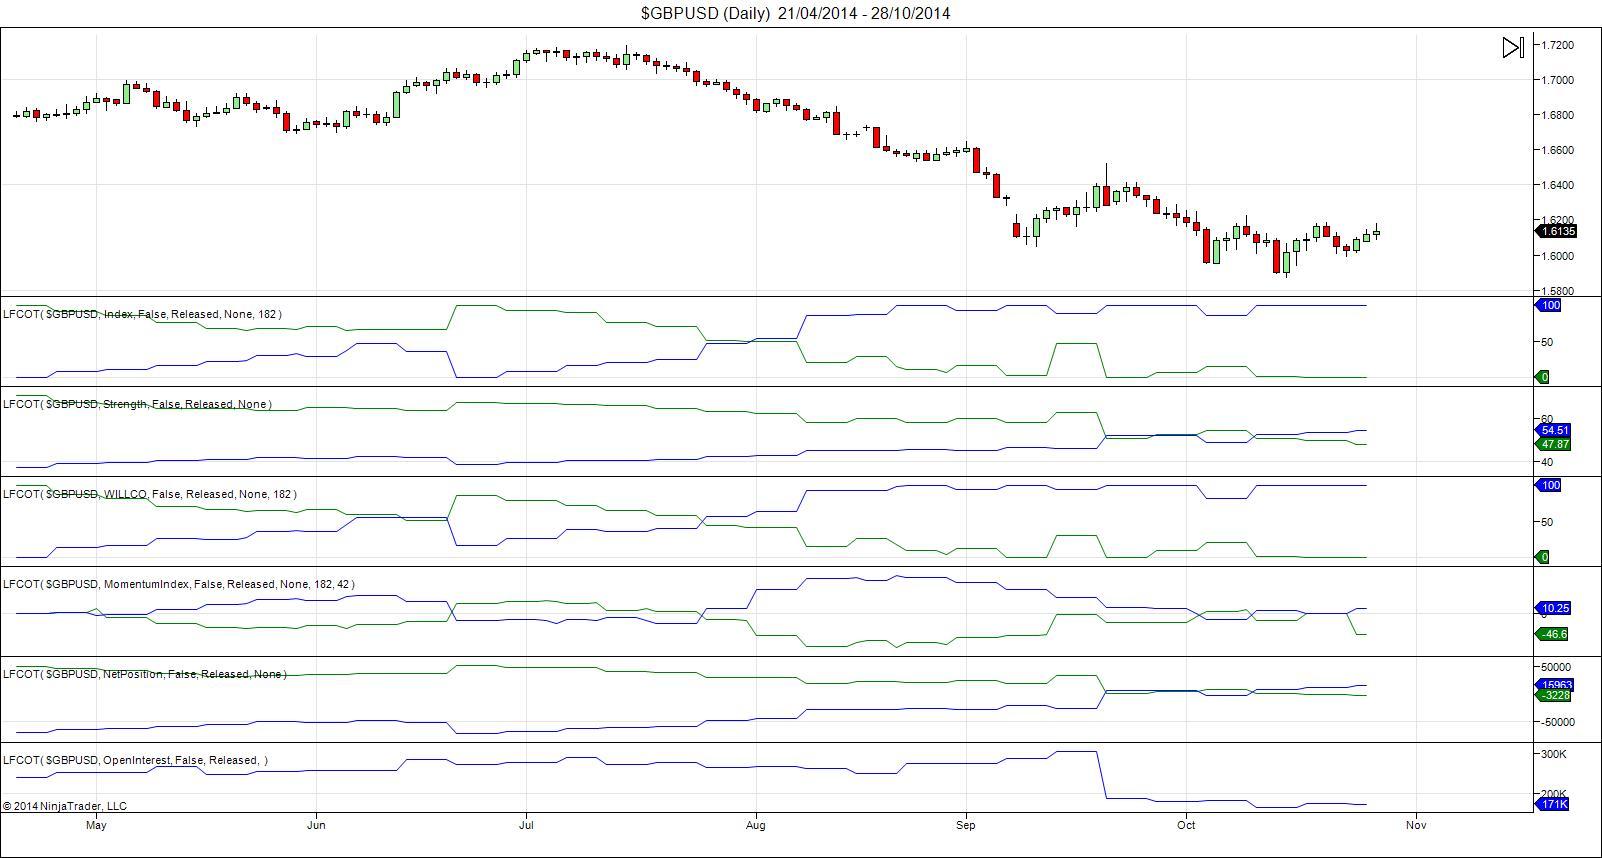
In the above chart we can see the COT indicator represented in the 6 panels featuring blue and green lines. Each panel is tracking a different measurement
Index – A normal stochastic on net positioning
Strength – Simply the net long position over the total net position, indicating the strength of the movement in overall positions
Momentum – Represents the difference between current Index and same Index 6 periods ago to provide a reference for trends reaching an end point
Net Position – Shows how the three types of market operator (Commercial, Non-Commercial & speculator) are positioned
WILLCO – An adjusted variation of the Index measure giving a slightly smoother reading
Open Interest – A volume tool showing the amount of open positions in the market
The Indicator Has Two Key Elements To It
- The green line shows the Non-Commercials (Banks & Institutions) that we look to align our trades with and the blue line shows the Commercials ( Corporates, Multi-Nationals) that we want to trade against
- In the chart above we only use green and blue lines for Non-Commercial & Commercial positioning but there is an option in the settings to turn on red lines showing speculators ( leveraged funds & other reportable)
Video – More Info
Editors’ Picks

USD/JPY: Japanese Yen rises as tariff woes rattle markets
USD/JPY slides to test 154.00 in the Asian trading hours on Monday. The Japanese Yen attracts haven demand amid tariff uncertainty, which weighs negatively on market sentiment and the US Dollar.

Gold eyes a daily closing above key 61.8% Fibo resistance
Gold is adding over 1% early Monday, after having gained 2% on Friday. The bright metal scales key technical hurdles, as buyers stay strong amid renewed tariffs and economic uncertainty alongside looming US-Iran geopolitical tensions.

AUD/USD struggles below 0.7100 as trade tensions weigh
AUD/USD eases back below the 0.7100 mark during the Asian session on Monday as trade-related uncertainties continue to sag investors' confidence. However, the downside in the pair ciould be cushioned by a broadly weaker US Dollar and expectations of dfivergent monetary policy outlook between the Fed and the RBA.

Top Crypto Losers: Zcash, Pump.fun, and LayerZero extended losses as Bitcoin loses $65,000
The cryptocurrency market starts the week in panic mode, with altcoins Zcash, Pump.fun, and LayerZero. Bitcoin falls below $65,000 as the US President Donald Trump regroups amid renewed trade policy risks.

Liberation day take two, the tariff machine just changed gears
Let me caveat this from the outset. What we are watching is first-order mechanics, not the grand macro endgame. This is the market’s immediate reflex to a 15% Trump tariff levy dressed up as judicial drama. The Supreme Court blocked Trump tarrif hammer. The White House came back with a scalpel.
RECOMMENDED LESSONS
Making money in forex is easy if you know how the bankers trade!
I’m often mystified in my educational forex articles why so many traders struggle to make consistent money out of forex trading. The answer has more to do with what they don’t know than what they do know. After working in investment banks for 20 years many of which were as a Chief trader its second knowledge how to extract cash out of the market.
5 Forex News Events You Need To Know
In the fast moving world of currency markets where huge moves can seemingly come from nowhere, it is extremely important for new traders to learn about the various economic indicators and forex news events and releases that shape the markets. Indeed, quickly getting a handle on which data to look out for, what it means, and how to trade it can see new traders quickly become far more profitable and sets up the road to long term success.
Top 10 Chart Patterns Every Trader Should Know
Chart patterns are one of the most effective trading tools for a trader. They are pure price-action, and form on the basis of underlying buying and selling pressure. Chart patterns have a proven track-record, and traders use them to identify continuation or reversal signals, to open positions and identify price targets.
7 Ways to Avoid Forex Scams
The forex industry is recently seeing more and more scams. Here are 7 ways to avoid losing your money in such scams: Forex scams are becoming frequent. Michael Greenberg reports on luxurious expenses, including a submarine bought from the money taken from forex traders. Here’s another report of a forex fraud. So, how can we avoid falling in such forex scams?
What Are the 10 Fatal Mistakes Traders Make
Trading is exciting. Trading is hard. Trading is extremely hard. Some say that it takes more than 10,000 hours to master. Others believe that trading is the way to quick riches. They might be both wrong. What is important to know that no matter how experienced you are, mistakes will be part of the trading process.
The challenge: Timing the market and trader psychology
Successful trading often comes down to timing – entering and exiting trades at the right moments. Yet timing the market is notoriously difficult, largely because human psychology can derail even the best plans. Two powerful emotions in particular – fear and greed – tend to drive trading decisions off course.

