Have you ever had a trading strategy that just started losing? Maybe, you spent hours and hours coding, testing and watching the markets in a demo environment. Then, you finally turn your strategy live, and it just starts losing right out of the gate?
What do you do now?
Do you keep trading it? Do you stop?
Was there something wrong with your testing or programming?
I am not going to dig into this last question today, but I would like to address what you can and should do now.
What do you do when your trading strategy starts losing?
I may start to sound like a broken record but having a method for turning on and off a trading strategy is one of the most important aspects of trading. Knowing whether the drawdown is a normal part of your trading strategy, or if it is something different, is extremely important to protect your account from losing more than it needs to.
Here is an example of a strategy that started to fail right after being deployed (on a live money Forex account). As you can see, the account may have been levered up too much to have such a drop so quickly. There is no real excuse for losing 25% after three trades, is there?
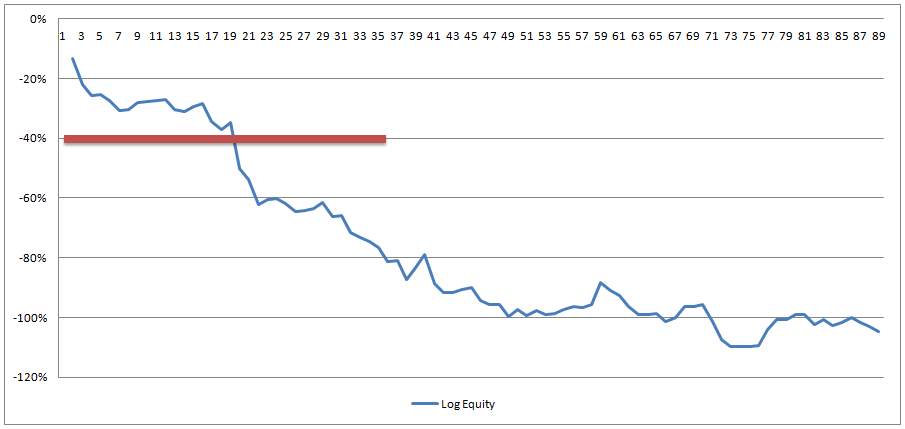
So, when does the trader shut the strategy down?
Do you base that decision on the actual trading vs. the historical results? In this case, if the maximum drawdown was 40% historically, then you would stop trading as soon as the drawdown in the account is great than that, say 45%?
What if there was a really simple way to tell when to stop trading a strategy that doesn’t wait until you lose all that money?
Trading the equity curve is a great way to know when to turn on and off a trading strategy. The basics of equity curve trading are quite simple. When your current equity is above its moving average, you trade as you normally would. If it is below, you stop trading, trade in a demo account or trade the minimum trade size available.
In essence, you can use the moving average to determine whether or not to take the next trade, and you can also use it to determine whether to trade larger or smaller volumes.
Of course, equity curve trading requires that your trading history has some sort of pattern in it. Meaning, winning trades tend to follow winning trades and losing trades tend to follow losing trades.
Here is the same trader’s equity curve with 10 and 20 trade moving averages added.
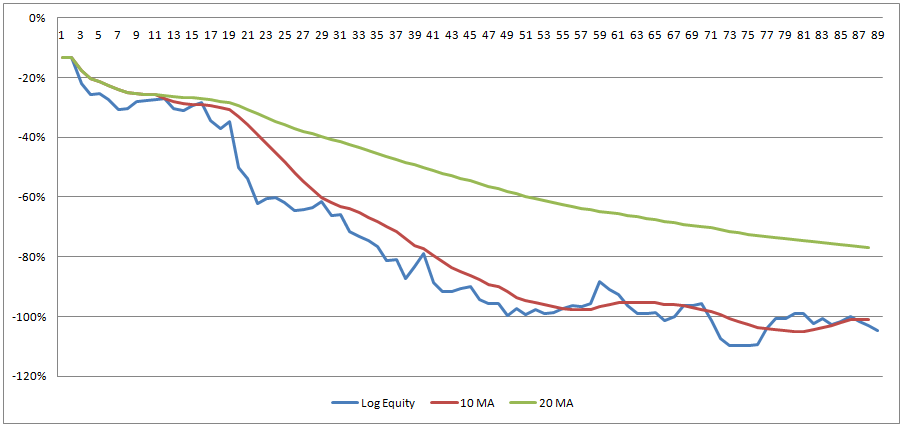
If you are familiar with trading with moving averages, you already have a good idea of when this trader should have turned off this strategy just by looking at this chart. This trader was instantly under both moving averages as soon as trading started in this account. That is a clear indication to stop trading.
Maybe, he should have switched back to trading this strategy in a demo account while under the moving average. If, in the future, the strategy begins performing again and the equity curve goes above its moving average, he can deploy to live trading again.
Two moving averages are shown above because you should be sure both “scenarios” are telling a similar story. These certainly are! They are shouting, “stop trading!”
If a small change to the moving average would affect the signal to turn on/off the trading strategy, then, you should not be very confident in using this method.
How about seeing the affect on actual profits and losses?
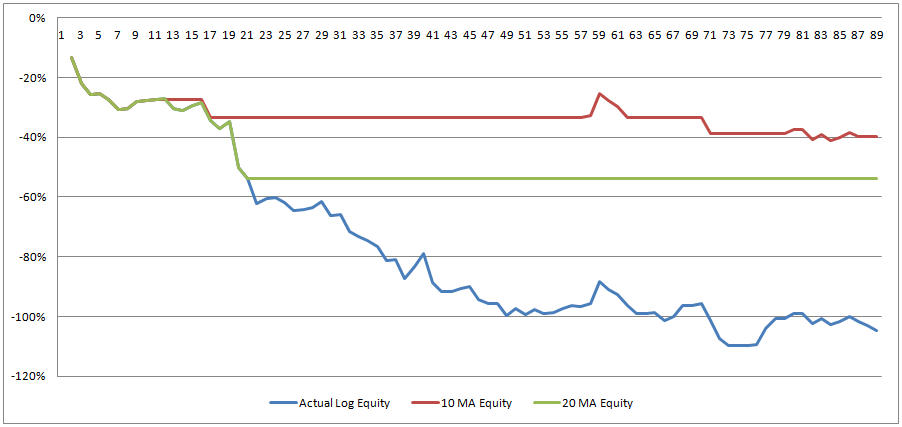
These are by no means pretty equity curves, BUT compared to the actual equity curve, they should be seen as nothing short of amazing!
Instead of losing 105% of the traders account (using the 10 MA equity curve trading strategy), this trader would have only lost 40% of his trading account. The 20 trade moving average version would have fared worse at a loss of 54%. Both are significantly better than the actual performance.
Most of the losses are due to including the performance for the trades before the moving average length. We don’t know the average of 10 trades until we have 10 trades so we trade until we have enough data.
You may be asking how a trader can lose more than 100% of his account. Does that even make sense? Well this trader lost most of his account and added more funds to keep trading. If he had used equity curve trading to manage his account, he would be in a much better position right now, don’t you think?
But what if you wanted something that works faster?
What if you don’t want to wait until you have traded 10, 20 or more trades to know if you should keep your, recently turned live, strategy active?
Well, you could start your moving average as soon as you start trading and not wait the full minimum number of trades. If you are just turning a strategy on live, it might be a good idea not to wait.
How does not waiting the full “warm up period” (10 or 20 trades) affect the performance?
Let’s find out.
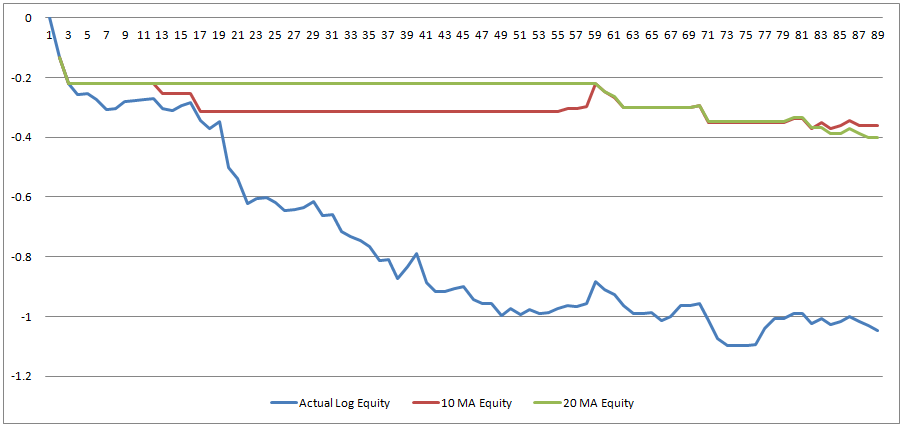
Of course, we had to wait two trades to get an average, and boy that did hurt. Those first two trades accounted for a loss of 22%. Overall, using this strategy allowed the trader to save a significant amount of his account, ending up with a loss of 36% (vs. the 105% loss of the actual trading). This is using the 10 length moving average method.
If this trader would have followed the 20 trade moving average, his strategy would have remained off longer initially but then lost a little more near the end. That would have lead to only a loss of 40% of his account vs. the full 105% loss.
As you can see, using equity curve trading along with your existing trading strategy, can be very useful for lowering drawdowns. It is also a great method for knowing when to turn on and off a trading strategy. Remember, this works best for trading strategies where wins and losses tend to run in streaks historically.
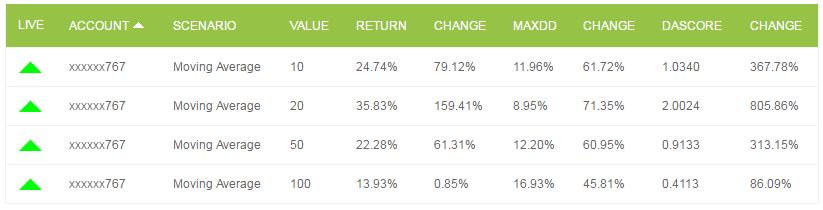
Daticks trading dashboard offers an easy way to see when each of the scenarios (moving averages in the example) are above their respective threshold. A green up arrow shows that your current equity is above each of the available moving averages.

Daticks data analysis trading dashboard and all analysis are for educational and illustrative purposes and do not imply a recommendation or solicitation to buy or sell a particular security or engage in any particular investment strategy. The projections or other information regarding the likelihood or various investment outcomes are hypothetical in nature, are not guaranteed for accuracy or completeness, do not reflect actual investment results and are not guarantees of future results. Forex trading involves significant risk of loss and is not suitable for all investors. Increasing leverage increases risk. Before deciding to trade Forex, you should carefully consider your financial objectives, level of investing experience, and ability to take financial risks. Any opinions, news, research, analysis, prices or other information contained does not constitute investment advice.
Editors’ Picks

EUR/USD tests nine-day EMA support near 1.1850
EUR/USD remains in the negative territory for the fourth successive session, trading around 1.1870 during the Asian hours on Friday. The 14-day Relative Strength Index momentum indicator at 56 stays above the midline, confirming steady momentum. RSI has eased but remains above 50, indicating momentum remains constructive for the bulls.

GBP/USD consolidates around 1.3600 vs. USD; looks to US CPI for fresh impetus
The GBP/USD pair remains on the defensive through the Asian session on Friday, though it lacks bearish conviction and holds above the 1.3600 mark as traders await the release of the US consumer inflation figures before placing directional bets.

USD/JPY rebounds above 153.00 ahead of US inflation data
USD/JPY stages a comeback and regains 153.00 in the Asian session, snapping a four-day losing streak amid some repositioning ahead of the US CPI report. However, expectations that Japan's PM Sanae Takaichi could be more fiscally responsible, along with bets that the BoJ will stick to its policy normalization path and the risk-off mood, could support the safe-haven Japanese Yen, capping the pair's upside.
Editors’ Picks
USD/JPY rebounds above 153.00 ahead of US inflation data
USD/JPY stages a comeback and regains 153.00 in the Asian session, snapping a four-day losing streak amid some repositioning ahead of the US CPI report. However, expectations that Japan's PM Sanae Takaichi could be more fiscally responsible, along with bets that the BoJ will stick to its policy normalization path and the risk-off mood, could support the safe-haven Japanese Yen, capping the pair's upside.

Gold: Will US CPI data trigger a range breakout?
Gold retakes $5,000 early Friday amid a turnaround from weekly lows as US CPI data loom. The US Dollar consolidates weekly losses as AI concerns-driven risk-off mood stalls downside. Technically, Gold appears primed for a big range breakout, with risks skewed toward a bullish break.

AUD/USD consolidates below 0.7100 as traders await US CPI report
AUD/USD consolidates the previous day's retracement slide from the vicinity of mid-0.7100s, or a three-year high, holding below 0.7100 as traders move to the sidelines ahead of Friday's release of the US consumer inflation figures. In the meantime, the divergent RBA-Fed outlooks might continue to support spot prices amid subdued US Dollar demand, though the risk-off impulse could act as a headwind for the Aussie.

Bitcoin, Ethereum and Ripple stay weak as bearish momentum persists
Bitcoin, Ethereum and Ripple remain under pressure, extending losses of over 5%, 6% and 4%, respectively, so far this week. BTC trades below $67,000 while ETH and XRP correct after facing rejection around key levels. With bearish momentum persisting and prices staying weak, the top three cryptocurrencies continue to show no clear signs of a sustained recovery.

A tale of two labour markets: Headline strength masks underlying weakness
Undoubtedly, yesterday’s delayed US January jobs report delivered a strong headline – one that surpassed most estimates. However, optimism quickly faded amid sobering benchmark revisions.
RECOMMENDED LESSONS
Making money in forex is easy if you know how the bankers trade!
I’m often mystified in my educational forex articles why so many traders struggle to make consistent money out of forex trading. The answer has more to do with what they don’t know than what they do know. After working in investment banks for 20 years many of which were as a Chief trader its second knowledge how to extract cash out of the market.
5 Forex News Events You Need To Know
In the fast moving world of currency markets where huge moves can seemingly come from nowhere, it is extremely important for new traders to learn about the various economic indicators and forex news events and releases that shape the markets. Indeed, quickly getting a handle on which data to look out for, what it means, and how to trade it can see new traders quickly become far more profitable and sets up the road to long term success.
Top 10 Chart Patterns Every Trader Should Know
Chart patterns are one of the most effective trading tools for a trader. They are pure price-action, and form on the basis of underlying buying and selling pressure. Chart patterns have a proven track-record, and traders use them to identify continuation or reversal signals, to open positions and identify price targets.
7 Ways to Avoid Forex Scams
The forex industry is recently seeing more and more scams. Here are 7 ways to avoid losing your money in such scams: Forex scams are becoming frequent. Michael Greenberg reports on luxurious expenses, including a submarine bought from the money taken from forex traders. Here’s another report of a forex fraud. So, how can we avoid falling in such forex scams?
What Are the 10 Fatal Mistakes Traders Make
Trading is exciting. Trading is hard. Trading is extremely hard. Some say that it takes more than 10,000 hours to master. Others believe that trading is the way to quick riches. They might be both wrong. What is important to know that no matter how experienced you are, mistakes will be part of the trading process.
The challenge: Timing the market and trader psychology
Successful trading often comes down to timing – entering and exiting trades at the right moments. Yet timing the market is notoriously difficult, largely because human psychology can derail even the best plans. Two powerful emotions in particular – fear and greed – tend to drive trading decisions off course.