![]() Littlefish FX Analysts
Littlefish FX Analysts
Littlefish FX
It’s time to take a look at Bollinger bands. And no, unfortunately, it’s nothing to do with champagne.
Bollinger bands are a technical analysis tool invented by John Bollinger. (Who also wrote the imaginatively titled book Bollinger on Bollinger Bands). Basically, they work by measuring the “highness” or “lowness” of a price, compared to previous trades.
They’re made up of a moving average with upper and lower bands based on standard deviations.
FOR EXAMPLE…
A common setting for a Bollinger band is a 20 period moving average with the upper and lower bands set at 2 standard deviations.
Why Use Standard Deviations?
Standard deviations can be used to gives you an idea of how much the price you are looking at varies from the average over a period of time.
In a totally random set of results, you would expect to see 95% of all results falling within 2 standard deviations, and more than 99% to be within 3. So applying this to trading, IF price is completely random, then there’s a very good chance that the next price the market makes will fall somewhere between the upper and lower Bollinger bands.
Of course, this all depends on price being random, and whether this is true or not is an argument for another day. However, even if price is not random, Bollinger bands are still useful to provide an indication of how far price is likely to move in a certain period.
How To Make Bollinger Bands Work For You
Bollinger bands can be applied to both trending and non-trending markets using a slightly different strategy for each environment. Let’s take a look at both, and the best ways to analyse them…
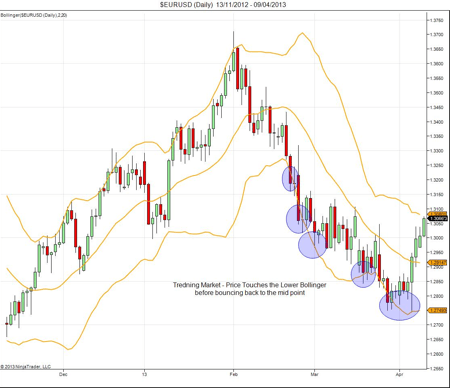
1. Trending Markets
In a trending market, price will be pushing in a particular direction, pushing on either the upper or lower Bollinger band, depending what direction it’s moving in.
This is shown in the chart below:
HOW TO DO IT:
In a trending market, the best way to use Bollinger bands is through the pull back strategy.
Bollinger bands can allow you to use a pull back towards the moving average to enter into the direction of the trend.
WHY IT’S USEFUL:
Using Bollinger bands in this way allows you to run tight stops, in order to capture the trend.
DON’T FORGET:
This works particularly well on lower time frames. When used with good risk/reward management, it can be a really good strategy for use on highly traded pairs (like the EURUSD).
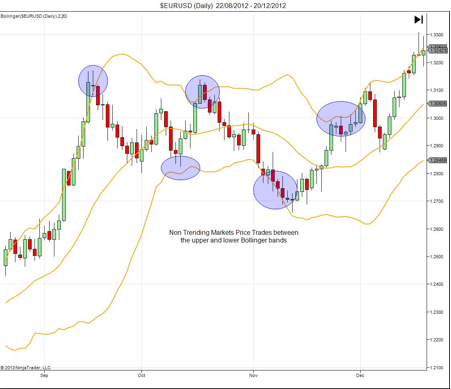
2. Non-Trending Markets
In a non-trending market (also known as range bound or choppy), Bollinger bands can act as barriers to price, as shown in the chart:
HOW TO DO IT:
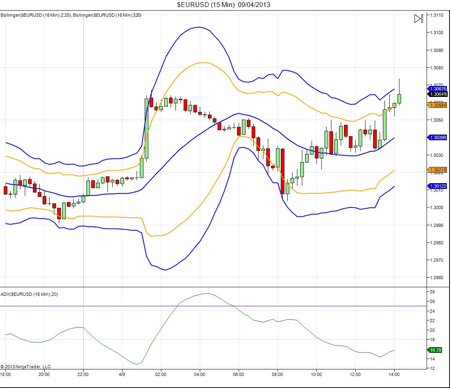
In a range bound or low volatility environments, you need to use Bollinger bands as a guide to how the price may move. You can do this using the fading strategy.
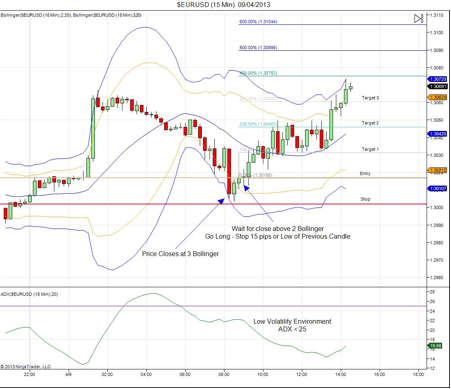
To do this, you need to look for an extreme price movement in low volatility, and then take the opposite position. Then, plot the 20 period moving average, and the 2 and 3 standard deviations on the chart, as shown below:
The final step is to look for the price to hit the outer Bollinger, then move back into the Bollinger range. It if breaks or closes above the inner Bollinger, you can then get in the direction towards the moving average.
Here’s an example of what might happen:
WHY IT’S USEFUL:
This strategy allows you to use relatively tights stops on lower time frames to capture a fade in the opposite direction.
DON’T FORGET:
To make sure you’re in a low volatility environment before using this strategy. (You can do this using ADX or an Awsome Oscilator, or get clues from your moving averages or MACD).
All comments, charts and analysis on this website are purely provided to demonstrate our own personal thoughts and views of the market and should in no way be treated as recommendations or advice. Please do not trade based solely on any information provided within this site, always do your own analysis.
Editors’ Picks

EUR/USD remains offered below 1.1800, looks at US data
EUR/USD is still trading on the defensive in the latter part of Thursday’s session, while the US Dollar maintains its bid bias as investors now gear up for Friday’s key release of the PCE data, advanced Q4 GDP prints and flash PMIs.

GBP/USD seems vulnerable near one-month low vs. USD as traders await US data
The GBP/USD pair prolongs its weekly downtrend for the fifth consecutive day on Friday and slides back closer to a nearly one-month low, touched the previous day. Spot prices trade below mid-1.3400s during the Asian session on Friday and seem vulnerable to slide further as traders now look to important US macro data for a fresh impetus.

USD/JPY remains strong after Japan’s National CPI cools down
The Japanese Yen shows weakness against the US Dollar during the Asian trading session on Friday. The USD/JPY pair holds onto gains near its weekly high of 155.20 posted on Thursday. The pair is under pressure as the US Dollar continues to outperform due to signals from Federal Open Market Committee Minutes of the January policy meeting that officials see no rush for interest rate cuts, with inflation remaining persistently above the Federal Reserve’s 2% target.
Editors’ Picks

AUD/USD hangs near two-week low vs. firmer USD ahead of key US macro releases
The AUD/USD pair meets with a fresh supply during the Asian session on Friday and remains well within striking distance of a nearly two-week low, touched the previous day. Spot prices currently trade around the 0.7035 area as traders look to the key US macro releases before placing fresh directional bets.
USD/JPY remains strong after Japan’s National CPI cools down
The Japanese Yen shows weakness against the US Dollar during the Asian trading session on Friday. The USD/JPY pair holds onto gains near its weekly high of 155.20 posted on Thursday. The pair is under pressure as the US Dollar continues to outperform due to signals from Federal Open Market Committee Minutes of the January policy meeting that officials see no rush for interest rate cuts, with inflation remaining persistently above the Federal Reserve’s 2% target.

Gold eyes next breakout on US GDP, PCE inflation data
Gold sticks to recent gains around the $5,000-mark early Friday, biding time before the high-impact US macro events. The focus is now on the US fourth-quarter Gross Domestic Product, core Personal Consumption Expenditures Price Index and the Supreme Court’s ruling on President Donald Trump’s tariffs.

CME Group to make crypto products available for 24/7 trading in May
The Chicago Mercantile Exchange Group has announced plans to extend trading hours for its regulated cryptocurrency futures and options to 24/7, starting May 29, pending regulatory approval.

Hawkish Fed minutes and a market finding its footing
It was green across the board for US Stock market indexes at the close on Wednesday, with most S&P 500 names ending higher, adding 38 points (0.6%) to 6,881 overall. At the GICS sector level, energy led gains, followed by technology and consumer discretionary, while utilities and real estate posted the largest losses.
RECOMMENDED LESSONS
Making money in forex is easy if you know how the bankers trade!
I’m often mystified in my educational forex articles why so many traders struggle to make consistent money out of forex trading. The answer has more to do with what they don’t know than what they do know. After working in investment banks for 20 years many of which were as a Chief trader its second knowledge how to extract cash out of the market.
5 Forex News Events You Need To Know
In the fast moving world of currency markets where huge moves can seemingly come from nowhere, it is extremely important for new traders to learn about the various economic indicators and forex news events and releases that shape the markets. Indeed, quickly getting a handle on which data to look out for, what it means, and how to trade it can see new traders quickly become far more profitable and sets up the road to long term success.
Top 10 Chart Patterns Every Trader Should Know
Chart patterns are one of the most effective trading tools for a trader. They are pure price-action, and form on the basis of underlying buying and selling pressure. Chart patterns have a proven track-record, and traders use them to identify continuation or reversal signals, to open positions and identify price targets.
7 Ways to Avoid Forex Scams
The forex industry is recently seeing more and more scams. Here are 7 ways to avoid losing your money in such scams: Forex scams are becoming frequent. Michael Greenberg reports on luxurious expenses, including a submarine bought from the money taken from forex traders. Here’s another report of a forex fraud. So, how can we avoid falling in such forex scams?
What Are the 10 Fatal Mistakes Traders Make
Trading is exciting. Trading is hard. Trading is extremely hard. Some say that it takes more than 10,000 hours to master. Others believe that trading is the way to quick riches. They might be both wrong. What is important to know that no matter how experienced you are, mistakes will be part of the trading process.
The challenge: Timing the market and trader psychology
Successful trading often comes down to timing – entering and exiting trades at the right moments. Yet timing the market is notoriously difficult, largely because human psychology can derail even the best plans. Two powerful emotions in particular – fear and greed – tend to drive trading decisions off course.