What are the key trends to watch in the stock market in the next six months? We've identified two intermediate-term trends to keep a close eye on for your portfolio management and hedging as well as for opportunistic trading. These are areas that we watch closely in our MPTrader Trading Room on a variety of chart timeframes, as well as through the lens of geopolitical and macroeconomic indicators. They are: 1). China Bull, and 2). Downtrend in Banks.
1. China Bull
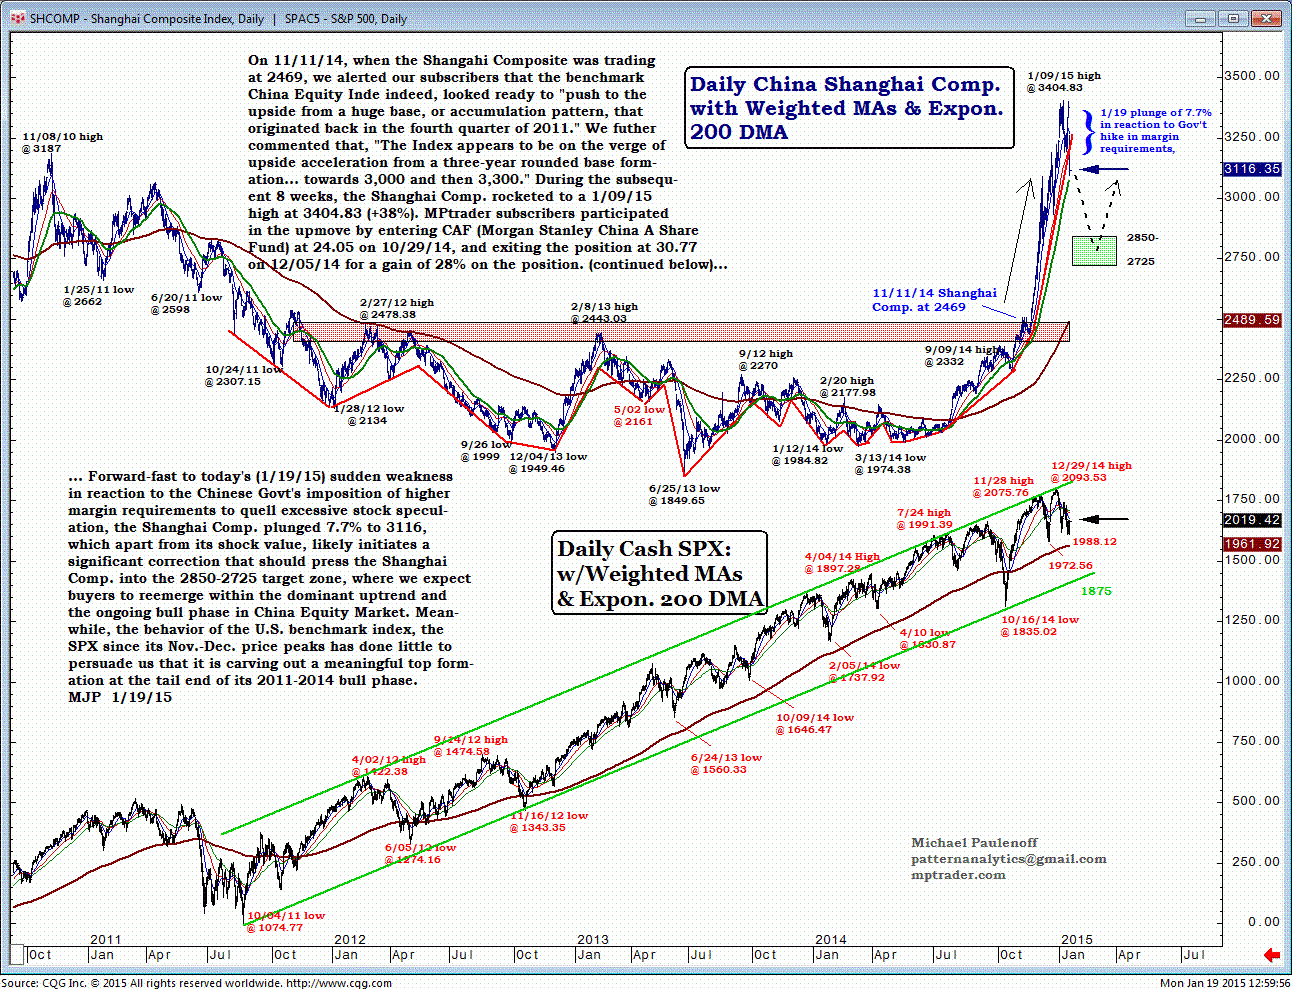
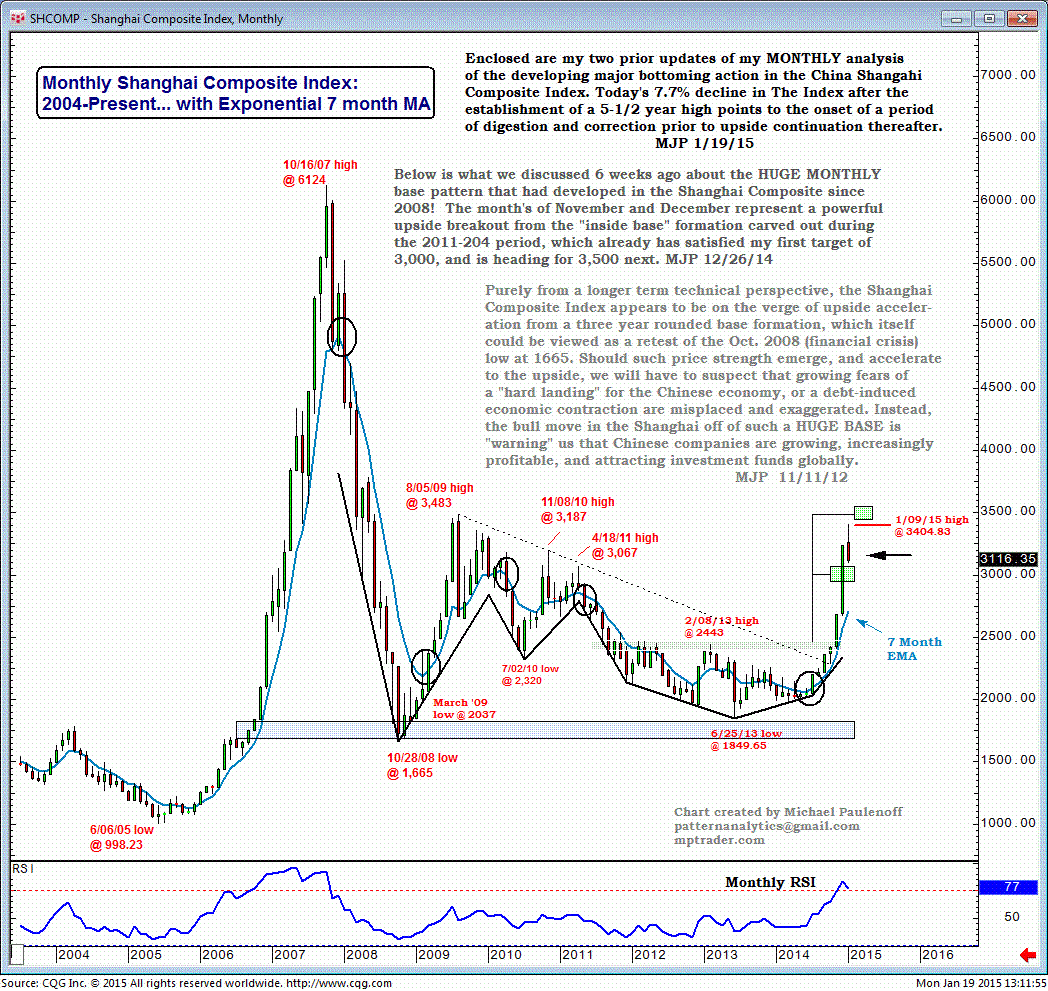
In mid-November, when the Shanghai Composite was trading at 2469, we selected the benchmark China equity index as one of the key areas to watch intermediate-term for a breakout into a bullish period.
We noted that it looked ready to "push to the upside from a huge base, or accumulation pattern, that originated back in the fourth quarter of 2011." We further commented that "the Index appears to be on the verge of upside acceleration from a three-year rounded base formation" and indicated targets of 3,000 and then 3,300.
During the subsequent eight weeks, the Shanghai Composite rocketed to a January 9 high at 3404.83 (+38%). MPTrader subscribers participated in the upmove by entering CAF (Morgan Stanley China A Share Fund) at 24.05 on October 29, and exiting the position at 30.77 on December 5 for a gain of 28% on the position.
Forward-fast to this past Monday's (Jan 19) sudden weakness in reaction to the Chinese Government's imposition of higher margin requirements to quell excessive stock speculation. The Shanghai Composite plunged 7.7% to 3116, which apart from its shock value, likely initiates a significant correction that should press the Shanghai Composite into the 2850-2725 target zone.
At that point we expect buyers to re-emerge within the dominant uptrend and the ongoing bull phase in China equity market, with our next target at 3500.
We suspect that growing fears of a "hard landing" for the Chinese economy, or a debt-induced economic contraction, are misplaced and exaggerated. Instead, the bull move in the Shanghai off of such a huge base is "warning" us that Chinese companies are growing, increasingly profitable, and attracting investment funds globally.
2. Downtrend in Banks
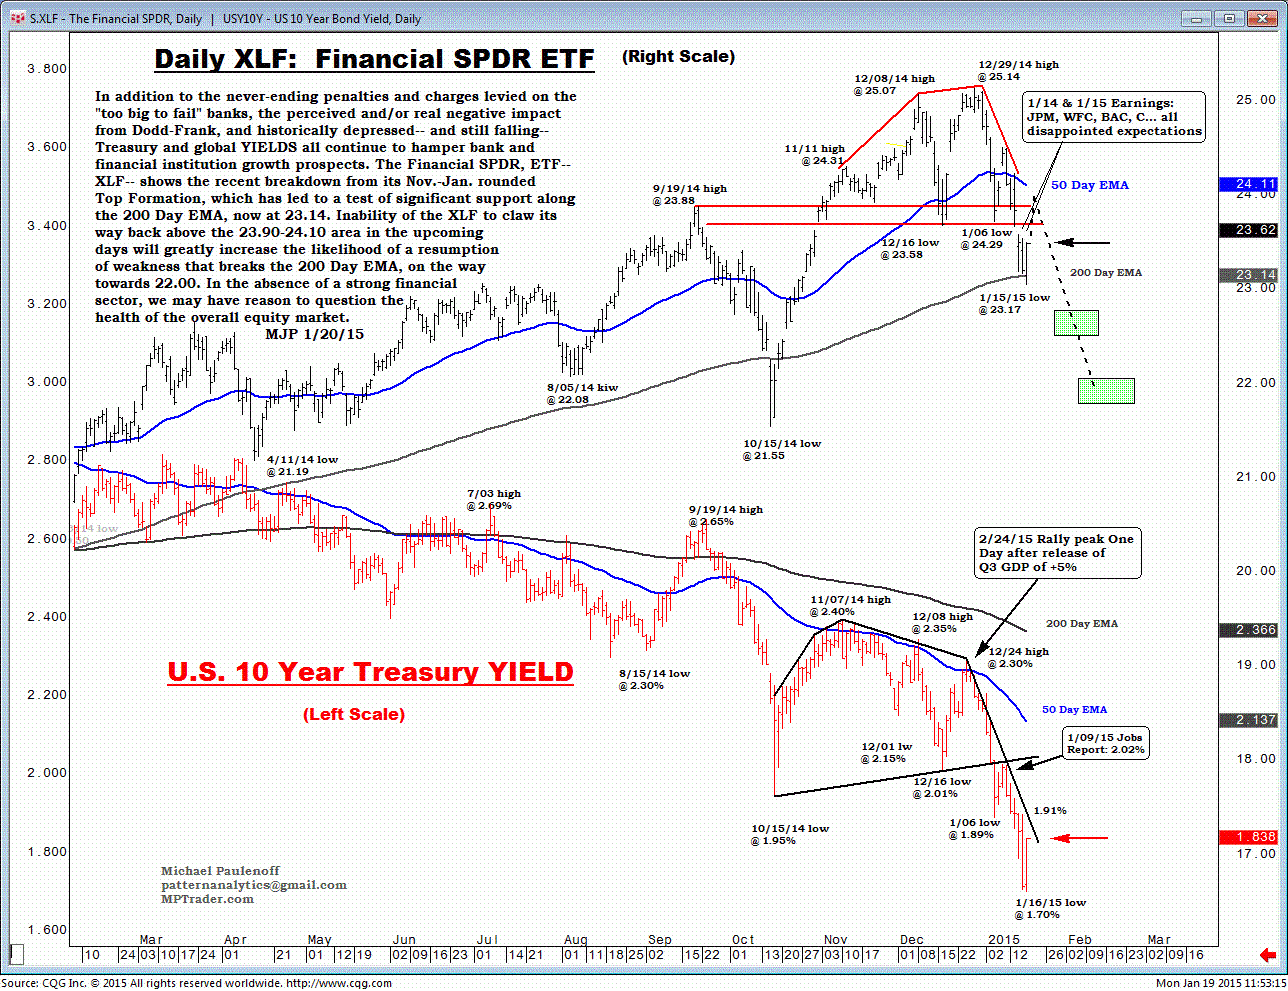
Bank and financial institution growth prospects are being hampered by a number of factors. These include the never-ending penalties and charges levied on the "too big to fail" banks, the perceived and/or real negative impact from Dodd-Frank, and the historically depressed -- and still falling -- Treasury and global yields.
A look at the chart on the Financial Select Sector SPDR ETF (XLF) shows the recent breakdown from its November-January rounded Top Formation, which has led to a test of significant support along the 200 Day EMA, now at 23.14. Inability of the XLF to claw its way back above the 23.90-24.10 area in the upcoming days will greatly increase the likelihood of a resumption of weakness that breaks the 200 Day EMA, on the way towards 22.00.
In the absence of a strong financial sector, we may have reason to question the health of the overall equity market.
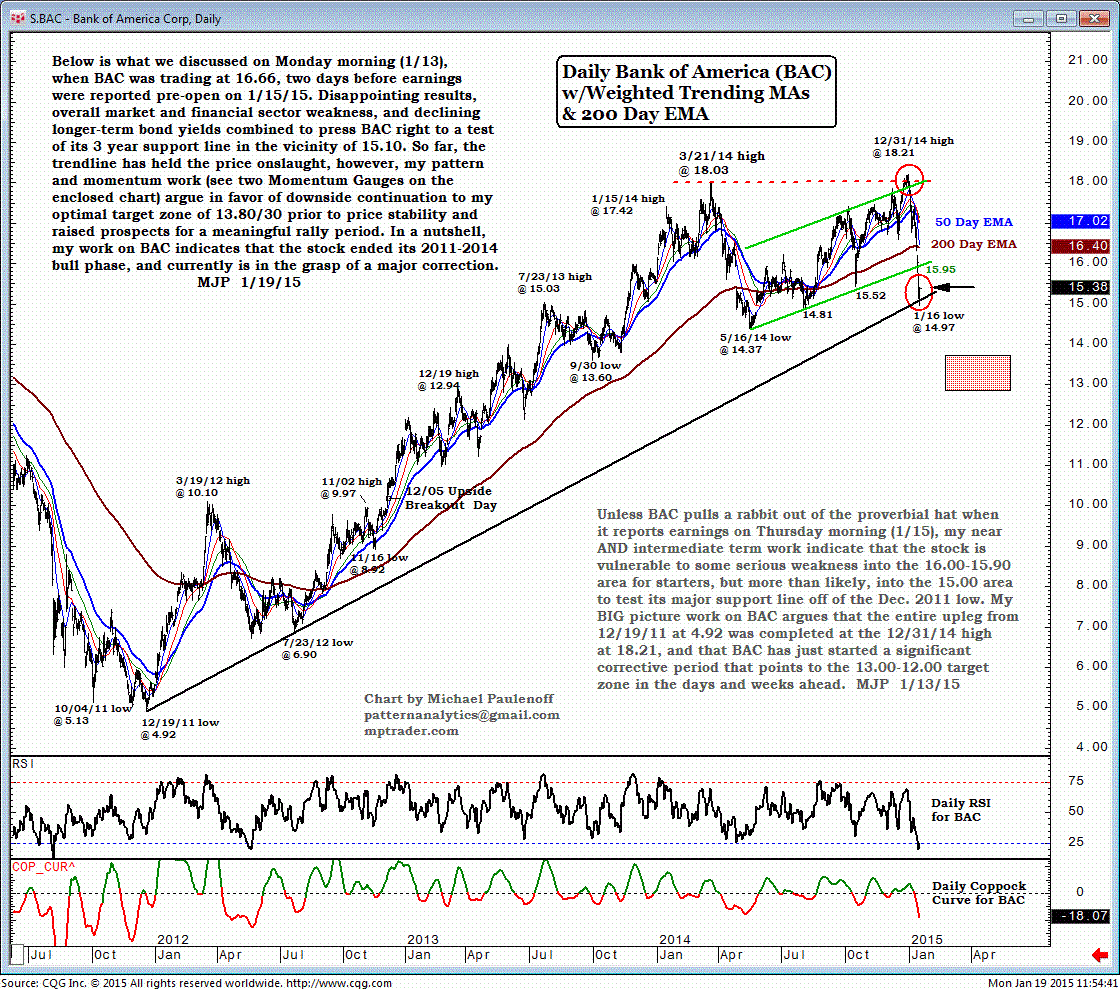
One example of sector weakness is Bank of America (BAC). On Monday January 13, when BAC was trading at 16.66, we noted that "unless BAC pulls a rabbit out of the proverbial hat when it reports earnings on Thursday January 16, my near AND intermediate term work indicate that the stock is vulnerable to some serious weakness into the 16.00-15.90 area for starters."
I noted that more than likely it appeared headed into the 15.00 area to test its major support line off of the December 2011 low.
Since then, disappointing earnings results, overall market and financial sector weakness, and declining longer-term bond yields have combined to press BAC right to a test of its 3-year support line in the vicinity of 15.10. So far, the trendline has held the price onslaught.
However, my BIG picture work on BAC argues that the entire upleg from Dec 19, 2011 at 4.92 was completed at the Dec 31, 2014 high at 18.21, and that BAC has just started a significant corrective period. My pattern and momentum work (see two Momentum Gauges on the enclosed chart) argue in favor of downside continuation to my optimal target zone of 13.80/30 prior to price stability and raised prospects for a meaningful rally period.
In a nutshell, my work on BAC indicates that the stock ended its 2011-2014 bull phase, and currently is in the grasp of a major correction along with the bank sector in general.
This Web site is published by AdviceTrade, Inc. AdviceTrade is a publisher and not registered as a securities broker-dealer or investment advisor either with the U.S. Securities and Exchange Commission or with any state securities authority. The information on this site has been obtained from sources considered reliable but we neither guarantee nor represent the completeness or accuracy of the information. In addition, this information and the opinions expressed are subject to change without notice. Neither AdviceTrade nor its principals own shares of, or have received compensation by, any company covered or any fund that appears on this site. The information on this site should not be relied upon for purposes of transacting securities or other investments, nor should it be construed as an offer or solicitation of an offer to sell or buy any security. AdviceTrade does not assess, verify or guarantee the suitability or profitability of any particular investment. You bear responsibility for your own investment research and decisions and should seek the advice of a qualified securities professional before making any investment.
Recommended Content
Editors’ Picks
EUR/USD holds below 1.0750 ahead of key US data

EUR/USD trades in a tight range below 1.0750 in the European session on Friday. The US Dollar struggles to gather strength ahead of key PCE Price Index data, the Fed's preferred gauge of inflation, and helps the pair hold its ground.
USD/JPY stays firm above 156.00 after BoJ Governor Ueda's comments

USD/JPY stays firm above 156.00 after surging above this level on the Bank of Japan's decision to leave the policy settings unchanged. BoJ Governor said weak Yen was not impacting prices but added that they will watch FX developments closely.
Gold price oscillates in a range as the focus remains glued to the US PCE Price Index

Gold price struggles to attract any meaningful buyers amid the emergence of fresh USD buying. Bets that the Fed will keep rates higher for longer amid sticky inflation help revive the USD demand.
Bitcoin Weekly Forecast: BTC’s next breakout could propel it to $80,000 Premium

Bitcoin’s recent price consolidation could be nearing its end as technical indicators and on-chain metrics suggest a potential upward breakout. However, this move would not be straightforward and could punish impatient investors.
US core PCE inflation set to signal firm price pressures as markets delay Federal Reserve rate cut bets

The core PCE Price Index, which excludes volatile food and energy prices, is seen as the more influential measure of inflation in terms of Fed positioning. The index is forecast to rise 0.3% on a monthly basis in March, matching February’s increase.


