EUR/USD
Monitor the resistance at 1.1368.
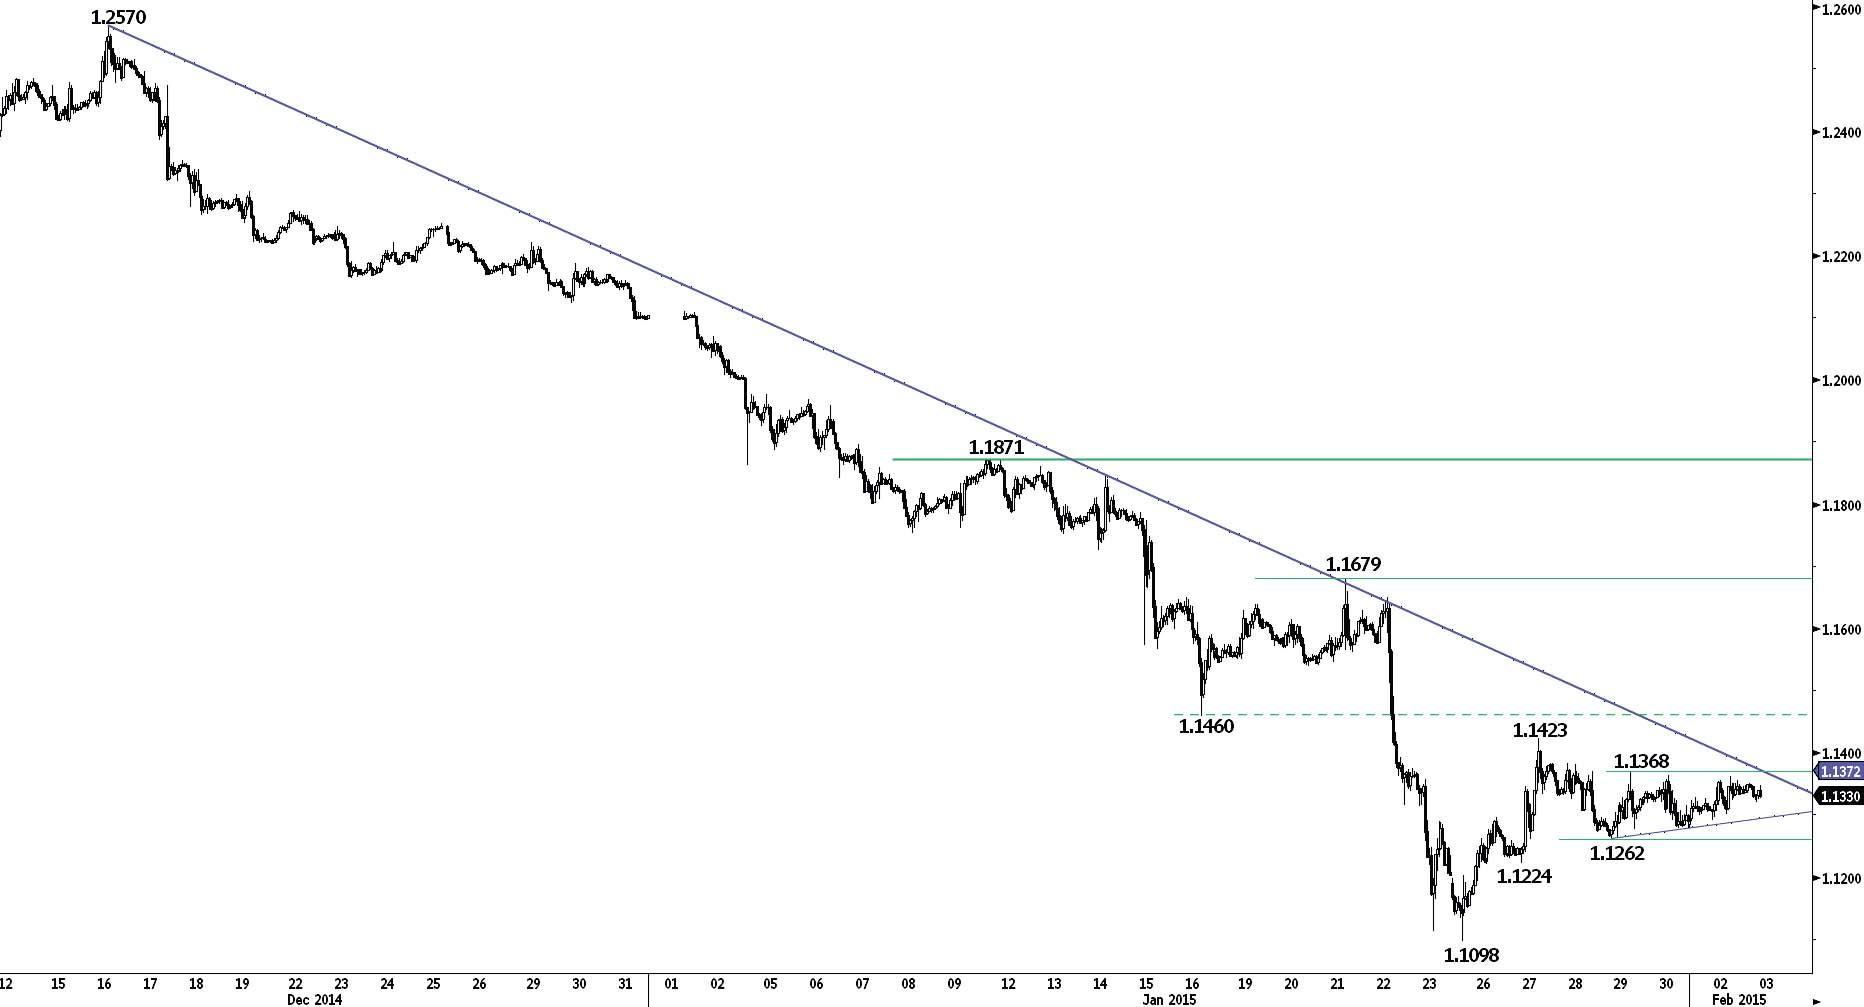
EUR/USD is consolidating after its rebound from the low at 1.1098. Monitor the resistance at 1.1368 (see also declining trendline). Other resistances can be found at 1.1423 and 1.1460. Hourly supports stand at 1.1262 (29/01/2015 low) and 1.1224 (27/01/2015 low).
In the longer term, the symmetrical triangle favours further weakness towards parity. As a result, any strength is likely to be temporary. Key supports can be found at 1.1000 (psychological support) and 1.0765 (03/09/2003 low). A resistance lies at 1.1679 (21/01/2015 high), while a key resistance stands at 1.1871 (12/01/2015 high).
Await fresh signal.
GBP/USD
Remains close to the strong support at 1.4814.
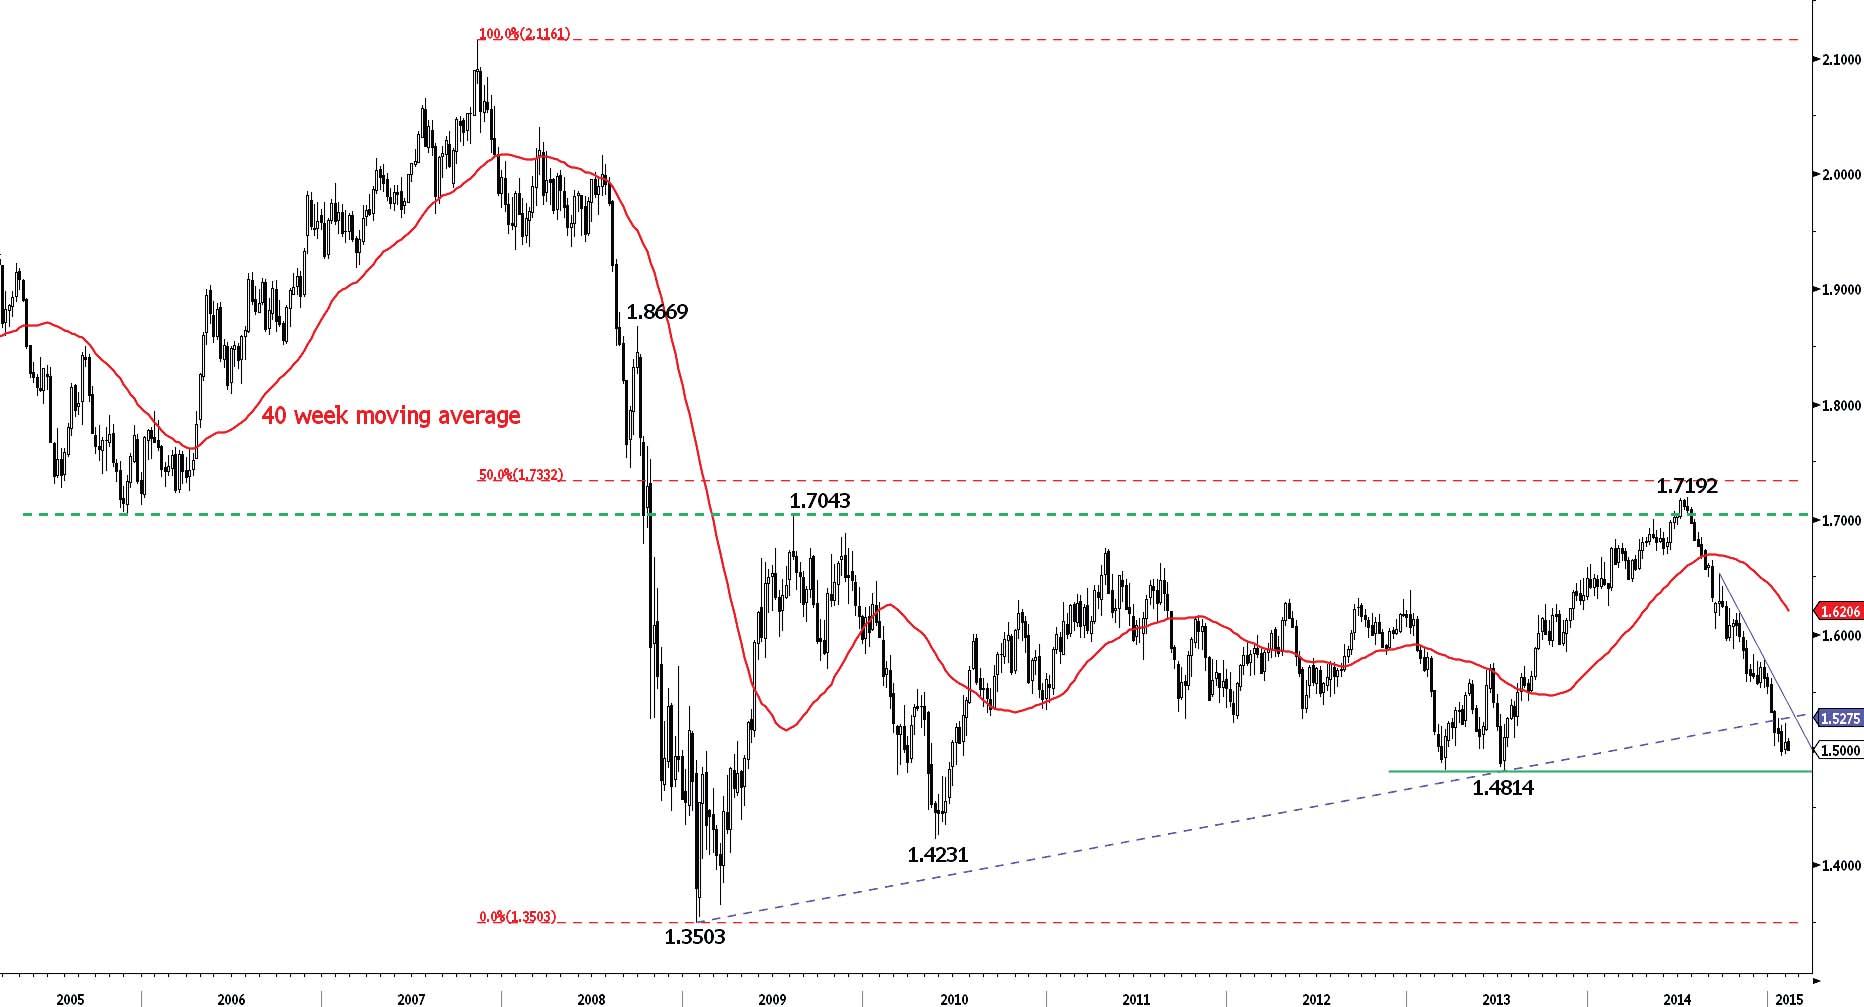
GBP/USD needs to break the key resistance at 1.5274 (06/01/2015 high) to improve the shortterm technical structure. A support stands at 1.4952 (23/01/2015 low), while a strong support lies at 1.4814. An initial resistance lies at 1.5101 (02/02/2015 high).
In the longer term, the technical structure is negative as long as prices remain below the key resistance at 1.5274 (06/01/2015 high, see also the declining trendline). A full retracement of the 2013-2014 rise is likely. However, the strong support at 1.4814 should cap the medium-term downside risks.
Await fresh signal.
USD/JPY
Weakening.
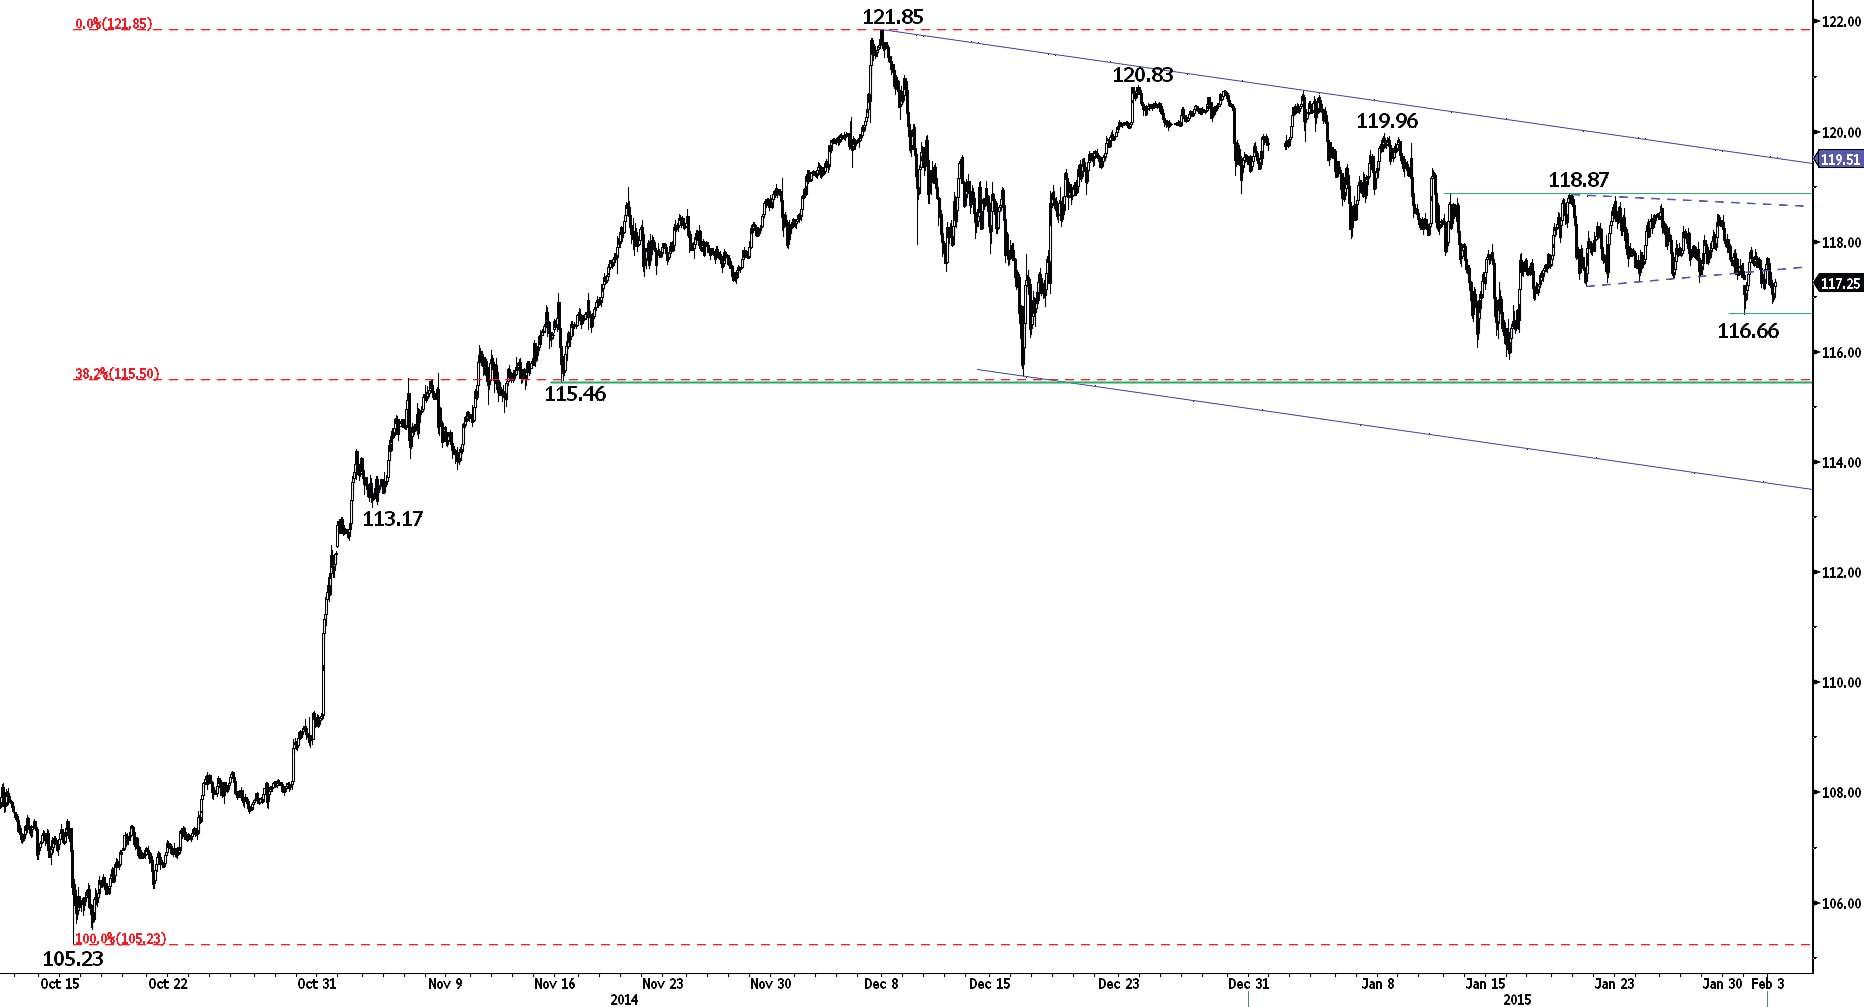
USD/JPY has broken to the downside its symmetrical triangle, suggesting increasing selling pressures. The short-term technical structure is biased to the downside as long as prices remain below the hourly resistance at 117.88 (02/02/2015 high). Another resistance stands at 118.87. Supports can be found at 116.66 (02/02/2015 low) and 115.86 (16/01/2015 low).
A long-term bullish bias is favoured as long as the key support 110.09 (01/10/2014 high) holds. Even if a medium-term consolidation is likely underway, there is no sign to suggest the end of the long-term bullish trend. A major resistance stands at 124.14 (22/06/2007 high). A key support can be found at 115.46 (17/11/2014 low).
Long 1 unit at 116.10, Obj: Close unit 1 at 119.30., Stop: 116.83 (Entered: 2015-01-16).
USD/CHF
Monitor the resistance at 0.9368.
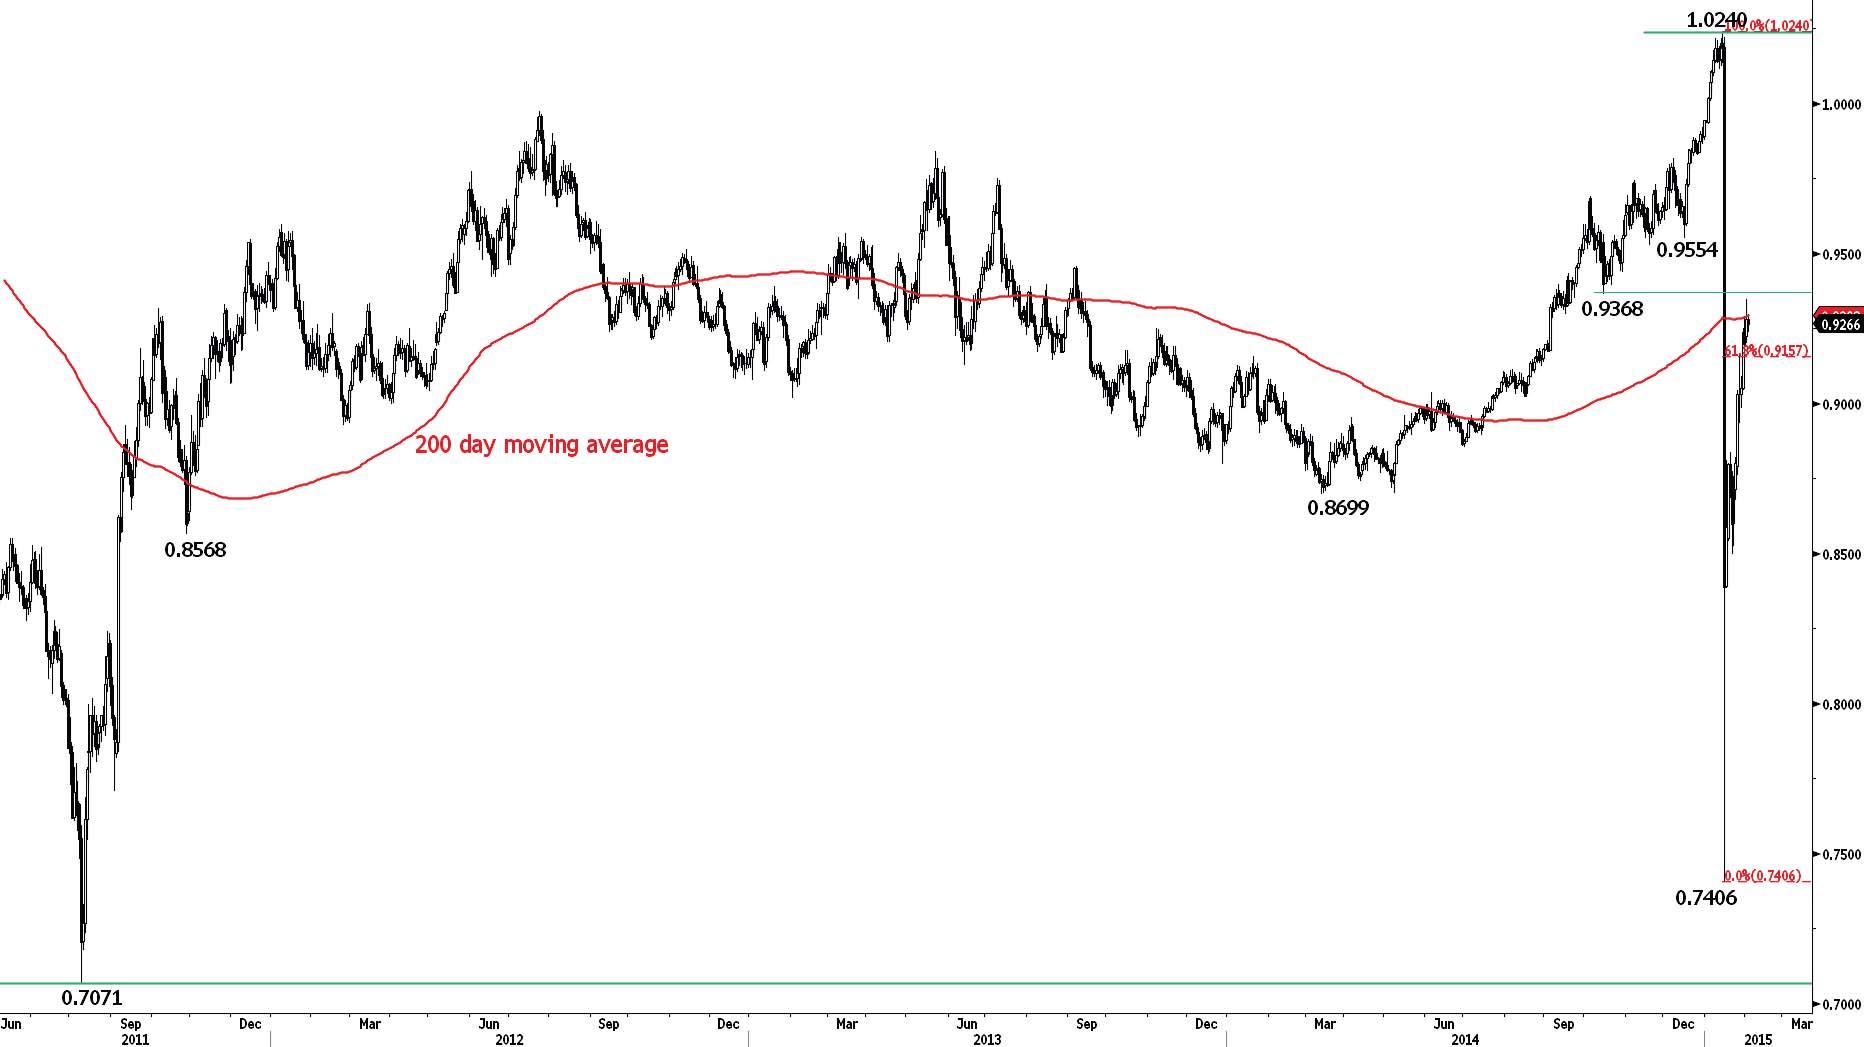
USD/CHF is showing some signs of weakness near the resistance at 0.9368 (15/10/2014 low, see also the 200-day moving average). Another resistance lies at 0.9554 (16/12/2014 low). Hourly supports stand at 0.9170 (30/01/2015 low) and 0.9080 (intraday low).
Following the removal of the EUR/CHF floor, a major top has been formed at 1.0240. The break of the resistance implied by the 61.8% retracement of the sell-off suggests a strong buying interest. Another key resistance stands at 0.9554 (16/12/2014 low), whereas a strong support can be found at 0.8353 (intraday low).
Await fresh signal.
USD/CAD
Short-term weakness underway.
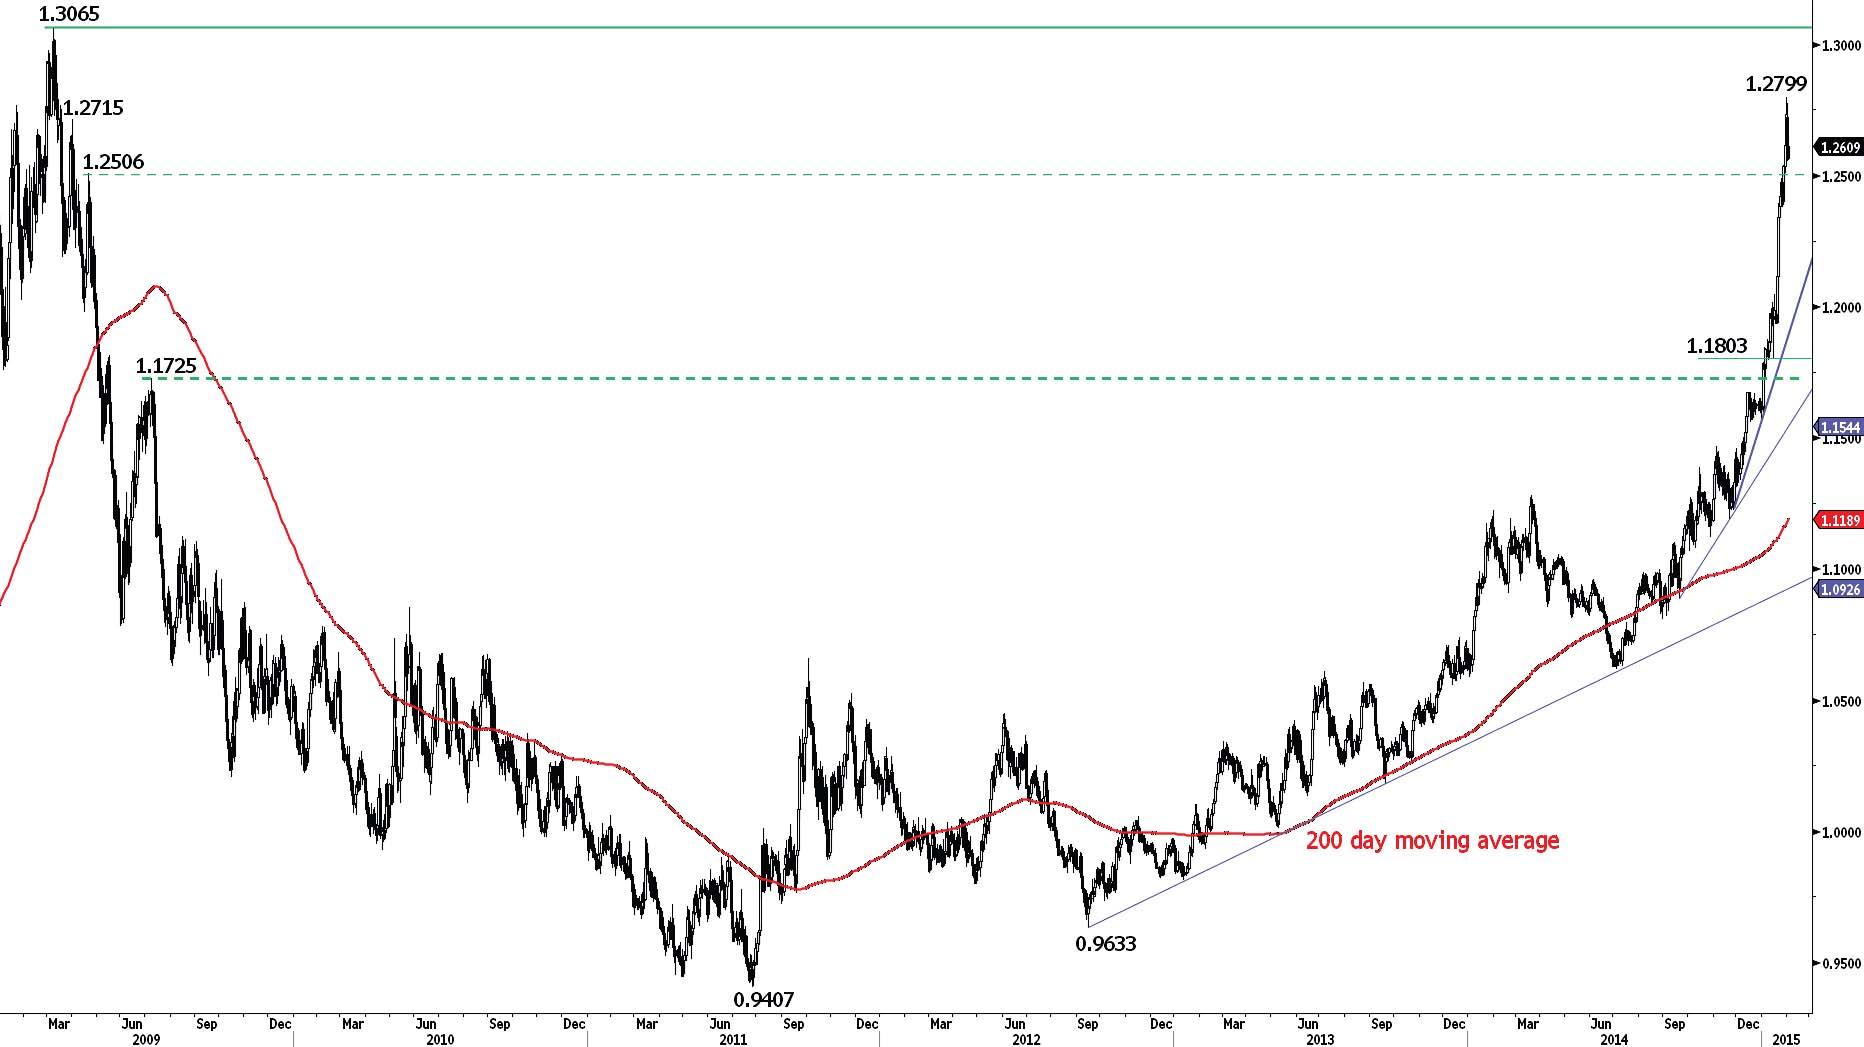
USD/CAD declined sharply yesterday, suggesting increasing selling pressures as prices are getting closer to the strong resistance at 1.3065. An hourly support can be found at 1.2512 (29/01/2015 low), while a more significant support stands at 1.2380 (27/01/2015 low).
In the longer term, the technical structure looks like a rounding bottom whose maximum upside potential is given by the strong resistance at 1.3065 (09/03/2009 high). Given the current overextended rise, the odds to see a consolidation phase are elevated. A key support stands at 1.1803 (15/01/2015 low).
Await fresh signal.
AUD/USD
Moving lower.
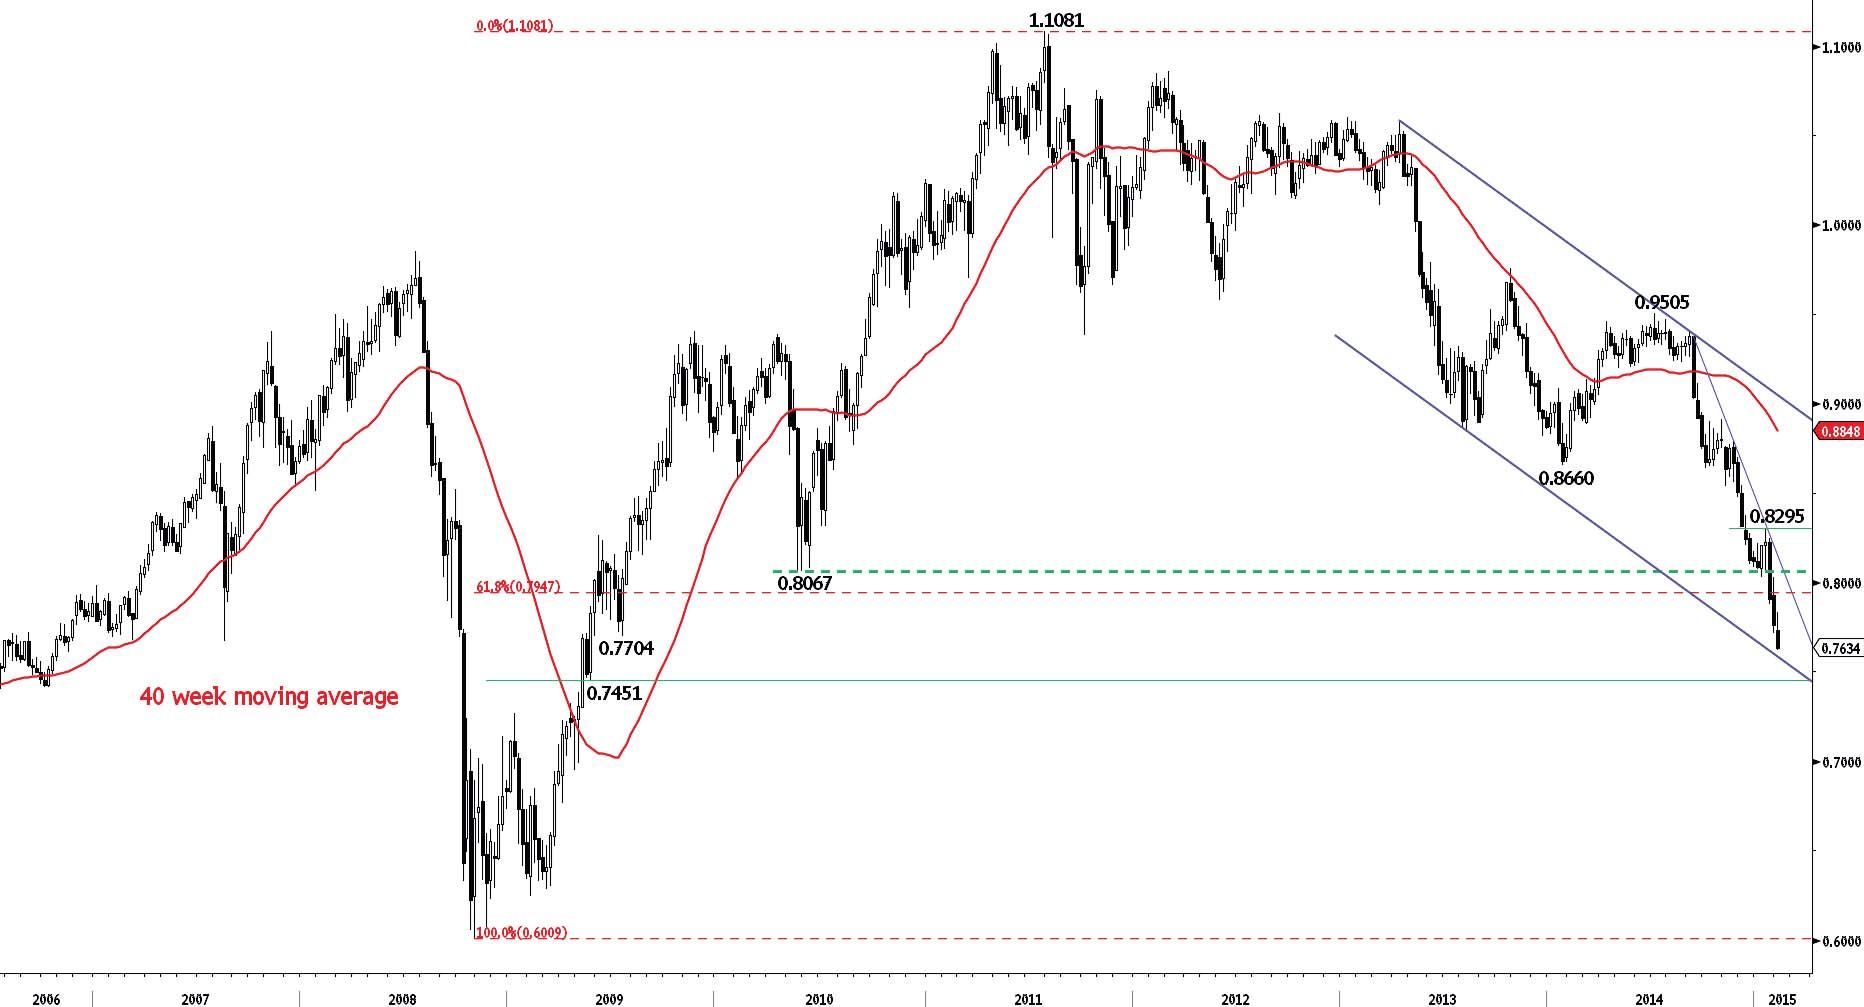
AUD/USD is moving lower, confirming an underlying declining trend. The short-term technical structure is negative as long as prices remain below the hourly resistance at 0.7833 (intraday high). A key resistance stands at 0.8054 (23/01/2015 high). A psychological support lies at 0.7500.
In the long-term, there is no sign to suggest the end of the current downtrend. The break of the strong support area between 0.8067 (25/05/2010 low) and 0.7947 (61.8% retracement of the 2009-2011 rise) favours further weakness. A key support stands at 0.7451 (18/05/2009 low). A break of the key resistance at 0.8295 (15/01/2015 high) is needed to invalidate our bearish view.
Await fresh signal.
GBP/JPY
Monitor the key support at 175.85.
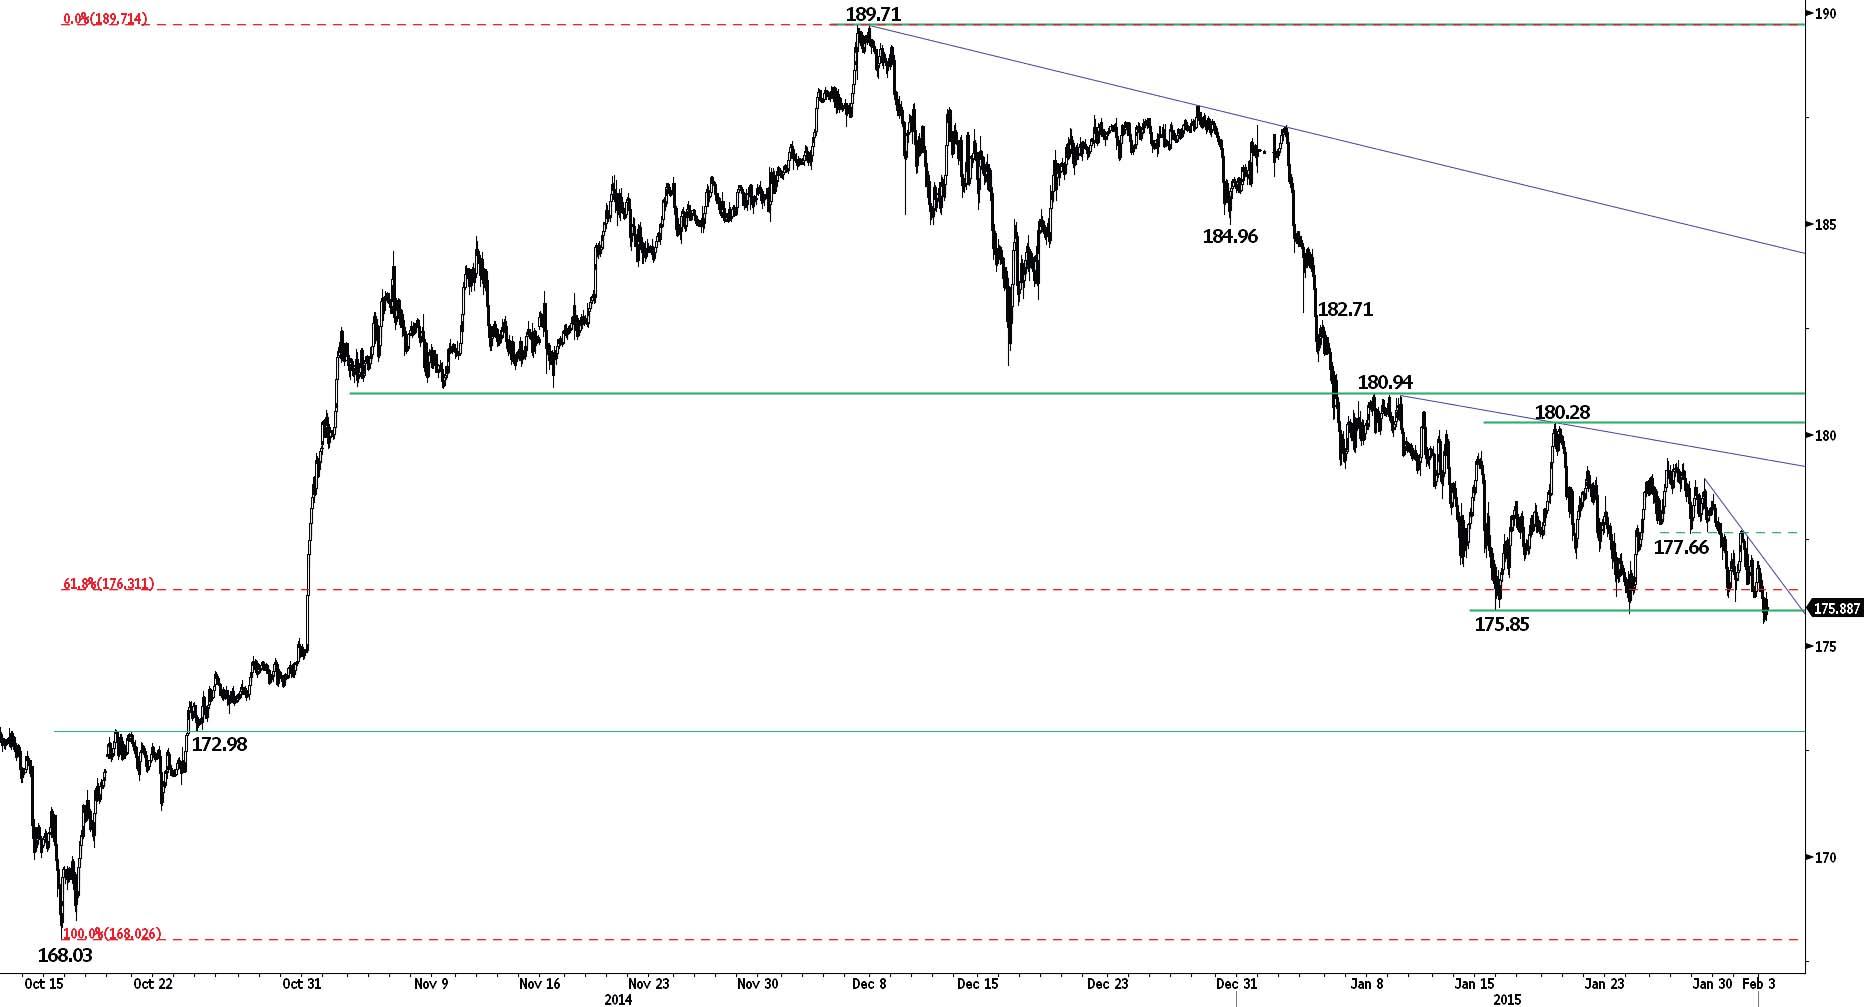
GBP/JPY is challenging the key support at 175.85. An hourly resistance can now be found at 177.73 (02/02/2015 high). A key resistance area stands between 180.28 and 180.94. Another support lies at 172.98.
In the long-term, the lack of any medium-term bearish reversal pattern favours a bullish bias. A support is given by the 200-day moving average (around 176.30), while a strong support area lies between 169.51 (11/04/2014 low) and 167.78 (18/03/2014 low). A strong resistances stands at 190.00 (psychological threshold).
Await fresh signal.
EUR/JPY
Consolidating.
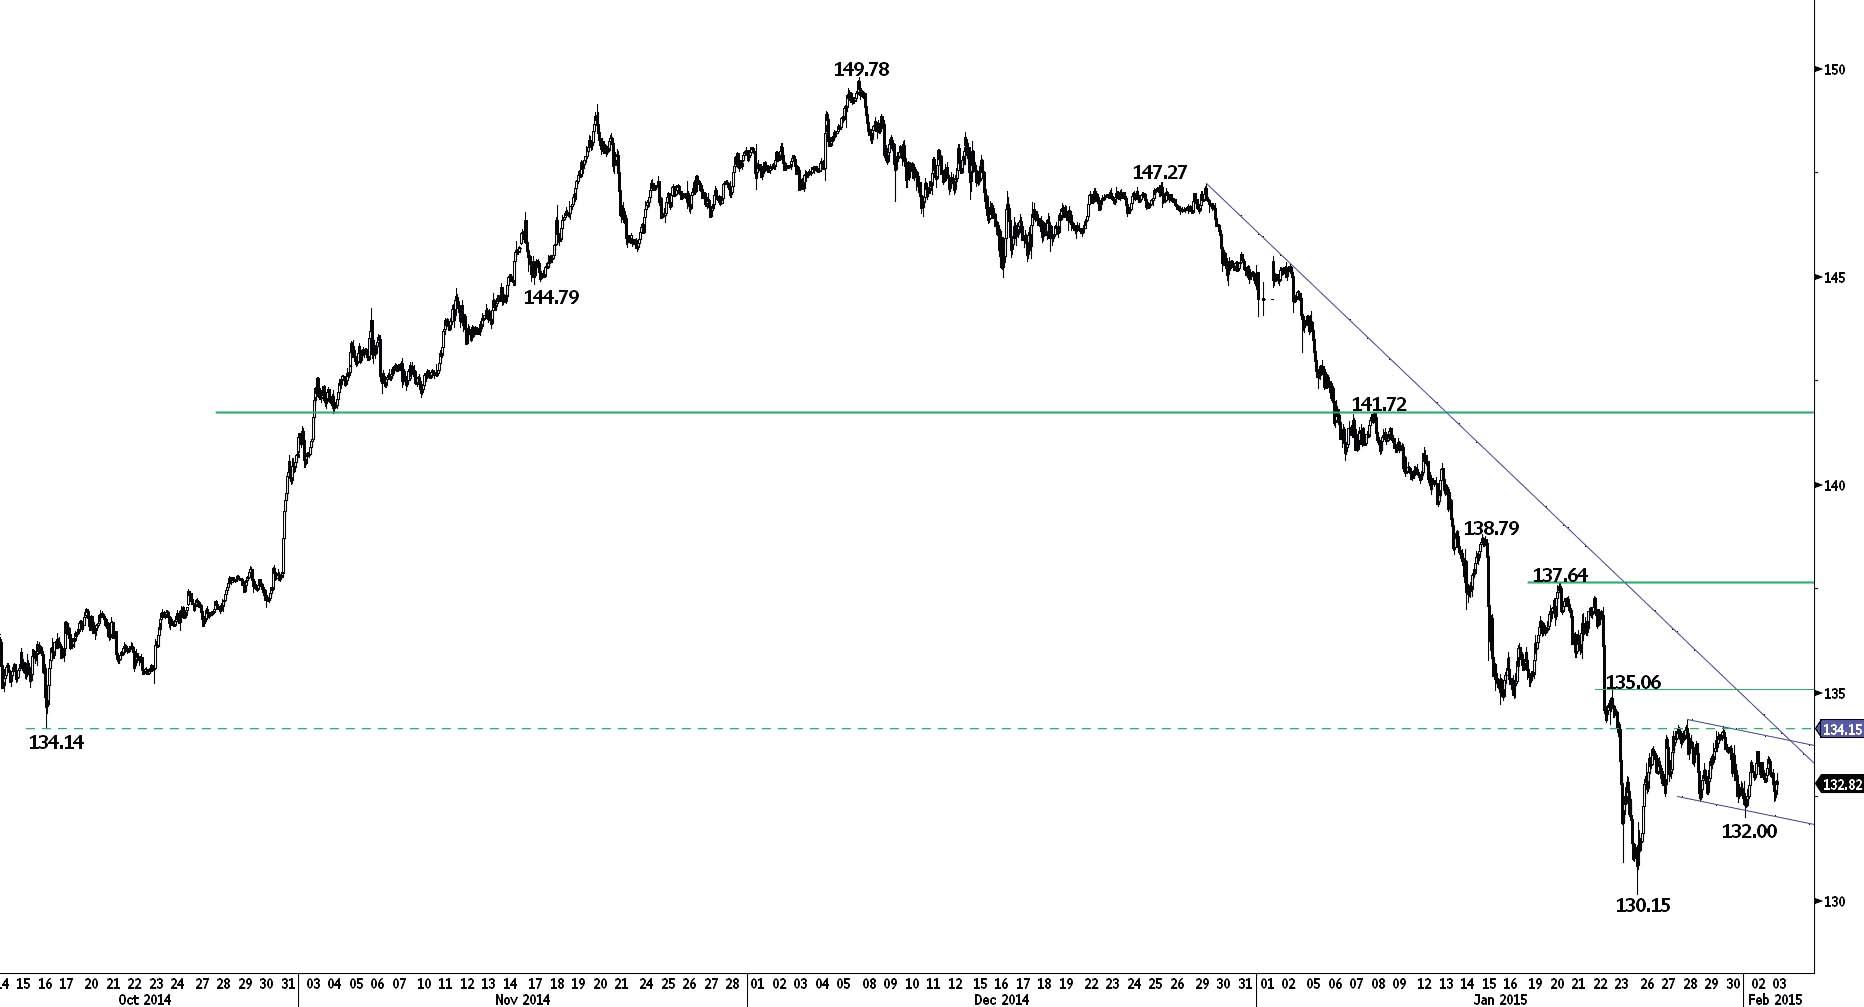
EUR/JPY has bounced near the support at 131.15 (08/10/2013 low). However, as long as prices remain below the resistance at 135.06 (23/01/2015 high), the short-term technical structure is biased to the downside. The current short-term declining channel suggests increasing selling pressures. Supports can now be found at 132.00 and 130.15. A key resistance stands at 137.64.
In the longer term, the break of the strong support at 134.11 (20/11/2013 low) invalidates the long-term succession of higher lows. The resistance at 149.78 (08/12/2014 high) has likely marked the end of the rise that started in July 2012. More sideways moves are now expected. A key support stands at 124.97 (13/06/2013 low).
Await fresh signal.
EUR/GBP
Bouncing.
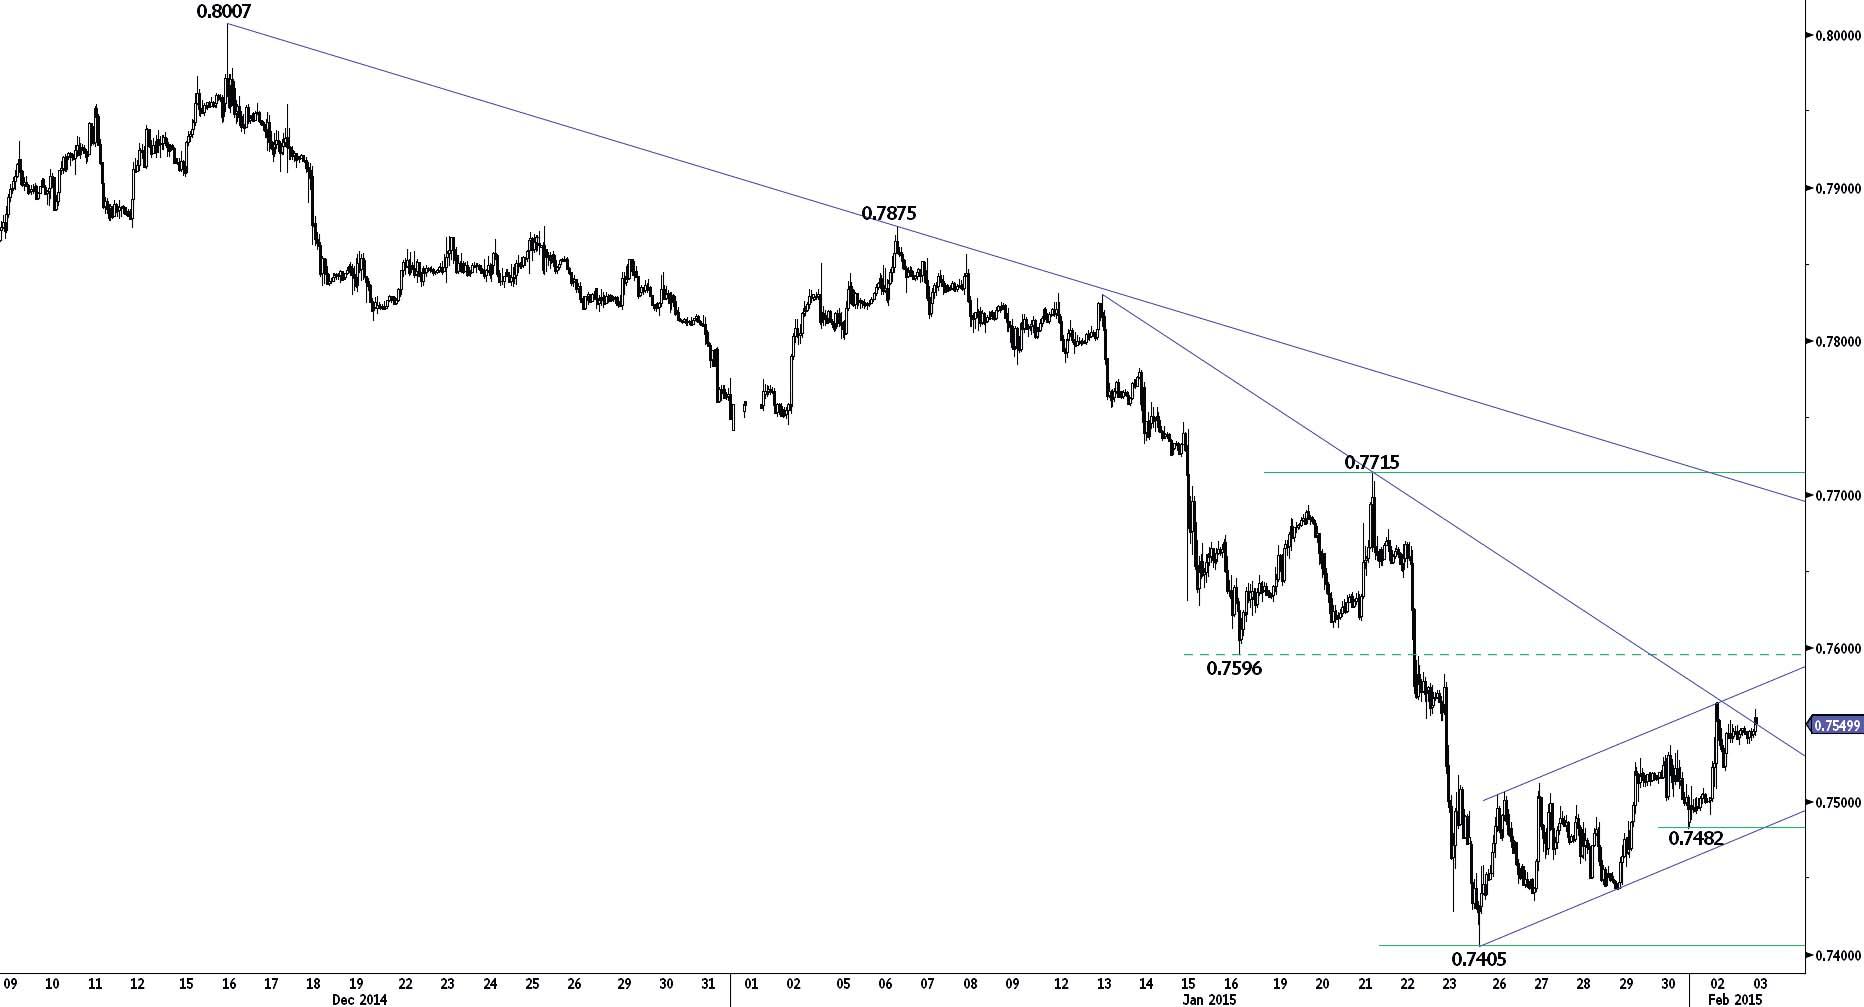
EUR/GBP has bounced near the key support at 0.7392 (28/01/2008 low). However, as long as prices are below the resistance at 0.7596 (16/01/2015 low), the short-term technical structure remains biased to the downside. An hourly support lies at 0.7482 (30/01/2015 low, see also the rising channel).
In the long-term, the break of the major support area between 0.7755 (23/07/2012 low) and 0.7694 (20/10/2008 low) confirms an underlying downtrend. Monitor the test of the support at 0.7392 (28/01/2008 low). Another support can be found at 0.7089 (03/12/2007 low). A key resistance now lies at 0.7875 (25/12/2014 high).
Sell limit 2 units at 0.7563, Obj: Close unit 1 at 0.7436, remaining at 0.7260, Stop: 0.7606.
EUR/CHF
Monitor the key resistance at 1.0600.
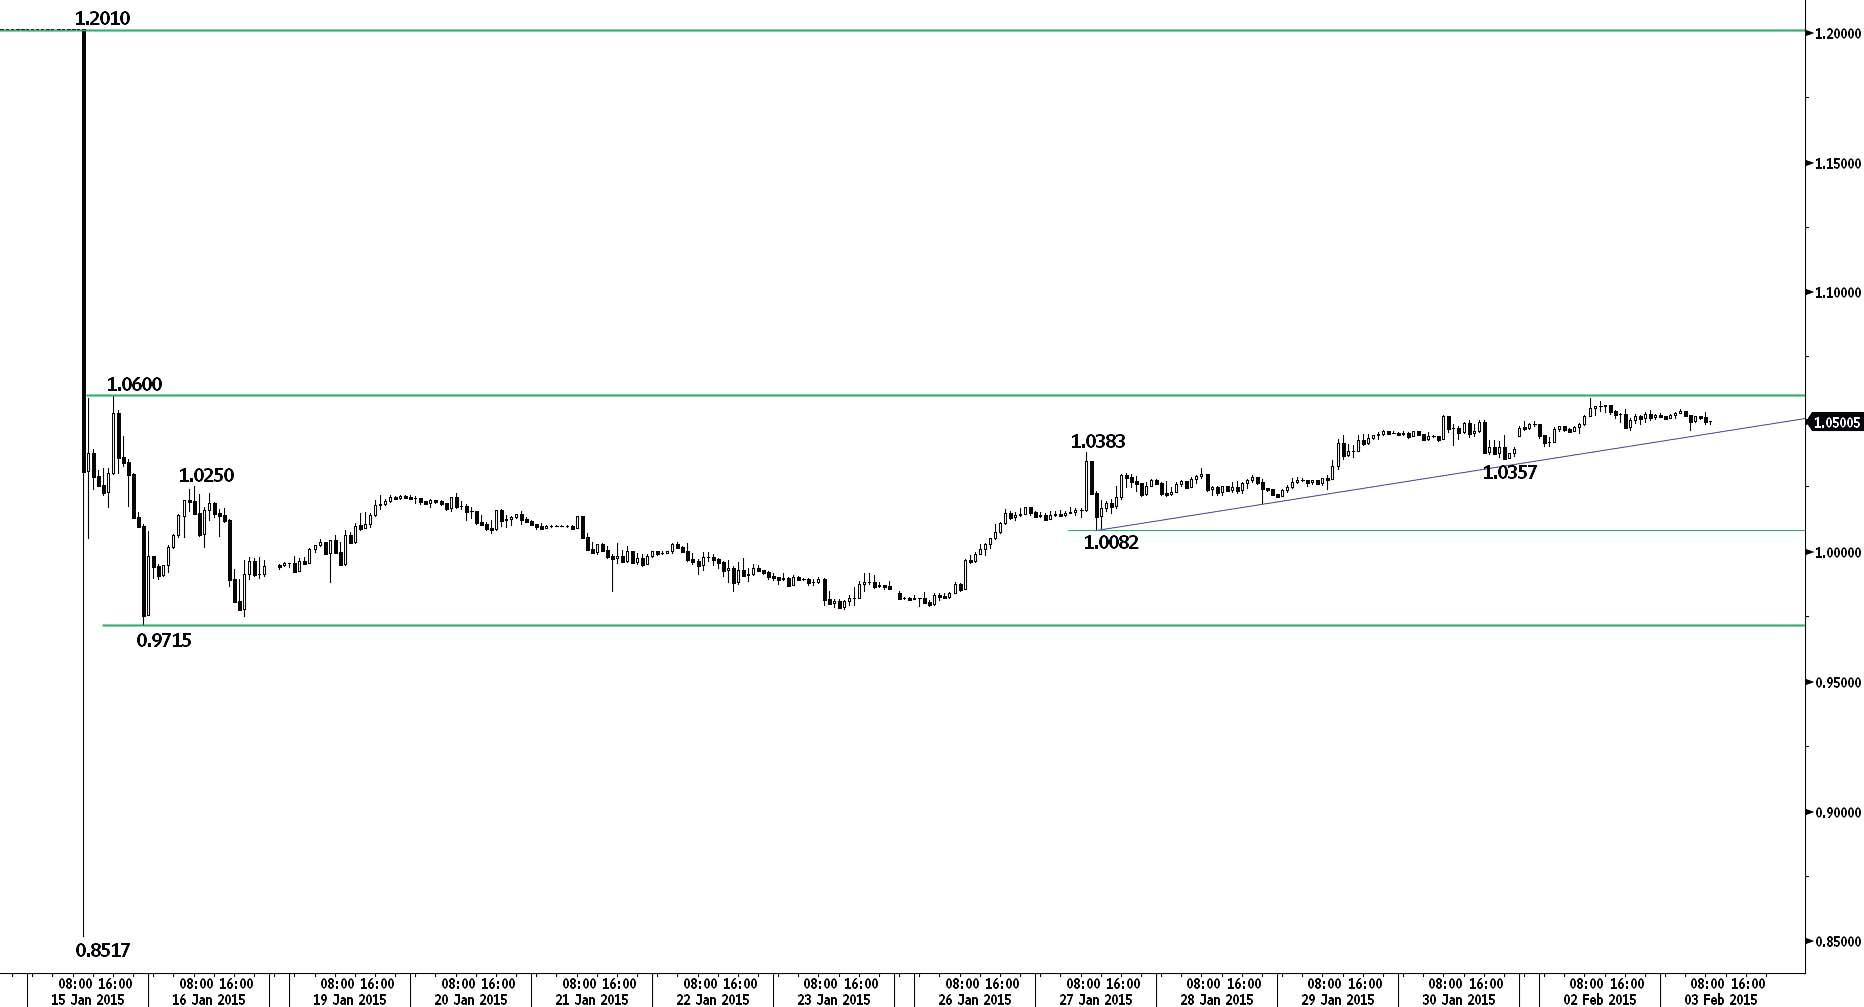
EUR/CHF is recovering after its recent massive sell-off. Monitor the key resistance at 1.0600. Other resistances can be found at 1.0675 (61.8% retracement of the 15 January decline) and 1.1002 (02/09/2011 low). Hourly supports lie at 1.0357 and 1.0184 (28/01/2015 low).
The EUR/CHF is again a free-floating currency and has declined to uncharted water. The ECB's QE programme is likely to cause persistent selling pressures on EUR/CHF. As a result, the key resistance at 1.0600 should be hard to break. A key support stands at 0.9715. The 15 January low at 0.8517 is a strong support, which should hold in the coming months.
Await fresh signal.
GOLD (in USD)
Bouncing.
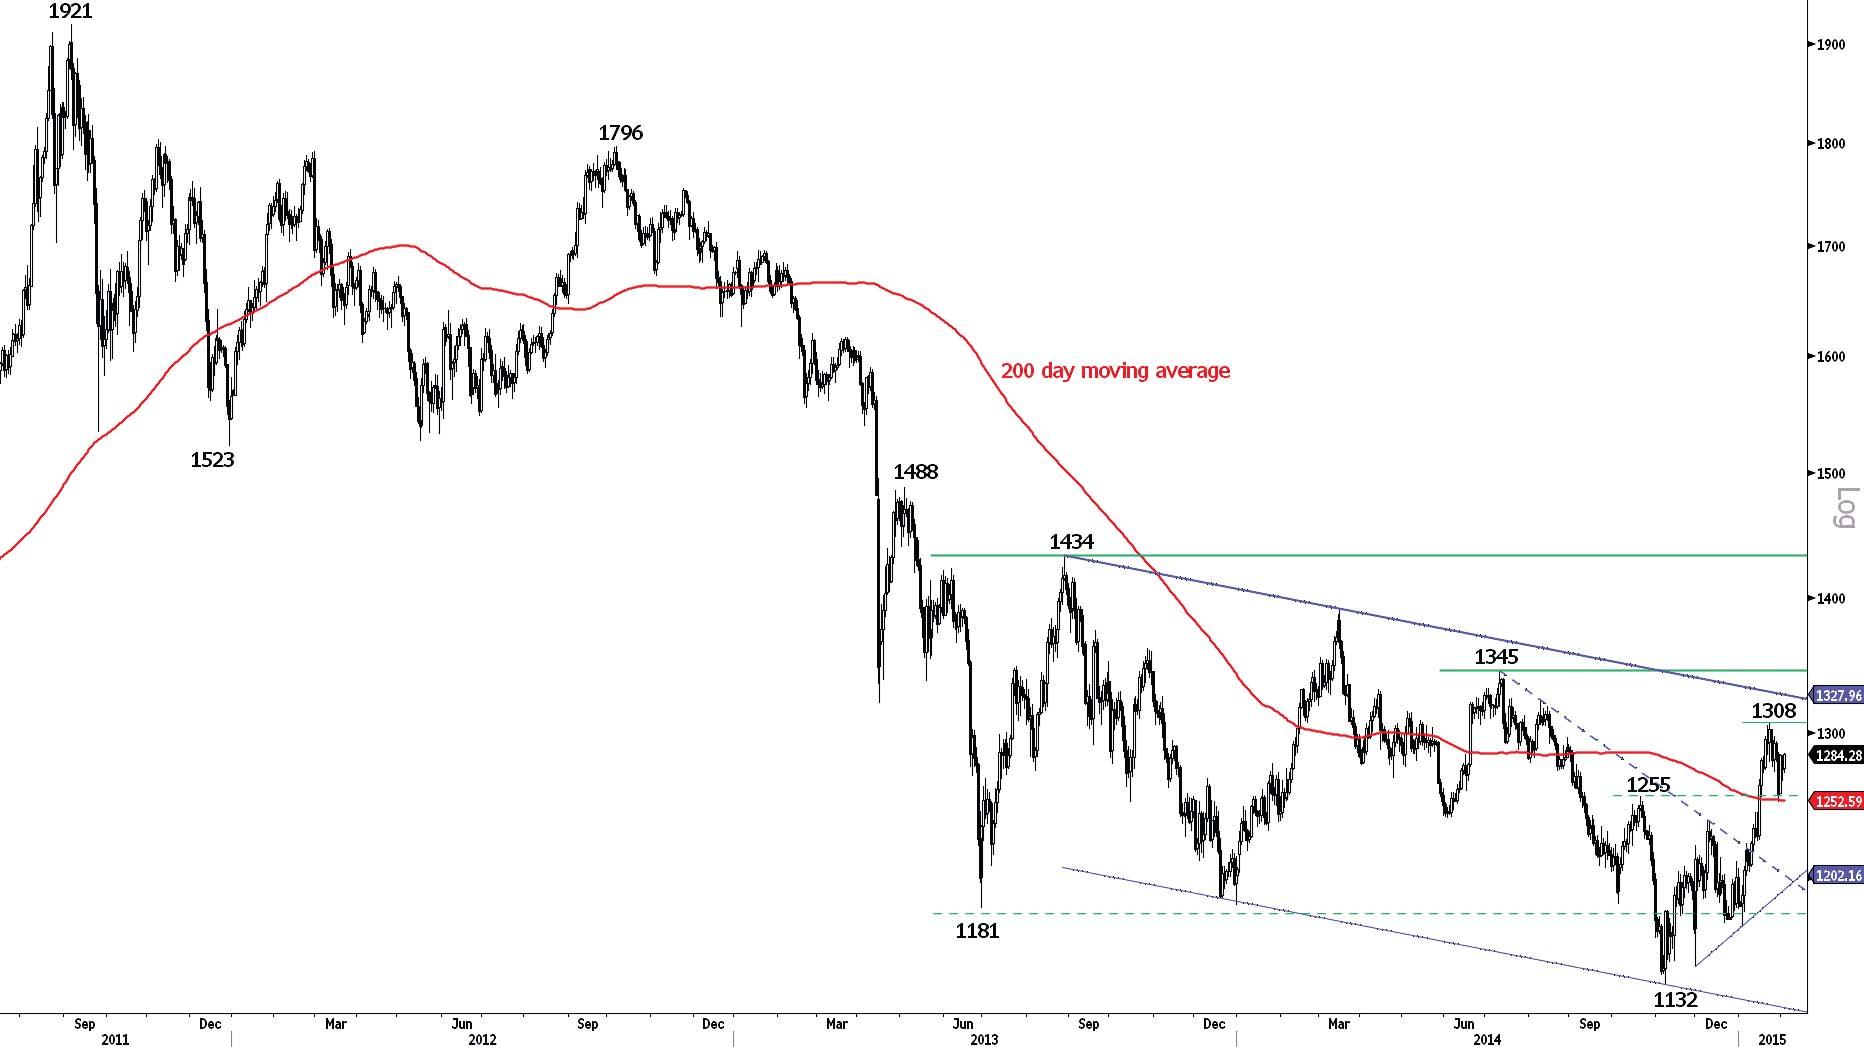
Gold is bouncing after the successful test of the support at 1255 (16/01/2015 low). Hourly resistances stand at 1298 (27/01/2015 high) and 1308. Another support lies at 1225 (14/01/2015 low).
In the long-term, the break of strong resistance at 1255 (21/10/2014 high) indicates an improving technical structure. However, the shape of this advance still looks like a countertrend move within an underlying downtrend (see also the declining channel). Another key resistance stands at 1345 (10/07/2014 high).
Await fresh signal.
SILVER (in USD)
Bouncing.
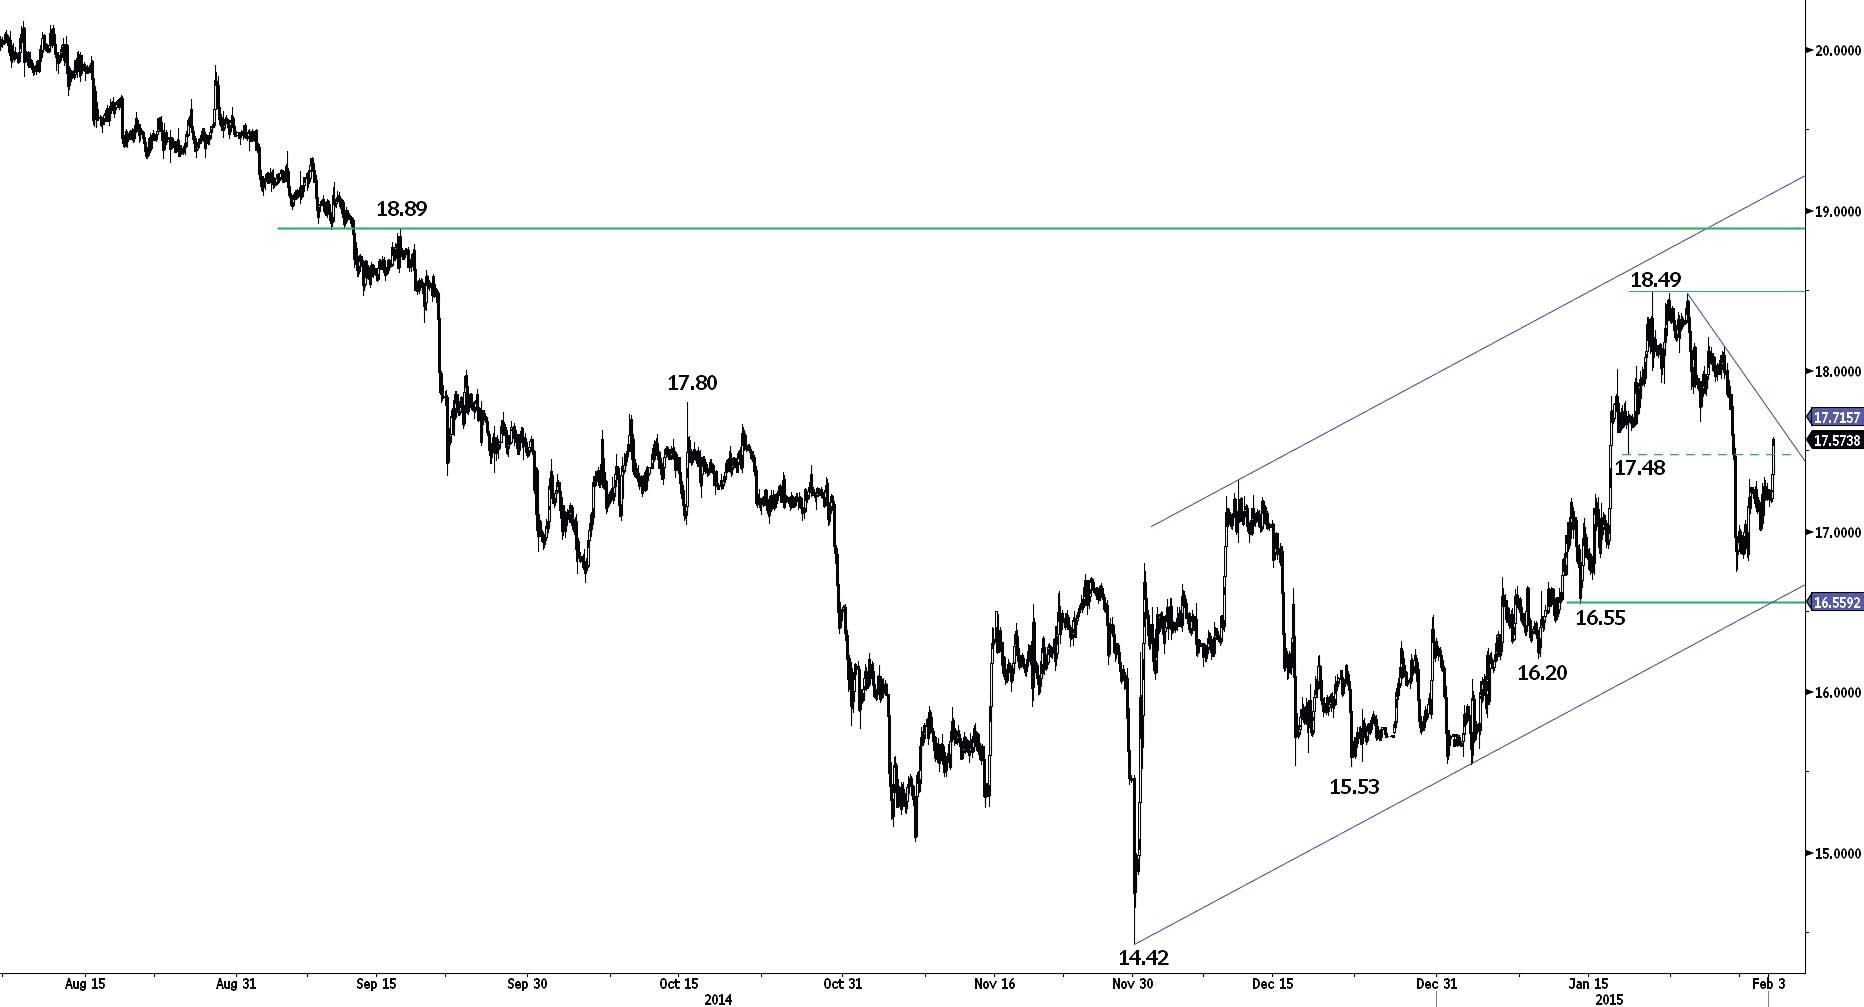
Silver continues to move within its rising channel. Hourly resistances are now given by 17.69 (see also the declining trendline) and 18.21 (27/01/2015 high). An hourly support lies at 17.00 (02/02/2015 low), while a key support at 16.55 (see also the rising channel).
In the long-term, the break of the major support area between 18.64 (30/05/2014 low) and 18.22 (28/06/2013 low) confirms an underlying downtrend. Although the strong support at 14.66 (05/02/2010 low) has held thus far, the lack of any base formation continues to favour a long-term bearish bias. A key resistance stands at 18.89 (16/09/2014 high).
Await fresh signal.
This report has been prepared by Swissquote Bank Ltd and is solely been published for informational purposes and is not to be construed as a solicitation or an offer to buy or sell any currency or any other financial instrument. Views expressed in this report may be subject to change without prior notice and may differ or be contrary to opinions expressed by Swissquote Bank Ltd personnel at any given time. Swissquote Bank Ltd is under no obligation to update or keep current the information herein, the report should not be regarded by recipients as a substitute for the exercise of their own judgment.
Recommended Content
Editors’ Picks
EUR/USD trades with negative bias, holds above 1.0700 as traders await US PCE Price Index

EUR/USD edges lower during the Asian session on Friday and moves away from a two-week high, around the 1.0740 area touched the previous day. Spot prices trade around the 1.0725-1.0720 region and remain at the mercy of the US Dollar price dynamics ahead of the crucial US data.
USD/JPY jumps above 156.00 on BoJ's steady policy

USD/JPY has come under intense buying pressure, surging past 156.00 after the Bank of Japan kept the key rate unchanged but tweaked its policy statement. The BoJ maintained its fiscal year 2024 and 2025 core inflation forecasts, disappointing the Japanese Yen buyers.
Gold price flatlines as traders look to US PCE Price Index for some meaningful impetus

Gold price lacks any firm intraday direction and is influenced by a combination of diverging forces. The weaker US GDP print and a rise in US inflation benefit the metal amid subdued USD demand. Hawkish Fed expectations cap the upside as traders await the release of the US PCE Price Index.
Sei Price Prediction: SEI is in the zone of interest after a 10% leap

Sei price has been in recovery mode for almost ten days now, following a fall of almost 65% beginning in mid-March. While the SEI bulls continue to show strength, the uptrend could prove premature as massive bearish sentiment hovers above the altcoin’s price.
US economy: Slower growth with stronger inflation

The US Dollar strengthened, and stocks fell after statistical data from the US. The focus was on the preliminary estimate of GDP for the first quarter. Annualised quarterly growth came in at just 1.6%, down from the 2.5% and 3.4% previously forecast.
