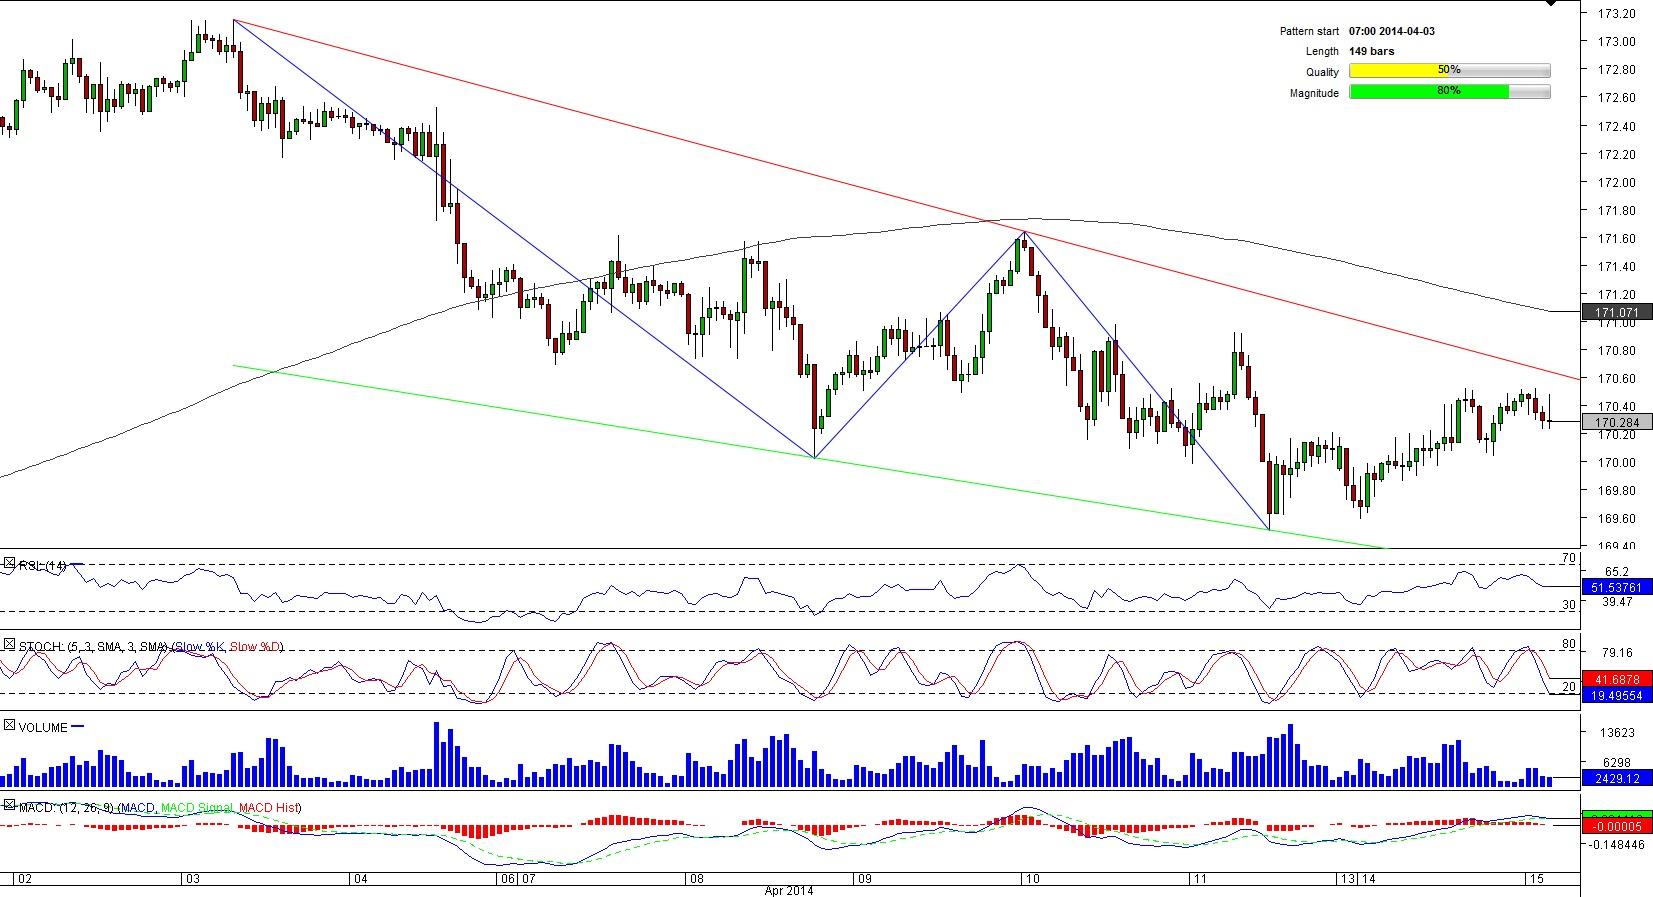
GBP/JPY 1H Chart: Channel Down
Comment: The British Pound started its downside trend after it touched a one-month high against the Japanese Yen early April. The downswing has been developing in the 149-bar long bearish tunnel that pushed GBP/JPY to a three-week low of 169.50 a couple of days earlier. Since then, the pair has been appreciating and now it is trading just below the channel’s upper limit. Given that almost two thirds of market players are bullish on the pair, we may expect the instrument to attain the pattern’s resistance in the hours to come.
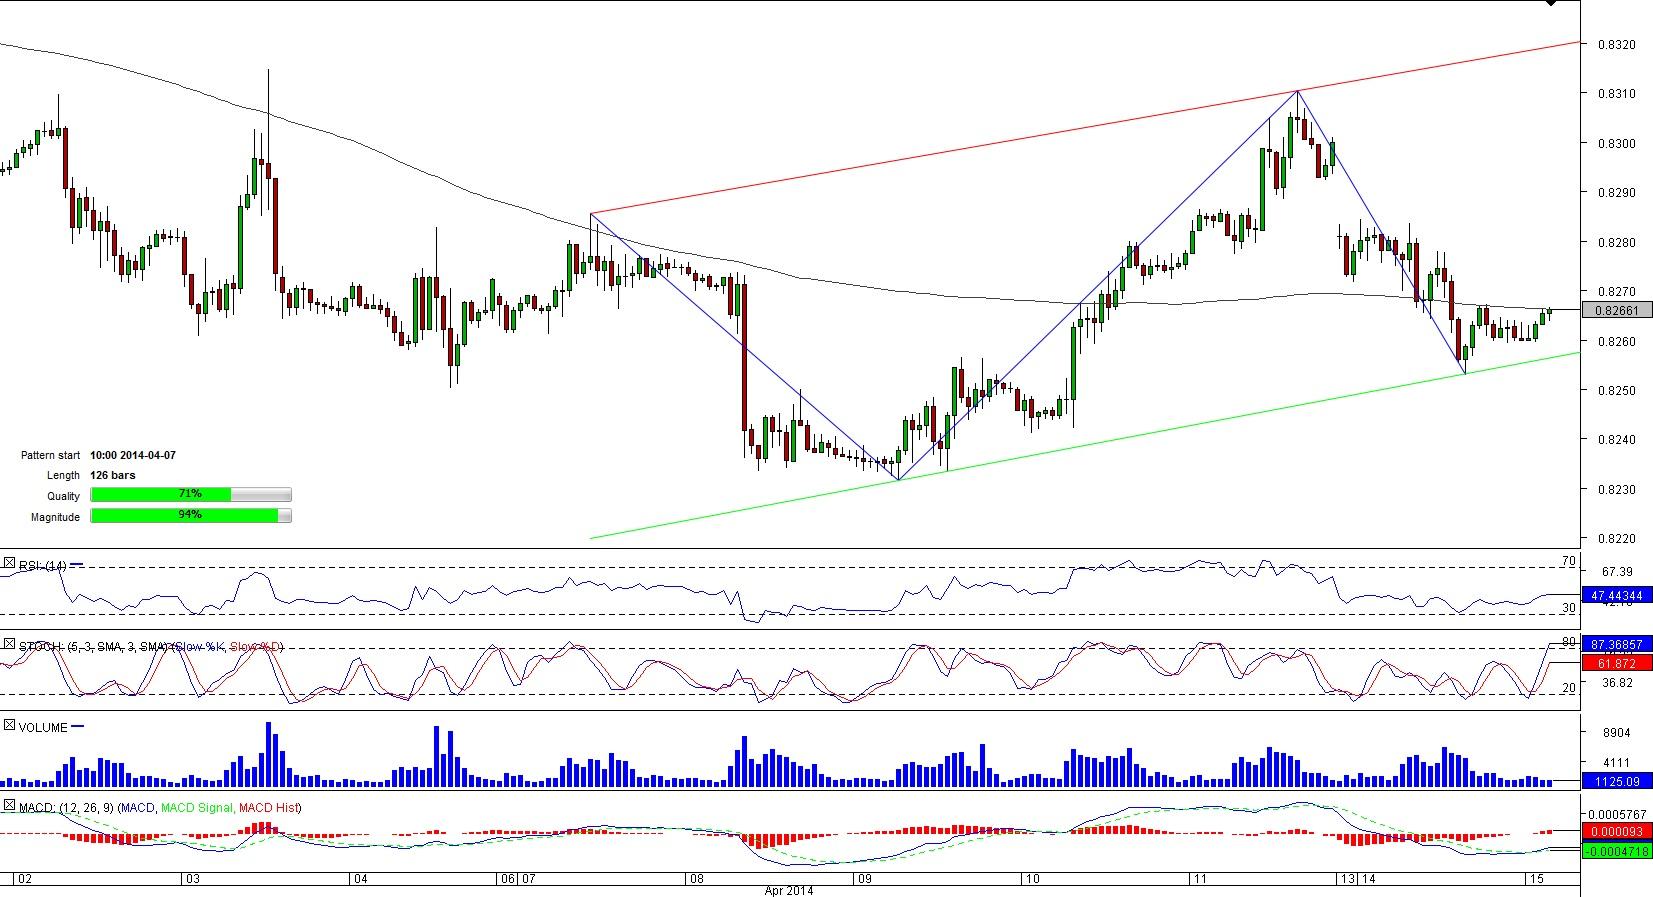
EUR/GBP 1H Chart: Channel Up
Comment: Having hit a four-month high of 0.8402 in mid-March, EUR/GBP commenced a three-week decline that took it to a one-month low of 0.82316. After that, the currency couple reversed its trend and embarked upon formation of the channel up pattern, within which it is fluctuating at the moment.
Now the pair is sitting at the 200-hour SMA at 0.8265 that represents a formidable resistance. Considering the SWFX sentiment, the pair is not likely to overcome this ceiling and may even retreat in the foreseeable future; almost 60% of traders bet on depreciation of the pair.
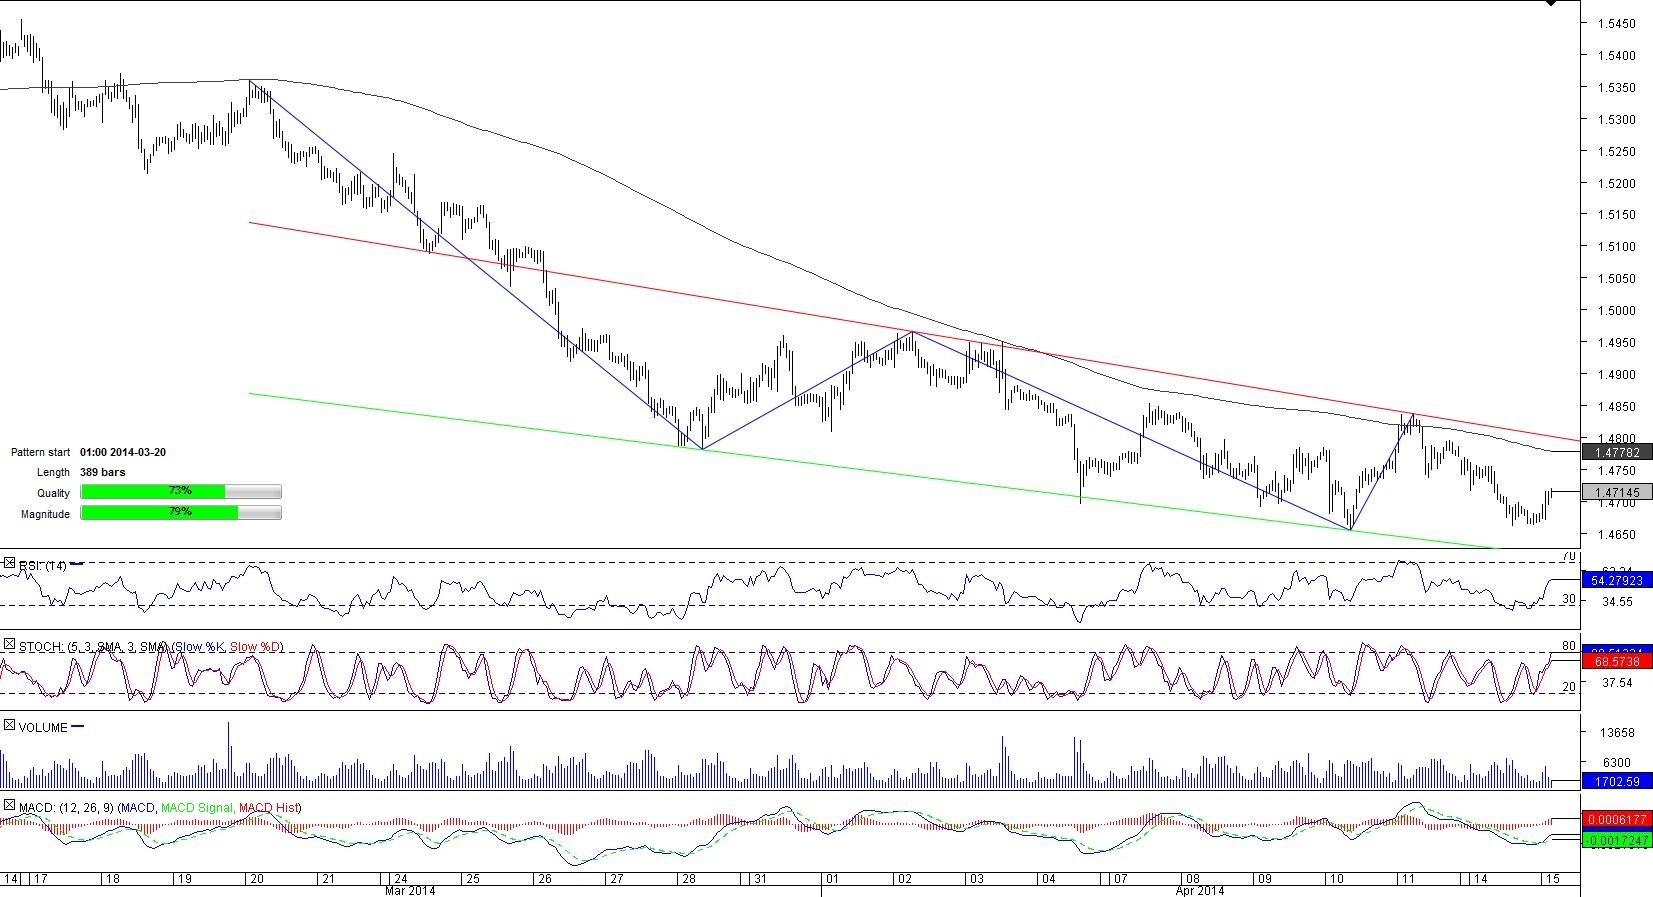
EUR/AUD 1H Chart: Falling Wedge
Comment: Since mid-March, the Euro has been losing ground against the Australian Dollar and on March 20 the pair entered a gradually converging bearish corridor that sent EUR/AUD to a five-month low of 1.4653.
Currently, the pair is vacillating between the recent low and the 50-hour SMA at 1.4737. According to technical data, the pair is likely to prolong its losing streak as indicators are sending ‘sell’ signals for medium and long terms. If this comes true, the pair may attain 1.4709/683 (daily PP; four-hour S1), a drop below which will push a five-month low back to the fore.
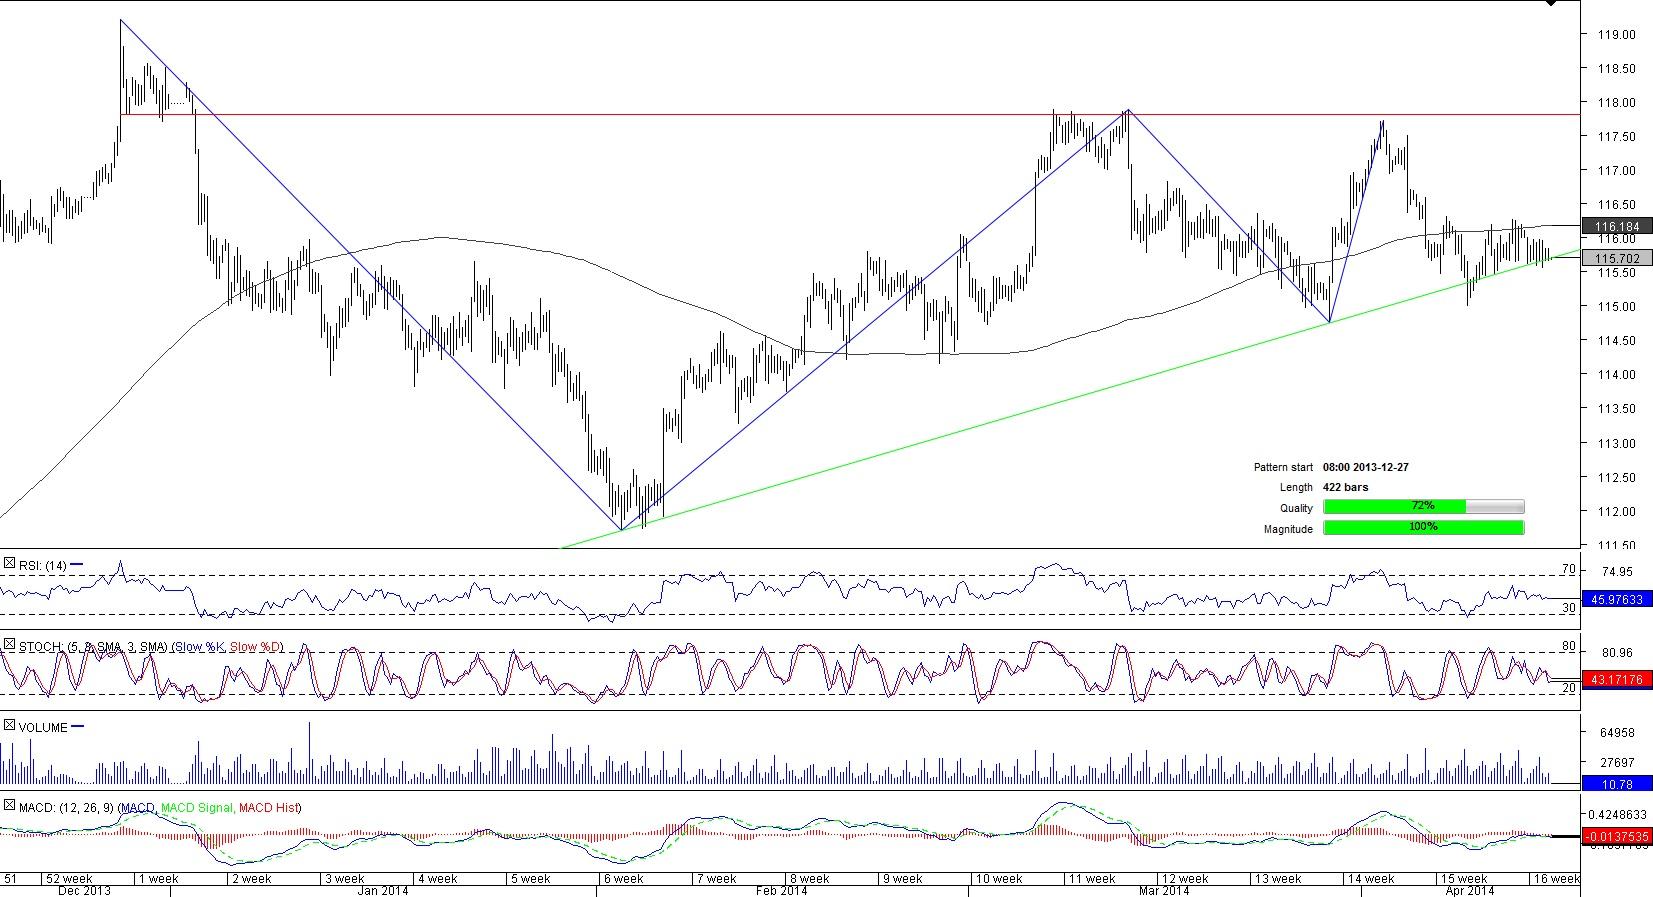
CHF/JPY 4H Chart: Ascending Triangle
Comment: Although a stab to a four-month high of 119.20 seems to have exhausted CHF/JPY potential, the pair managed to withstand the downside pressure and even shaped a bullish formation-ascending triangle pattern.
Now the pair is trading at the lower boundary of the pattern as 50-and 200-bar SMAs at 115.92 and 116.18 have been pressing the pair to this mark since the very beginning of April. Technical signals suggest the pair may retreat further in the short-term that may even lead to a breakout considering the current location of the pair; however, in the technical data does not point to a sell-off in the longer time frame.
This overview can be used only for informational purposes. Dukascopy SA is not responsible for any losses arising from any investment based on any recommendation, forecast or other information herein contained.
Recommended Content
Editors’ Picks
EUR/USD holds above 1.0700 ahead of key US data

EUR/USD trades in a tight range above 1.0700 in the early European session on Friday. The US Dollar struggles to gather strength ahead of key PCE Price Index data, the Fed's preferred gauge of inflation, and helps the pair hold its ground.
USD/JPY stays above 156.00 after BoJ Governor Ueda's comments

USD/JPY holds above 156.00 after surging above this level with the initial reaction to the Bank of Japan's decision to leave the policy settings unchanged. BoJ Governor said weak Yen was not impacting prices but added that they will watch FX developments closely.
Gold price oscillates in a range as the focus remains glued to the US PCE Price Index

Gold price struggles to attract any meaningful buyers amid the emergence of fresh USD buying. Bets that the Fed will keep rates higher for longer amid sticky inflation help revive the USD demand.
Sei Price Prediction: SEI is in the zone of interest after a 10% leap

Sei price has been in recovery mode for almost ten days now, following a fall of almost 65% beginning in mid-March. While the SEI bulls continue to show strength, the uptrend could prove premature as massive bearish sentiment hovers above the altcoin’s price.
US core PCE inflation set to signal firm price pressures as markets delay Federal Reserve rate cut bets

The core PCE Price Index, which excludes volatile food and energy prices, is seen as the more influential measure of inflation in terms of Fed positioning. The index is forecast to rise 0.3% on a monthly basis in March, matching February’s increase.


