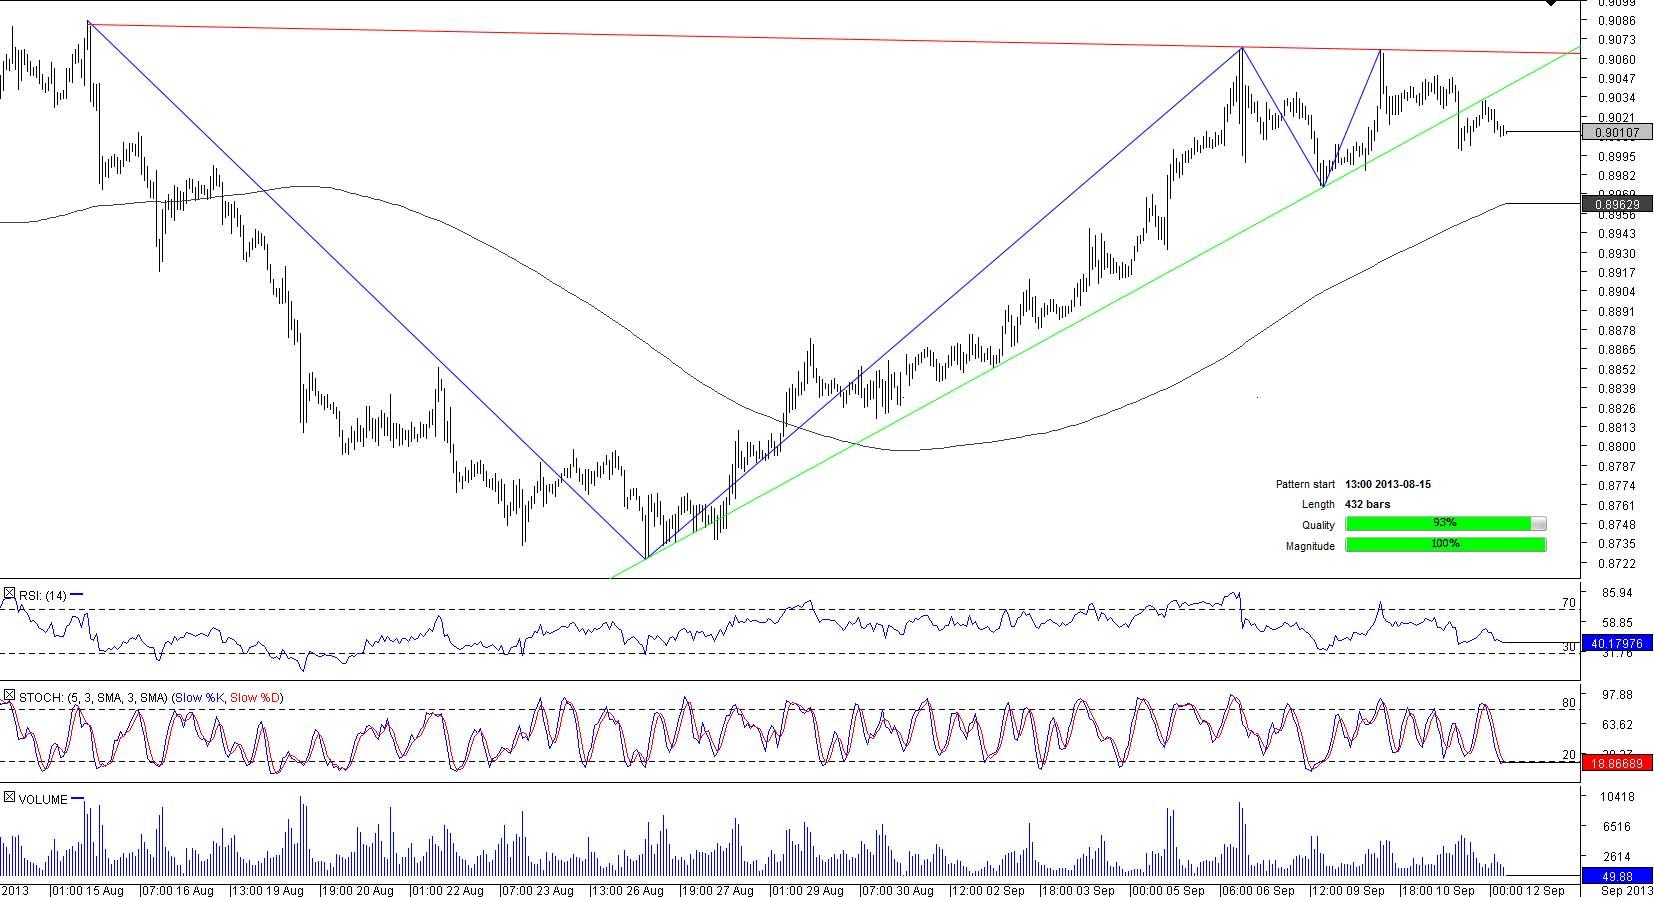
CAD/CHF 1H Chart: Triangle
Comment: The triangle pattern started on August 15, when the pair reached almost a one-month high of 0.9085. The pair had been bouncing off the pattern’s boundaries until it finally broke through the lower limit of the pattern on September 11 that is likely to be a starting point for an accelerating depreciation of the currency couple.
The pair is trading below its daily pivot point at 0.9023 but above its four-hour support line at 0.9003. The pair is likely to cross this support and move to the next support zone at 0.8997 (daily S1). The bearish scenario is also supported by traders, as about 54% of them bet on depreciation of the pair.
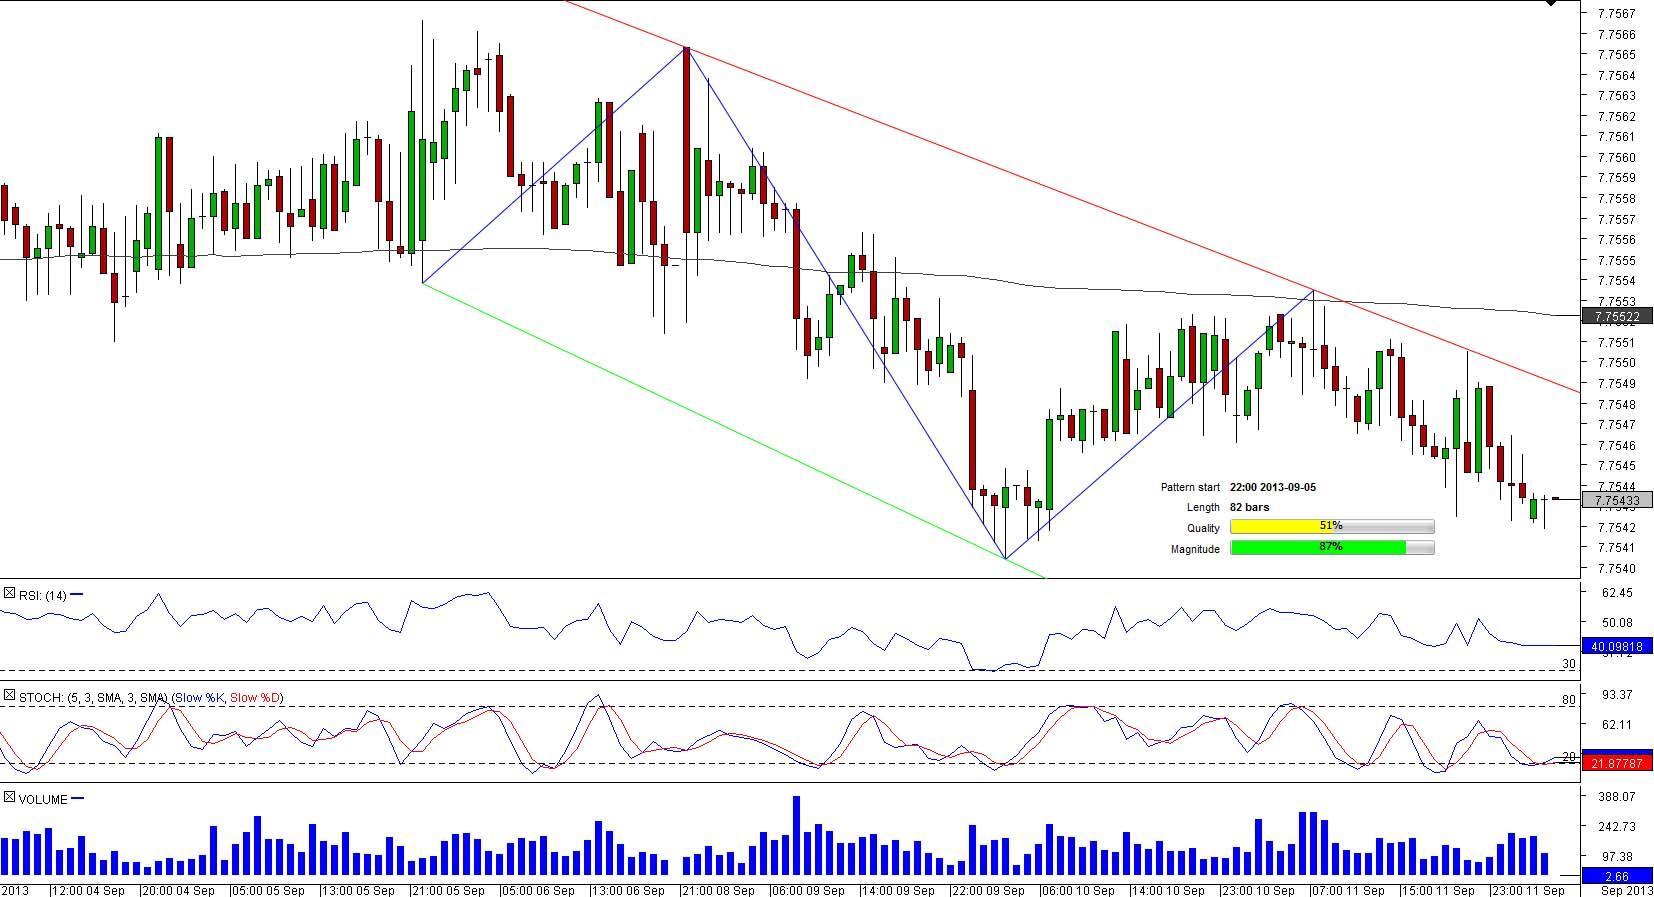
USD/HKD 1H Chart: Channel Down
Comment: USD/HKD surpassed its short-and long-term SMAs on September 5 and started a gradual retreat, fluctuating in a narrow corridor of two downward-sloping lines. On September 10, 50-hour SMA fell below 200-hour SMA creating a death cross that resulted in the pair’s decline to almost a two-week low of 7.7540. After hitting this low, USD/HKD slightly advanced to trade close to the support region at 7.7541 (daily S1; four-hour S1), but a further climb seems unlikely.
At the same time, technical indicators are sending mixed signals, predicting a jump in the short-term and a decline in the medium-term.
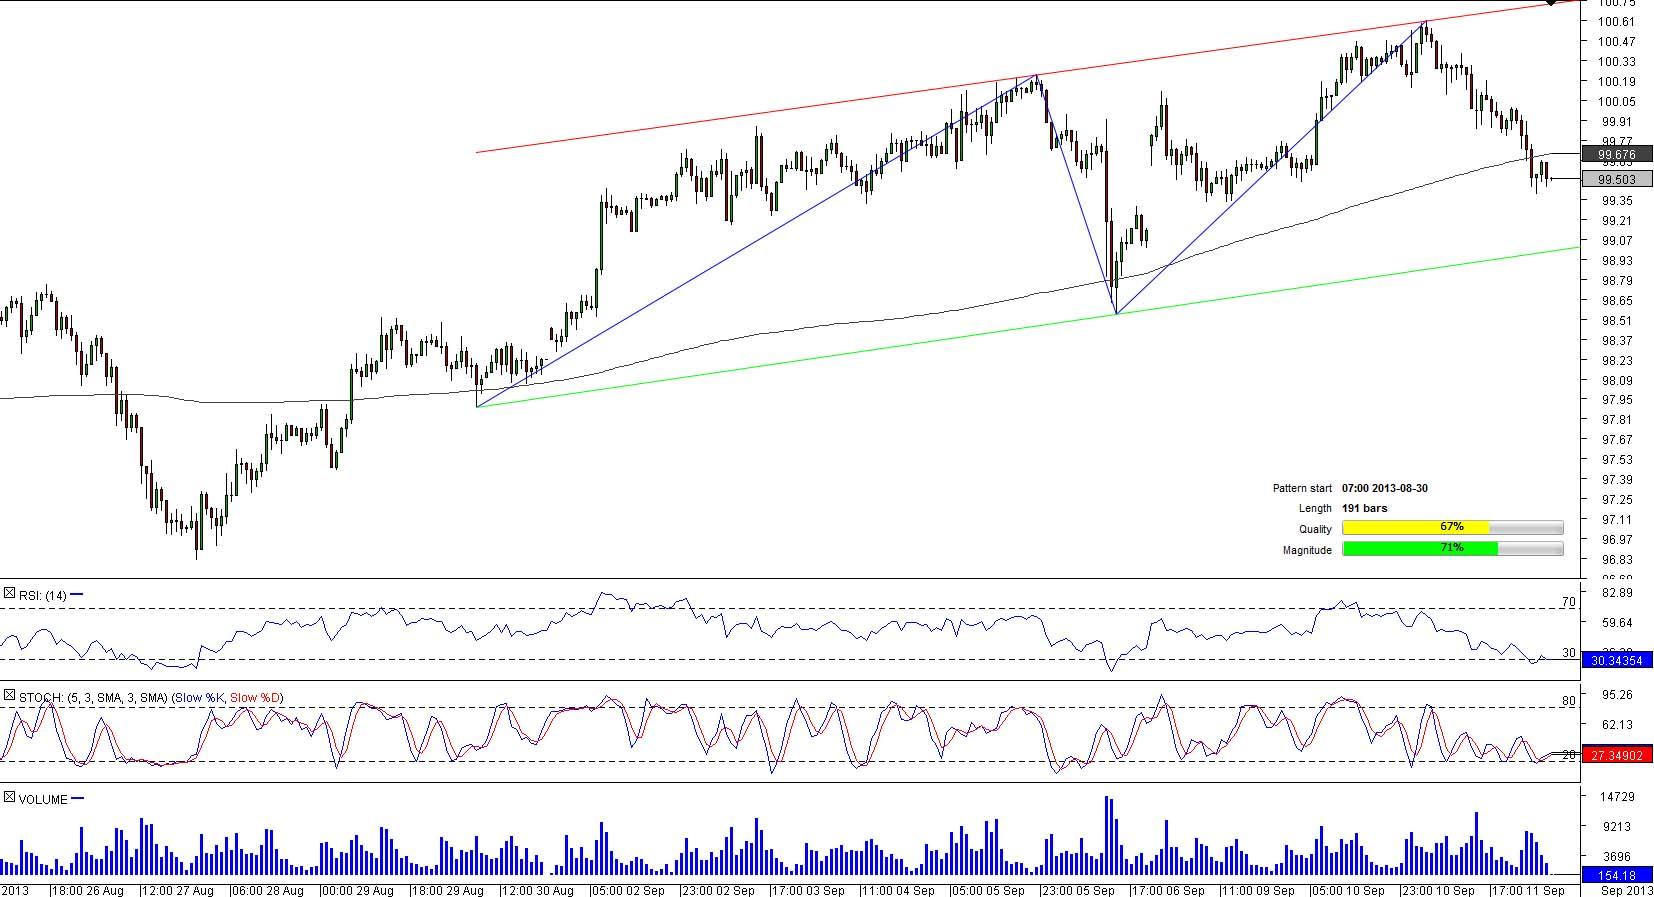
USD/JPY 1H Chart: Channel Up
Comment: On August 30, a golden cross was observable on the USD/JPY one-hour chart that was a start to the channel up pattern. At the moment, short-and long-term SMAs are meandering above USD/JPY that is struggling to remain above its four-hour support at 97.37 (four-hour S1). The pair is not likely to fall under this important support zone and may reverse its direction to the north to the 200-hour SMA, as market players are mostly bullish on the pair. However, a short-term decline also remains a possibility as technical indicators are bearish in the short-run. However, in the longer-term, the pair is expected to see a sharp advance.
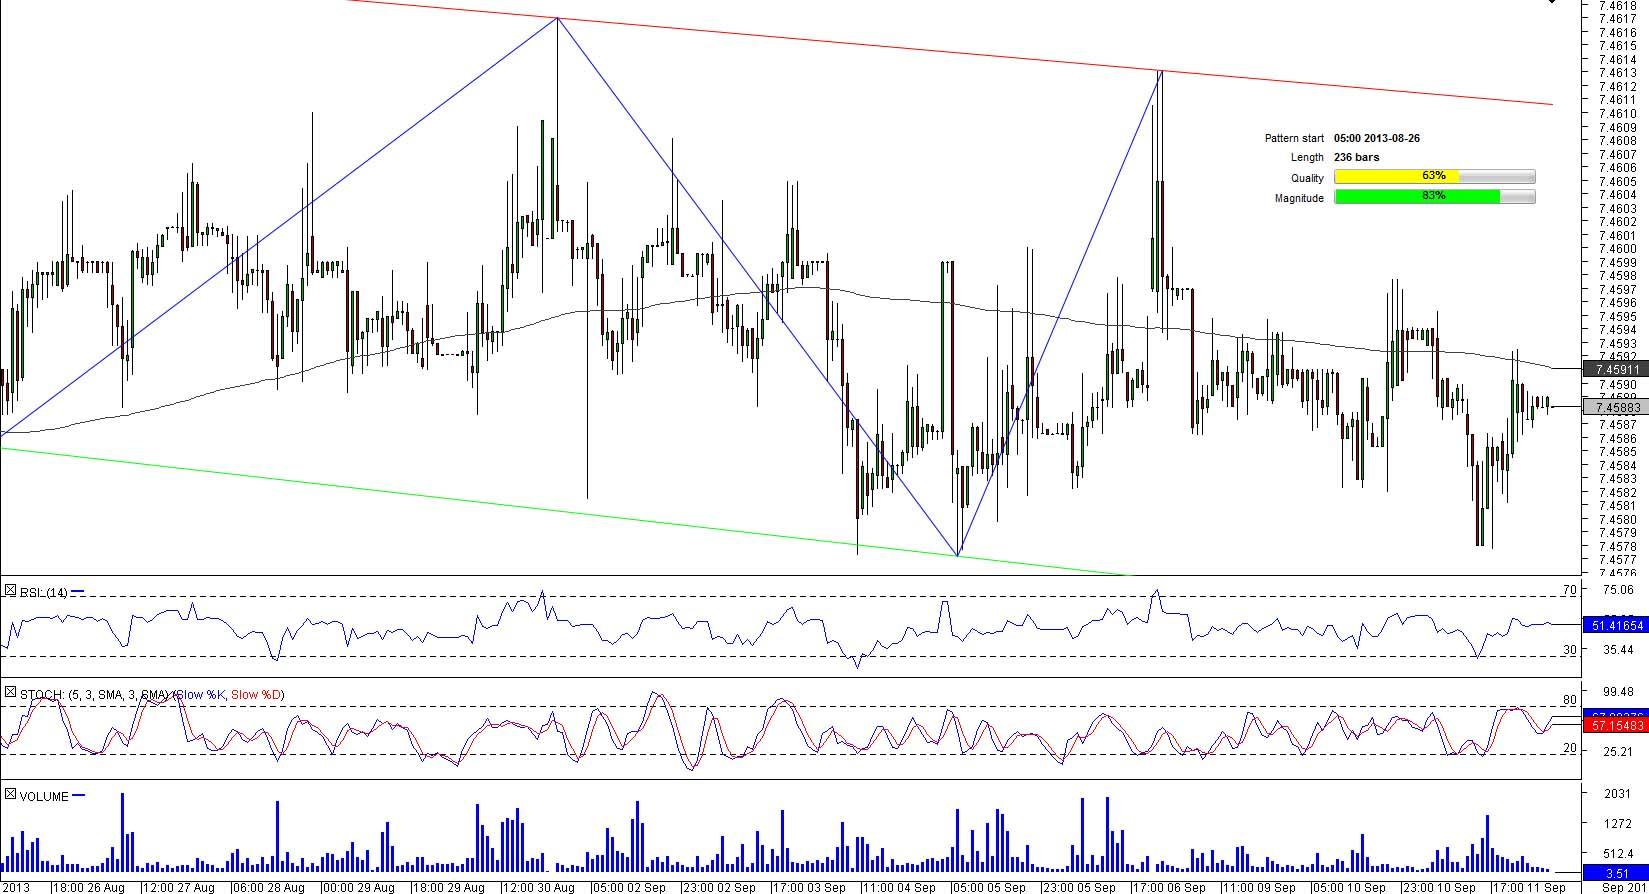
EUR/DKK 1H Chart: Channel Down
Comment: The channel down pattern formed by EUR/DKK pushed the pair below its short-and long-term SMAs to trade near the four-hour support line at 7.4584. Despite signs that a further decline is highly possible, traders are optimistic about the pair. The SWFX data shows 60% of market participants are bullish on EUR/DKK. To confirm the bullish outlook, the currency couple has to jump from the four-hour support region at 7.458 (four-hour S3) to attempt to surpass the level of 7.4585 that now acts as a strong resistance. After that the pair may try to approach its daily pivot point at 7.4587 that is likely to give EUR/DKK an impulse for further appreciation.
This overview can be used only for informational purposes. Dukascopy SA is not responsible for any losses arising from any investment based on any recommendation, forecast or other information herein contained.
Recommended Content
Editors’ Picks
EUR/USD trades with negative bias, holds above 1.0700 as traders await US PCE Price Index

EUR/USD edges lower during the Asian session on Friday and moves away from a two-week high, around the 1.0740 area touched the previous day. Spot prices trade around the 1.0725-1.0720 region and remain at the mercy of the US Dollar price dynamics ahead of the crucial US data.
USD/JPY jumps above 156.00 on BoJ's steady policy

USD/JPY has come under intense buying pressure, surging past 156.00 after the Bank of Japan kept the key rate unchanged but tweaked its policy statement. The BoJ maintained its fiscal year 2024 and 2025 core inflation forecasts, disappointing the Japanese Yen buyers.
Gold price flatlines as traders look to US PCE Price Index for some meaningful impetus

Gold price lacks any firm intraday direction and is influenced by a combination of diverging forces. The weaker US GDP print and a rise in US inflation benefit the metal amid subdued USD demand. Hawkish Fed expectations cap the upside as traders await the release of the US PCE Price Index.
Sei Price Prediction: SEI is in the zone of interest after a 10% leap

Sei price has been in recovery mode for almost ten days now, following a fall of almost 65% beginning in mid-March. While the SEI bulls continue to show strength, the uptrend could prove premature as massive bearish sentiment hovers above the altcoin’s price.
US economy: Slower growth with stronger inflation

The US Dollar strengthened, and stocks fell after statistical data from the US. The focus was on the preliminary estimate of GDP for the first quarter. Annualised quarterly growth came in at just 1.6%, down from the 2.5% and 3.4% previously forecast.


