The Trend Trader helps to identify the current trend status of your favorite ETF markets. It not only helps us to stay on the right side of market direction, but also helps us avoid those without a trend. You can even use the grid as a spread matrix too - buying strength and selling weakness.
Pivot Point analysis is merely a tool and should be used with other technical indicators. It can be used to enter a trade, or exit a trade and when combined with average true range is a powerful money management tool. Once you enter a trade, you are no longer a trader, you are a risk manager and should monitor your trades on a weekly or daily basis depending on volatility. When you enter a trade assume you are wrong and let the market prove you are right. This will diminish the hubris and arrogance that is common to many traders. Please use these Pivot Points as a guide to better trading.
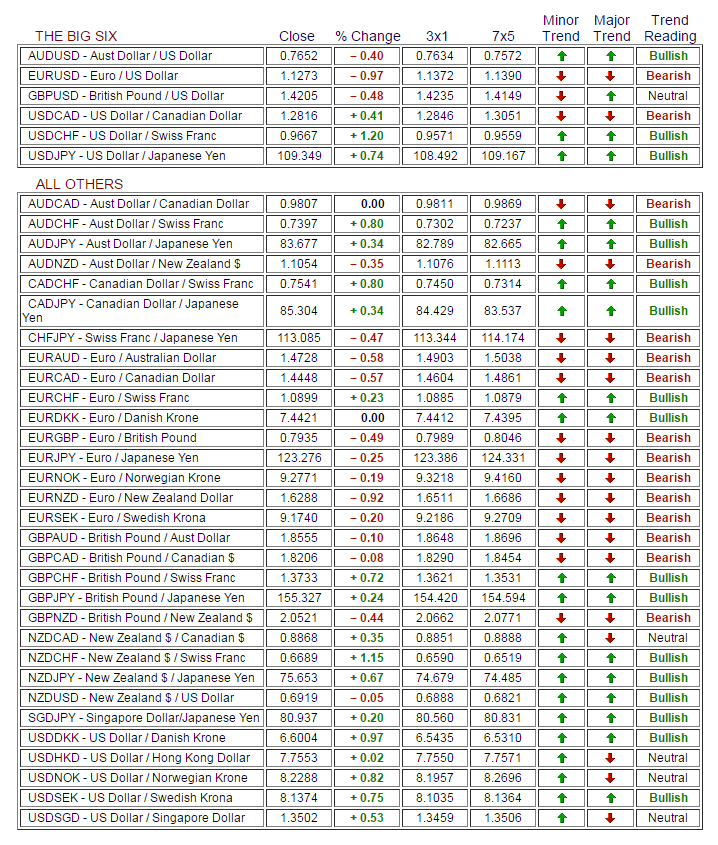
As you examine the work sheet, please note where there are two arrows confirming a trend. Be it long or short, a close must occur above or below two trend arrows to confirm a strong trend.
The short term trend is a three day moving average of the Daily Pivot. The long term trend is the Weekly Pivot. So we are comparing a short term moving average with a long term simple weekly average.
Remember, the 3x1 is a moving average of the Daily Pivot. If you are daytrading and the price of your commodity or financial instrument trades through the 3x1, you may want to stop and reverse.
Rules:
Price > than 3x1 and 7x5...Buy
Price < than 3x1and 7x5... Sell
Price > above 3x1 but < 7x5...minor buy
Price < below 3x1 but > 7x5...minor sell.
If you choose to ignore these guidelines, you will be a counter trend trader. There is usually more risk associated with trading against the trend.
You can use the grid as a spread matrix too - buying strength and selling weakness.
Pattern Trapper reports are compiled from sources believed to be reliable, but their accuracy cannot be guaranteed. There is substantial risk of loss in futures trading. There is no warranty, express or implied, in regards to the fitness of this information for any particular purpose. Past performance is not a guarantee of future results. All materials are copyright © 2009 by Bob Hunt. No part of these resources may be reproduced, stored or transmitted without the prior written permission of the copyright holder.
Recommended Content
Editors’ Picks
EUR/USD holds above 1.0700 ahead of key US data

EUR/USD trades in a tight range above 1.0700 in the early European session on Friday. The US Dollar struggles to gather strength ahead of key PCE Price Index data, the Fed's preferred gauge of inflation, and helps the pair hold its ground.
USD/JPY stays above 156.00 after BoJ Governor Ueda's comments

USD/JPY holds above 156.00 after surging above this level with the initial reaction to the Bank of Japan's decision to leave the policy settings unchanged. BoJ Governor said weak Yen was not impacting prices but added that they will watch FX developments closely.
Gold price oscillates in a range as the focus remains glued to the US PCE Price Index

Gold price struggles to attract any meaningful buyers amid the emergence of fresh USD buying. Bets that the Fed will keep rates higher for longer amid sticky inflation help revive the USD demand.
Sei Price Prediction: SEI is in the zone of interest after a 10% leap

Sei price has been in recovery mode for almost ten days now, following a fall of almost 65% beginning in mid-March. While the SEI bulls continue to show strength, the uptrend could prove premature as massive bearish sentiment hovers above the altcoin’s price.
US core PCE inflation set to signal firm price pressures as markets delay Federal Reserve rate cut bets

The core PCE Price Index, which excludes volatile food and energy prices, is seen as the more influential measure of inflation in terms of Fed positioning. The index is forecast to rise 0.3% on a monthly basis in March, matching February’s increase.