Avi Gilburt: Heading to S&P 2150? (ElliottWaveTrader.net)
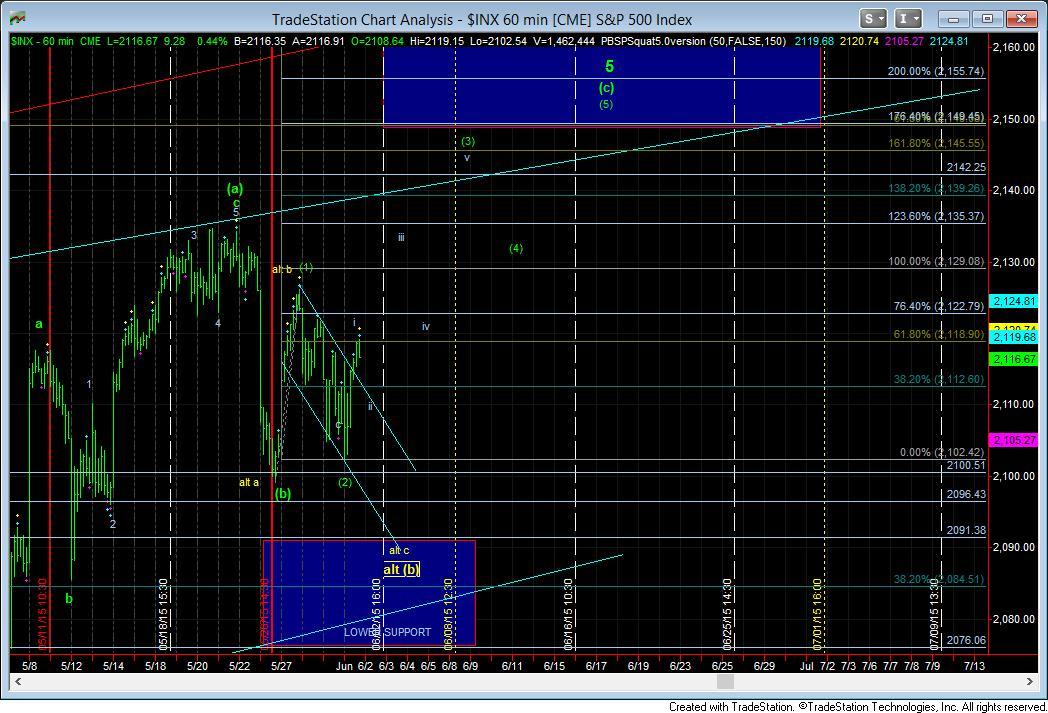
As per the weekend analysis, with the 2100SPX line in the sand holding today, the market has moved up to the .618 extension within its Fibonacci Pinball structure. This means we should see a corrective pullback from here, which will likely test the top of the break out channel.
The most likely path towards the 2150 region has been added to the attached chart. As long as the next pullback is corrective and does not break today’s low, I am looking for us to head up to the 2130SPX region, which will then provide us with another corrective pullback/consolidation in wave iv of (3). That will likely be what we see tomorrow.
So, for now, as long as we do not breach today’s lows, I am looking up for the next week, with the top to this structure potentially completing by next week.
And, as you know, should we break below today's lows, then the alternative count noted in yellow will be applicable. However, the pattern is much more suggestive of further highs to be seen later this week.
Mike Paulenoff: Bears on Defensive (MPTrader.com)
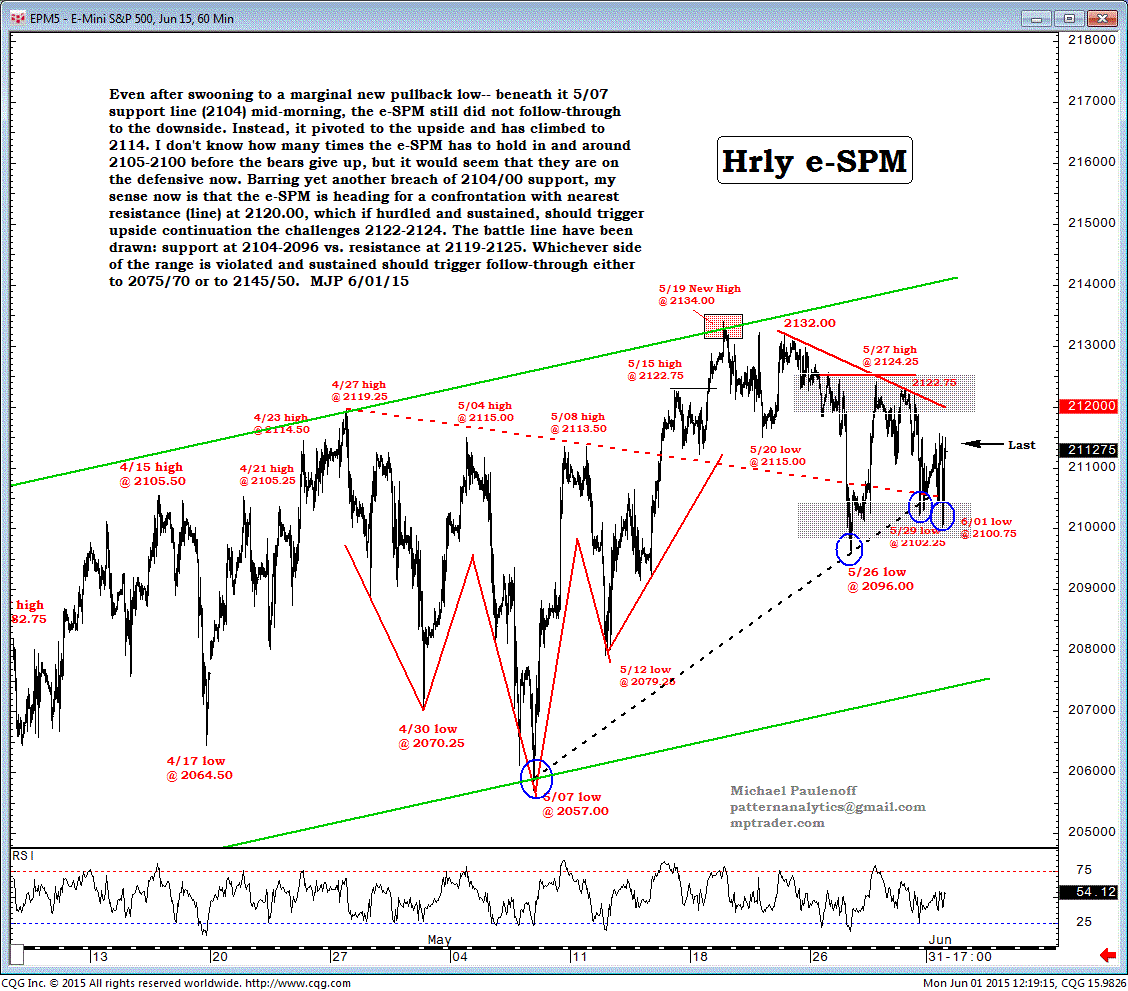
Even after swooning to a marginal new pullback low-- beneath it May 7 support line (2104) mid-morning, the e-SPM still did not follow through to the downside.
Instead, it pivoted to the upside and has climbed to 2114.
I don't know how many times the e-SPM has to hold in and around 2105-2100 before the bears give up, but it would seem that they are on the defensive now.
Barring yet another breach of 2104/00 support, my sense now is that the e-SPM is heading for a confrontation with nearest resistance (line) at 2120.00, which if hurdled and sustained, should trigger upside continuation the challenges 2122-2124.
The battle line have been drawn: support at 2104-2096 vs. resistance at 2119-2125.
Whichever side of the range is violated and sustained should trigger follow-through either to 2075/70 or to 2145/50.
Harry Boxer's Charts of the Day: 15 Movers to Watch (www.TheTechTrader.com)
The indices had a pretty good rally on Monday off of a mutual sharp dropping, holding secondary support. It’s a very resilient market, and the stocks that we’ve traded have done well. Some of our swings are acting very well.
Advaxis, Inc. (ADXS) was up 3.61 to 28.77, or 14%, on 3 million shares. Since first being spotted, this stock has gone up 400%. Since we had the last swing on it, it has gone from 8.00 to the 28-9 range, and doesn’t look like it’s stopping any time soon. Its channel calls for a lateral-price resistance at 34, and then 38 as targets, potentially. Keep your eye on this one and continue to raise your stops.
Infinera Corporation (INFN), one of our Top 25 picks for the year, was up 43 cents to 21.07, or 2%, on 1.8 million shares on Monday. It continues to step its way higher, but the reason it’s one of the charts here is because of its move through resistance. The pullback late in the day may signal a swing trade. It could get to 23, and then 27, which are the targets.
Momenta Pharmaceuticals Inc. (MNTA) is still moving up, and on Monday it was up 1.27 to 21.12, or 6.4%, on 2.4 million shares. After the base, the run-up, and then the wedge, it broke out of the wedge. With the volume increasing to 2.4 million shares, and then pulling back midday, look for it to run up to 25-6, and the 29.
Opko Health, Inc. (OPK) popped out of the little pennant, or wedge, on Monday, up 63 cents to 18.31, or 3.56%, on 3.3 million shares. That’s the best volume in 6 sessions. At this point, if there’s a follow-through, look for 20, and then 23 going forward.
Other stocks on Harry’s Charts of the Day included AirMedia Group Inc. (AMCN), Infoblox Inc. (BLOX), BroadSoft, Inc. (BSFT), CorMedix, Inc. (CRMD), eBay Inc. (EBAY), Exelixis, Inc. (EXEL), FireEye, Inc. (FEYE), Heron Therapeutics, Inc. (HRTX), ImmunoGen, Inc. (IMGN), NeoPhotonics Corporation (NPTN), Ignyta, Inc. (RXDX), SolarEdge Technologies, Inc. (SEDG), Sigma Designs, Inc. (SIGM), and Net 1 Ueps Technologies Inc. (UEPS).
Jack Steiman: Trendless Market (www.SwingTradeOnline.com)
The market has no trend you can count on. It's been that way for a drop over six months now. When a market is in a trend you can count on, technical analysis flows. Charts flow in a rhythm. When there is no trend there's no flow meaning you can look at a chart and say you think it should do one thing, but you can't count on it, because the lack of trend is like opening a new book each and every day. A non-trending market equals a market of frustration and a lack of consistent action, thus you need to keep your expectations down big time. Not over play because so many set-ups simply won't work. They may look good, but you can't count on getting out of it what you see on a given day. A different book is what causes the biggest losses as many get caught in the moment, with what seems to be rather than losing that expectation.
It looks good, thus, it will play out favorably. Not necessarily. Not by any means. You need to play more from fear. You need to recognize what having no trend in place equates to. We can all wish this away, but since we're nearly at the same price we were in late December, you should cool off your expectations on just about everything you see at the close of any given day. Deathly charts can turn beautiful the next day and great charts can turn around and head south in a hurry. Again, no rhythm is a non-trending market. Respect that message since it has been this way since late December. The market has sent a message for all to hear if you tune in. Stay on the right dial. When the market turns directional one of these days you can play the same book as it flows. Right now there is no flow at all. Adapt and adjust to this reality for the sake of your portfolio.
When I study the daily chart, we all know it's in this ridiculous base but we have to try to see what the bigger picture may be saying, although what I've written above makes that unreliable. However, it's my job to try and dissect it the best I can and when I study it there really aren't any excuses for the bulls. The new breakout area has been extended to a double top at 2134 meaning we need a forceful, higher volume close above 2134 to get more excited about a directional move finally trying to kick in with some gusto. The oscillators are always key on those daily index charts and they're nothing, but solid if you want to play the home game of HOPE!
Inconsistent markets only allow for hope, so if I choose to play that game there's a lot of room on those daily index oscillators for higher prices to be created without getting overbought. In a normal environment I have to admit that the set up would have me on the bullish side of the ledger. It's rare for the bulls not to take it when it's there but they surely are not taking it right now although they're far from giving it up as well. The next many days will be interesting if nothing else. The bulls should be able to take it based on what I'm seeing but I have no confidence in saying that until they can prove it. That's what six months of mindless meandering will do to you. I'll believe only when I see it. It's there for the taking. Will the bulls take it? We will know soon enough. Or not!
The transports are what everyone is talking about these days. You know I believe they're incredibly over rated in terms of predicting what the market will do. We have proof of that since it has underperformed for quite some time now while the market has overall trended higher. Too much Dow-theory nonsense in my book, but it always helps to have key sectors participating. With rotation we surely have had enough of them pulling their weight but not he transports. They had a great reversal day off of very oversold daily conditions and this gives hope for an overall rally to continue. Not every day, but hope of more of an uptrend overall. If this sector can impulse up on its oscillators on a continued short-term rally, and then pull back lightly, the lows may be in. We shall see and it's way too early to predict but there's some hope there.
Most other important sectors are hanging, and that's always the bigger picture key, not just one sector, but maybe we're now beginning to see a reversal in those nastily behaving transports. A day at a time as always in this nowhere market.
Sinisa Persich: Eye on DISCA and GMED (TraderHR.com)
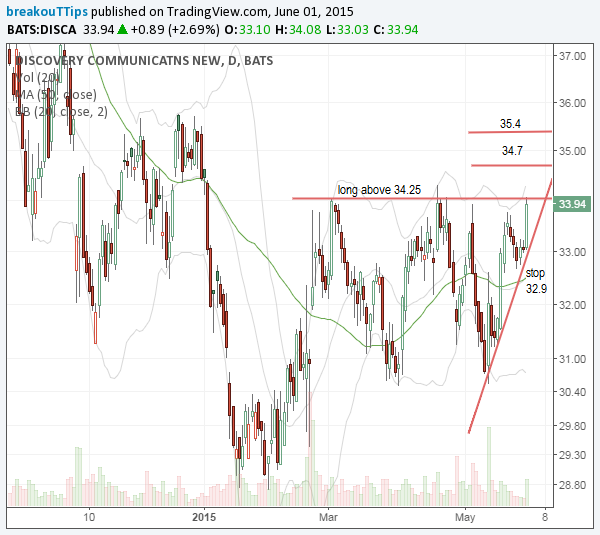
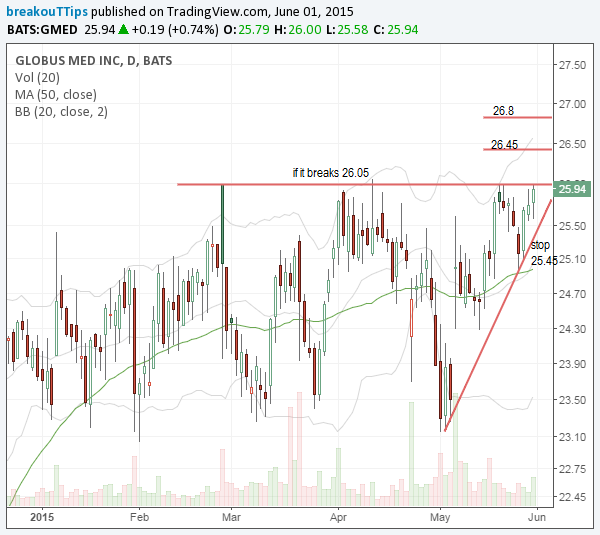
The chart patterns of both these stocks are pushing against key lateral resistance, with both stocks in a sideways pattern that appears poised to break out and continue the uptrend.
Information on these pages contains forward-looking statements that involve risks and uncertainties. Markets and instruments profiled on this page are for informational purposes only and should not in any way come across as a recommendation to buy or sell in these assets. You should do your own thorough research before making any investment decisions. FXStreet does not in any way guarantee that this information is free from mistakes, errors, or material misstatements. It also does not guarantee that this information is of a timely nature. Investing in Open Markets involves a great deal of risk, including the loss of all or a portion of your investment, as well as emotional distress. All risks, losses and costs associated with investing, including total loss of principal, are your responsibility. The views and opinions expressed in this article are those of the authors and do not necessarily reflect the official policy or position of FXStreet nor its advertisers. The author will not be held responsible for information that is found at the end of links posted on this page.
If not otherwise explicitly mentioned in the body of the article, at the time of writing, the author has no position in any stock mentioned in this article and no business relationship with any company mentioned. The author has not received compensation for writing this article, other than from FXStreet.
FXStreet and the author do not provide personalized recommendations. The author makes no representations as to the accuracy, completeness, or suitability of this information. FXStreet and the author will not be liable for any errors, omissions or any losses, injuries or damages arising from this information and its display or use. Errors and omissions excepted.
The author and FXStreet are not registered investment advisors and nothing in this article is intended to be investment advice.
Recommended Content
Editors’ Picks
EUR/USD trades with negative bias, holds above 1.0700 as traders await US PCE Price Index

EUR/USD edges lower during the Asian session on Friday and moves away from a two-week high, around the 1.0740 area touched the previous day. Spot prices trade around the 1.0725-1.0720 region and remain at the mercy of the US Dollar price dynamics ahead of the crucial US data.
USD/JPY jumps above 156.00 on BoJ's steady policy

USD/JPY has come under intense buying pressure, surging past 156.00 after the Bank of Japan kept the key rate unchanged but tweaked its policy statement. The BoJ maintained its fiscal year 2024 and 2025 core inflation forecasts, disappointing the Japanese Yen buyers.
Gold price flatlines as traders look to US PCE Price Index for some meaningful impetus

Gold price lacks any firm intraday direction and is influenced by a combination of diverging forces. The weaker US GDP print and a rise in US inflation benefit the metal amid subdued USD demand. Hawkish Fed expectations cap the upside as traders await the release of the US PCE Price Index.
Sei Price Prediction: SEI is in the zone of interest after a 10% leap

Sei price has been in recovery mode for almost ten days now, following a fall of almost 65% beginning in mid-March. While the SEI bulls continue to show strength, the uptrend could prove premature as massive bearish sentiment hovers above the altcoin’s price.
US economy: Slower growth with stronger inflation

The US Dollar strengthened, and stocks fell after statistical data from the US. The focus was on the preliminary estimate of GDP for the first quarter. Annualised quarterly growth came in at just 1.6%, down from the 2.5% and 3.4% previously forecast.


