Jack Steiman, On Rotation the Name of Game (SwingTradeOnline.com)
Just because sentiment is poor, and the weekly and monthly charts look awful, doesn't mean the market should fall, now does it? Not with Ms. Yellen and those low rates into perpetuity. The Fed is protecting this very long-term market with low rates. Ms. Yellen has made it very clear that low rates near zero will be with us through 2015 at the very least. There's no accident in that reminder she seems to send out every other week. So, with the Fed keeping rates this low, rotation is the name of the game. Sure, we have a bear market in froth stocks, but we don't have even a real correction in the overall market. Lower P/E stocks with solid earnings are holding this market up. Folks don't want to leave the market -- they just want to place their money in the land of safety.
The market started out quietly higher Monday morning with the Nasdaq leading early on. After the Nasdaq reached up about 20 points it fell hard, moving down 30 points in a hurry to a minus reading for the day. Things looked bad, but once again buyers came, and slowly but surely we crept back up for the rest of the day, gaining back to the levels we saw early on. When studying those daily charts, especially the Nasdaq chart, we see a deep compression at the bottom MACD that suggests we can back test the 50-day exponential moving average at 4172. We closed at 4121. There's no guarantee we get there, by any means, but the MACD suggests the possibility to be sure. With the weekly and monthly charts as they are, and with sentiment still a bit of a headache, falling from any level at any point can't be said to be inappropriate. Things are set up to fall. On the other hand, with the S&P 500 and Dow already well back above their 50's, we can possibly hit new highs on those indexes if the Nasdaq does, indeed, make it up to its 50's. I don't know, at this point, what the catalyst could be for the correction to get under way, except for additional very bad news overseas, or terrible earnings news. The news on the earnings front hasn't been wonderful, but it has been far from terrible as well. Netflix, Inc. (NFLX) was up nicely Monday night. There just isn't much for the bears here at this moment in time. Avoid froth and pick your spots is all you can do in this very tough environment.
Mike Paulenoff, On Recovery Off the Pullback Lows (MPTrader.com)
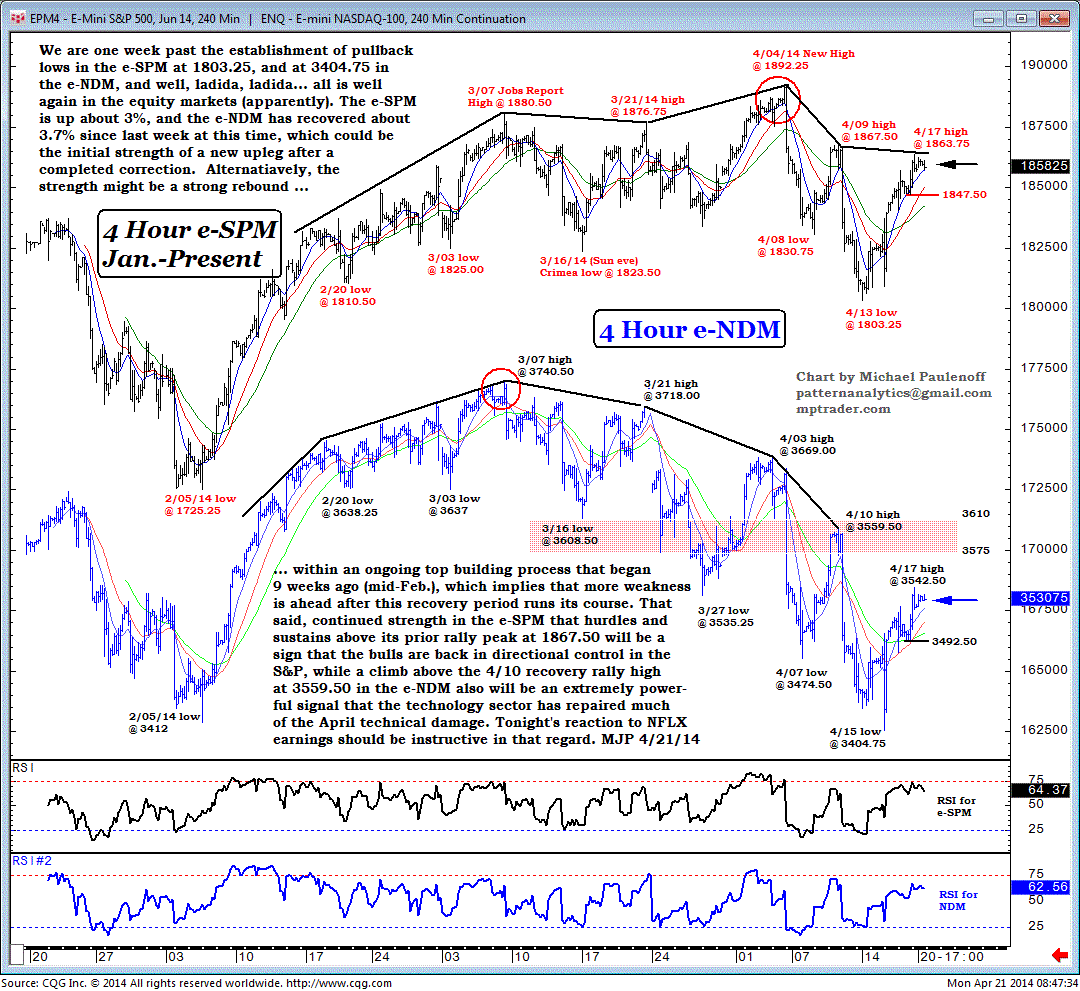
We are one week past the establishment of pullback lows in the Emini S&P 500 (e-SPM) at 1803.25, and at 3404.75 in the Emini Nasdaq 100 (e-NDM), and well, ladida, ladida! All is well again in the equity markets, apparently.
The e-SPM is up about 3%, and the e-NDM has recovered about 3.7% since last week at this time, which could be the initial strength of a new upleg after a completed correction.
Alternatively, the strength might be a strong rebound within an ongoing top-building process that began 9 weeks ago in mid-February, which implies that more weakness is ahead after this recovery period runs its course.
That said, continued strength in the e-SPM that hurdles and sustains above its prior rally peak at 1867.50 will be a sign that the bulls are back in directional control in the S&P 500.
A climb above the April 10 recovery-rally high at 3559.50 in the e-NDM also will be an extremely powerful signal that the technology sector has repaired much of the April technical damage.
Monday night's reaction to Netflix, Inc. (NFLX) earnings should be instructive in that regard.
Garrett Patten, On Wave Counts for Expected Pullback (ElliottWaveTrader.net)
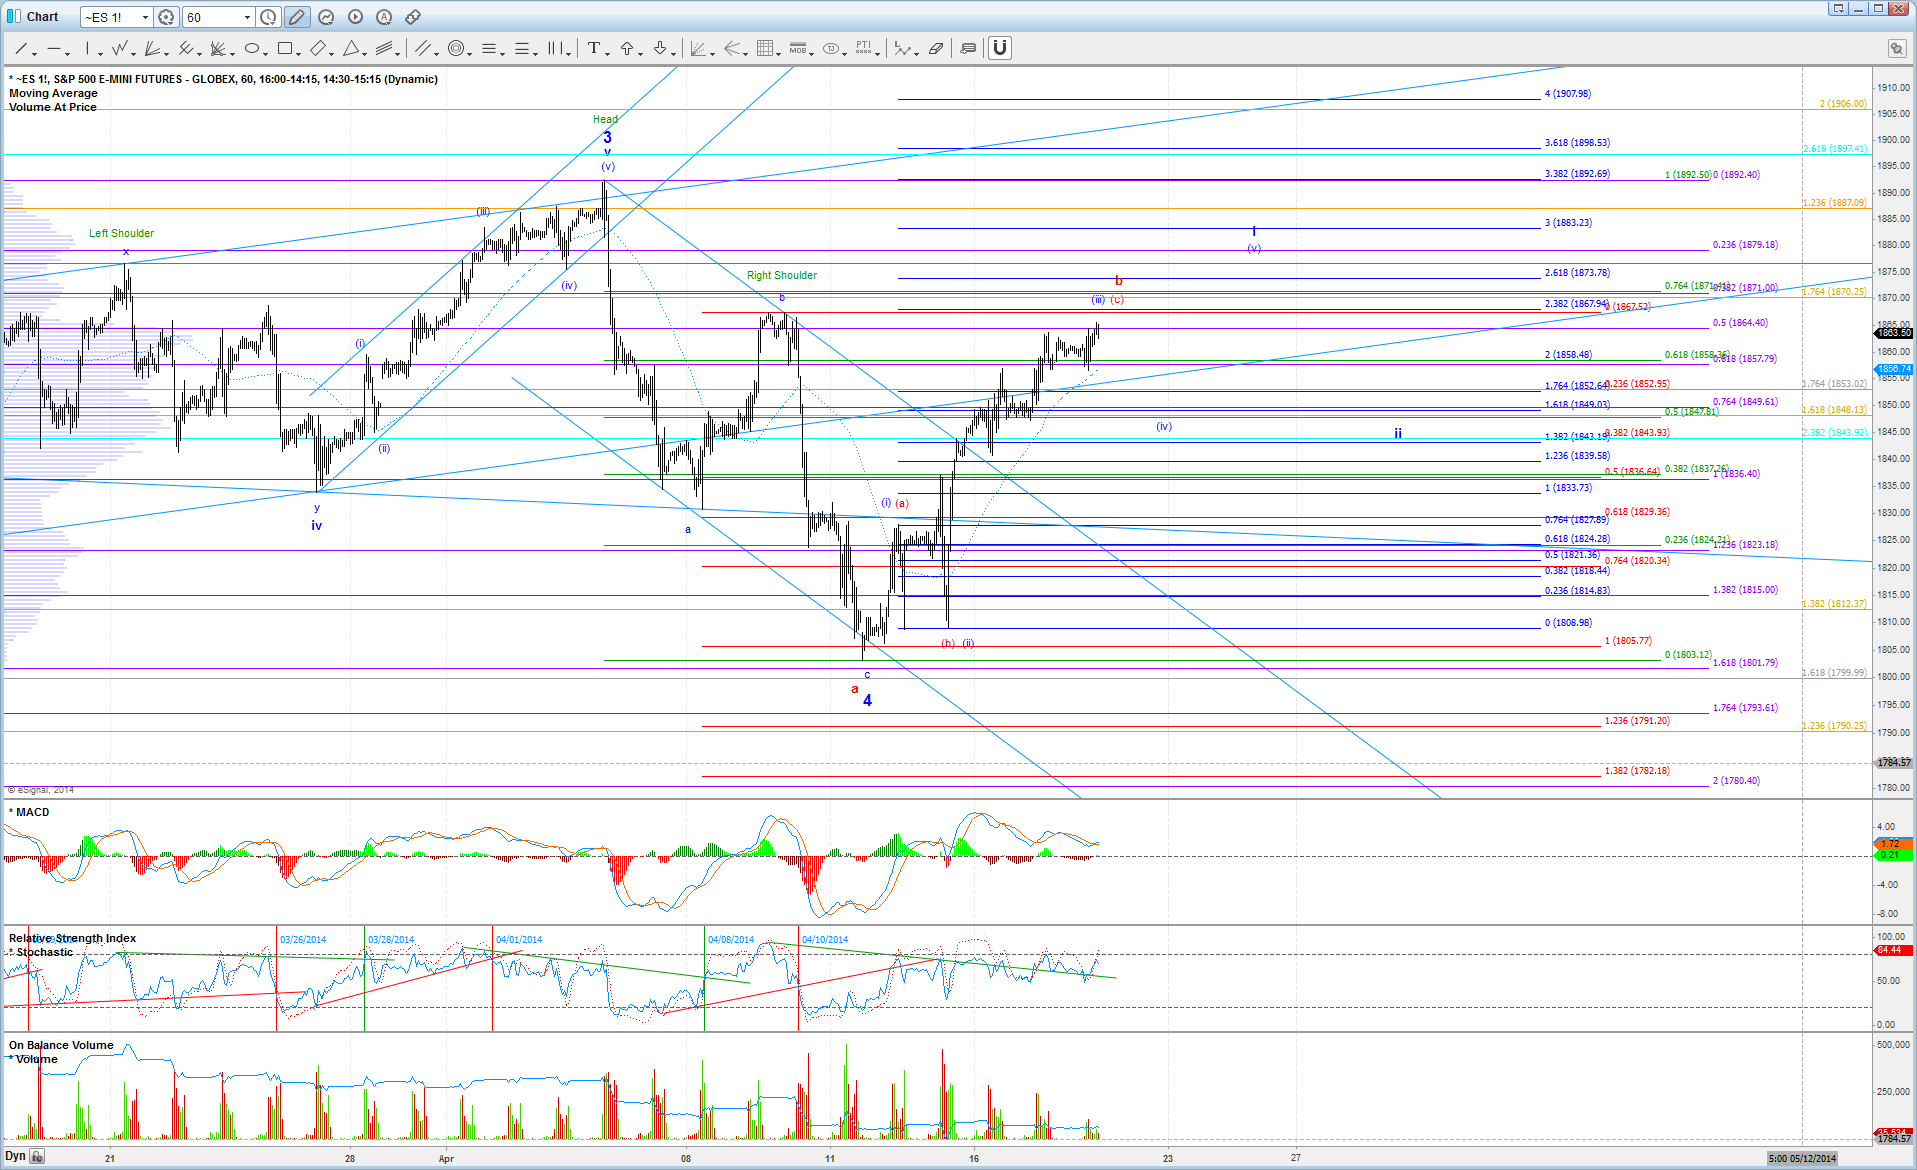
Monday's market update is going to be short and sweet, since very little has changed after this tepid price action on light volume. We are still expecting a pullback, even under the bullish count, between here and 1871.
If the bearish red count on my chart is playing out, the pullback should look clearly impulsive and break below 1840 eventually to confirm. Otherwise, if the pullback looks corrective, and holds between 1850 and 1843, then it is likely just a wave (iv) in the bullish blue count, and we can expect another high in wave (v) to follow.
Harry Boxer, On Charts to Watch for Tuesday (TheTechTrader.com)
We're going to take a look at both longs and shorts in tonight's Charts of the Day.
Micron Technology Inc. (MU) had a big snapback on Monday, up 1.41, or 5.9%, on 45.3 million shares. It had a double-bottom in January, held twice in April, so with the spike up to retest the high Monday, if it gets through this, it may very well extend to mid-channel around 27-8, and then into the low-to-mid 30's, eventually.
POZEN Inc. (POZN) broke out on Monday, up 50 cents, or 5.75%, on 1.5 million shares. It looks like it may get up to the 10-range as early as Tuesday. If it gets through there, this could be a 12 1/2-dollar stock.
Stocks on the Short Side...
Proto Labs, Inc. (PRLB) is one of the stocks in the group that didn't collapse completely. It had a long channel up, it rolled over, formed a mini-channel up, rolled over, bounced, pulled back, bounced, pulled back again, and now it's at the lowest point it's been since July. If it breaks 62, it could see 58, and then 55, maybe quickly.
Rent-A-Center, Inc. (RCII) had a big top, it rolled over, formed a big breakaway gap, then a rising wedge, and on Monday, it collapsed, down 36 cents, or 1.38%. This stock may be testing the 20-1 zone very soon.
Other stocks on Harry's Charts of the Day are Alliance Fiber Optic Products Inc. (AFOP), Advanced Micro Devices, Inc. (AMD), ANI Pharmaceuticals, Inc. (ANIP), Abraxas Petroleum Corp. (AXAS), Cytokinetics, Incorporated (CYTK), First Solar, Inc. (FSLR), GT Advanced Technologies Inc. (GTAT), Maxwell Technologies, Inc. (MXWL), Ultra Petroleum Corp. (UPL), and Warren Resources Inc. (WRES).
Stocks on the short side include Arctic Cat Inc. (ACAT), Bed Bath & Beyond Inc. (BBBY), Barrett Business Services Inc. (BBSI), First Cash Financial Services Inc. (FCFS), Chart Industries Inc. (GTLS), Home Inns & Hotels Management Inc. (HMIN), China Lodging Group, Limited (HTHT), Nationstar Mortgage Holdings Inc. (NSM), Splunk, Inc. (SPLK), and Workday, Inc. (WDAY).
Sinisa Persich, On Free Stock Pick for Tuesday (TraderHR.com)
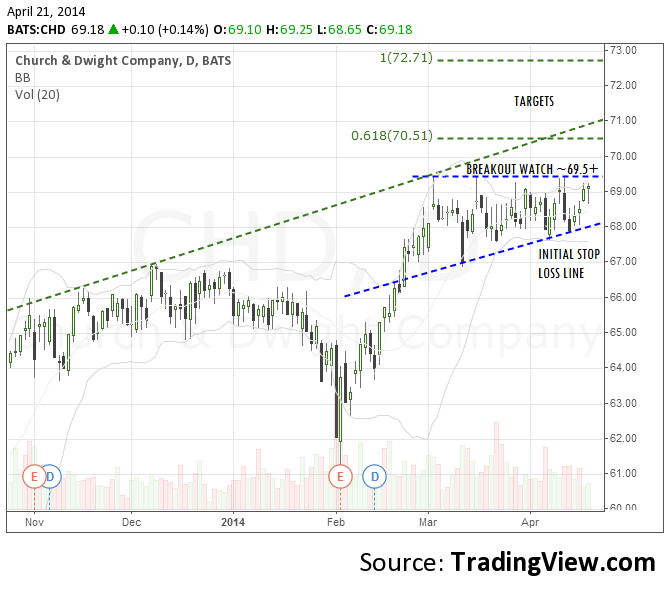
Church & Dwight Co. Inc. (CHD) is consolidating in an ascending triangle pattern with horizontal resistance at around the 69.5 zone. A break of that level could lead to acceleration toward 70-71.
This Web site is published by AdviceTrade, Inc. AdviceTrade is a publisher and not registered as a securities broker-dealer or investment advisor either with the U.S. Securities and Exchange Commission or with any state securities authority. The information on this site has been obtained from sources considered reliable but we neither guarantee nor represent the completeness or accuracy of the information. In addition, this information and the opinions expressed are subject to change without notice. Neither AdviceTrade nor its principals own shares of, or have received compensation by, any company covered or any fund that appears on this site. The information on this site should not be relied upon for purposes of transacting securities or other investments, nor should it be construed as an offer or solicitation of an offer to sell or buy any security. AdviceTrade does not assess, verify or guarantee the suitability or profitability of any particular investment. You bear responsibility for your own investment research and decisions and should seek the advice of a qualified securities professional before making any investment.
Recommended Content
Editors’ Picks
EUR/USD trades with negative bias, holds above 1.0700 as traders await US PCE Price Index

EUR/USD edges lower during the Asian session on Friday and moves away from a two-week high, around the 1.0740 area touched the previous day. Spot prices trade around the 1.0725-1.0720 region and remain at the mercy of the US Dollar price dynamics ahead of the crucial US data.
USD/JPY jumps above 156.00 on BoJ's steady policy

USD/JPY has come under intense buying pressure, surging past 156.00 after the Bank of Japan kept the key rate unchanged but tweaked its policy statement. The BoJ maintained its fiscal year 2024 and 2025 core inflation forecasts, disappointing the Japanese Yen buyers.
Gold price flatlines as traders look to US PCE Price Index for some meaningful impetus

Gold price lacks any firm intraday direction and is influenced by a combination of diverging forces. The weaker US GDP print and a rise in US inflation benefit the metal amid subdued USD demand. Hawkish Fed expectations cap the upside as traders await the release of the US PCE Price Index.
Sei Price Prediction: SEI is in the zone of interest after a 10% leap

Sei price has been in recovery mode for almost ten days now, following a fall of almost 65% beginning in mid-March. While the SEI bulls continue to show strength, the uptrend could prove premature as massive bearish sentiment hovers above the altcoin’s price.
US economy: Slower growth with stronger inflation

The US Dollar strengthened, and stocks fell after statistical data from the US. The focus was on the preliminary estimate of GDP for the first quarter. Annualised quarterly growth came in at just 1.6%, down from the 2.5% and 3.4% previously forecast.


