EUR/USD
Challenging its short-term declining trendline.
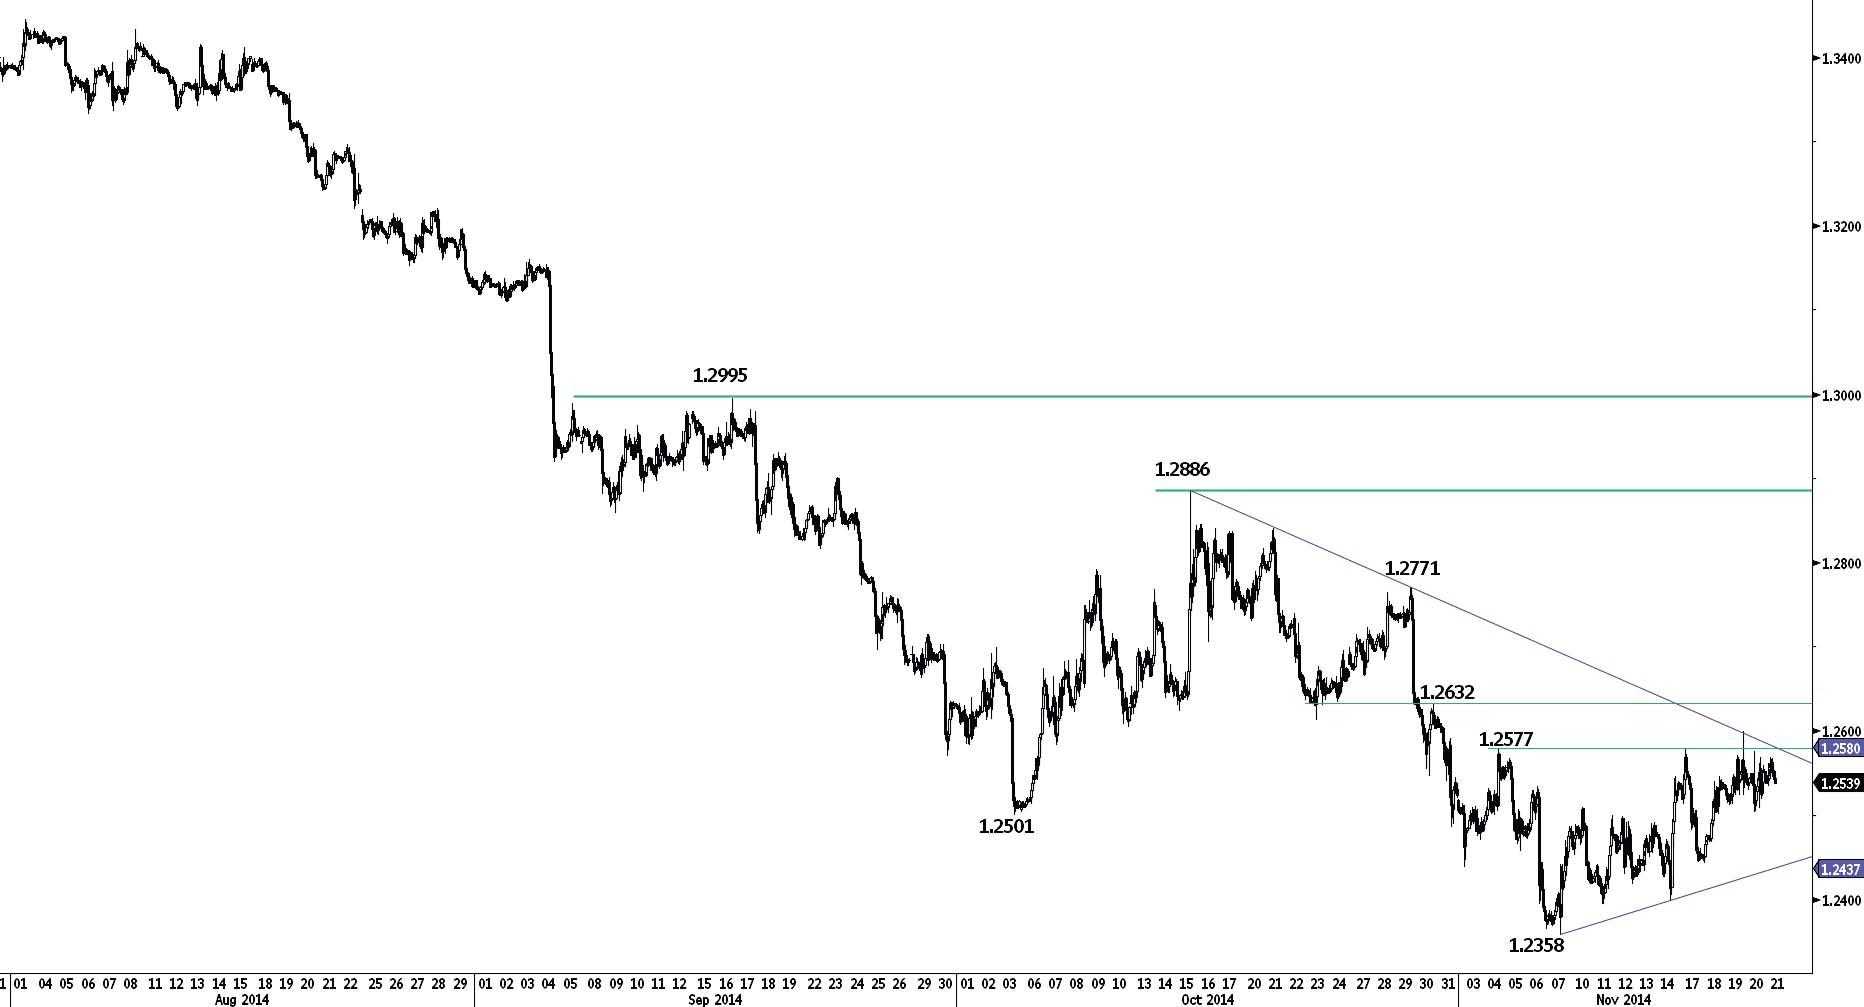
EUR/USD is challenging the resistance at 1.2577 (see also the declining trendline). A break of the hourly support at 1.2502 (intraday low) would signal a weakening buying interest. Other hourly supports stand at 1.2444 (18/11/2014 low) and 1.2395 (11/11/2014 low). Another resistance can be found at 1.2632.
In the longer term, EUR/USD is in a downtrend since May 2014. The break of the strong support area between 1.2755 (09/07/2013 low) and 1.2662 (13/11/2012 low) has opened the way for a decline towards the strong support at 1.2043 (24/07/2012 low). A key resistance stands at 1.2886 (15/10/2014 high).
Await fresh signal.
GBP/USD
Consolidating.
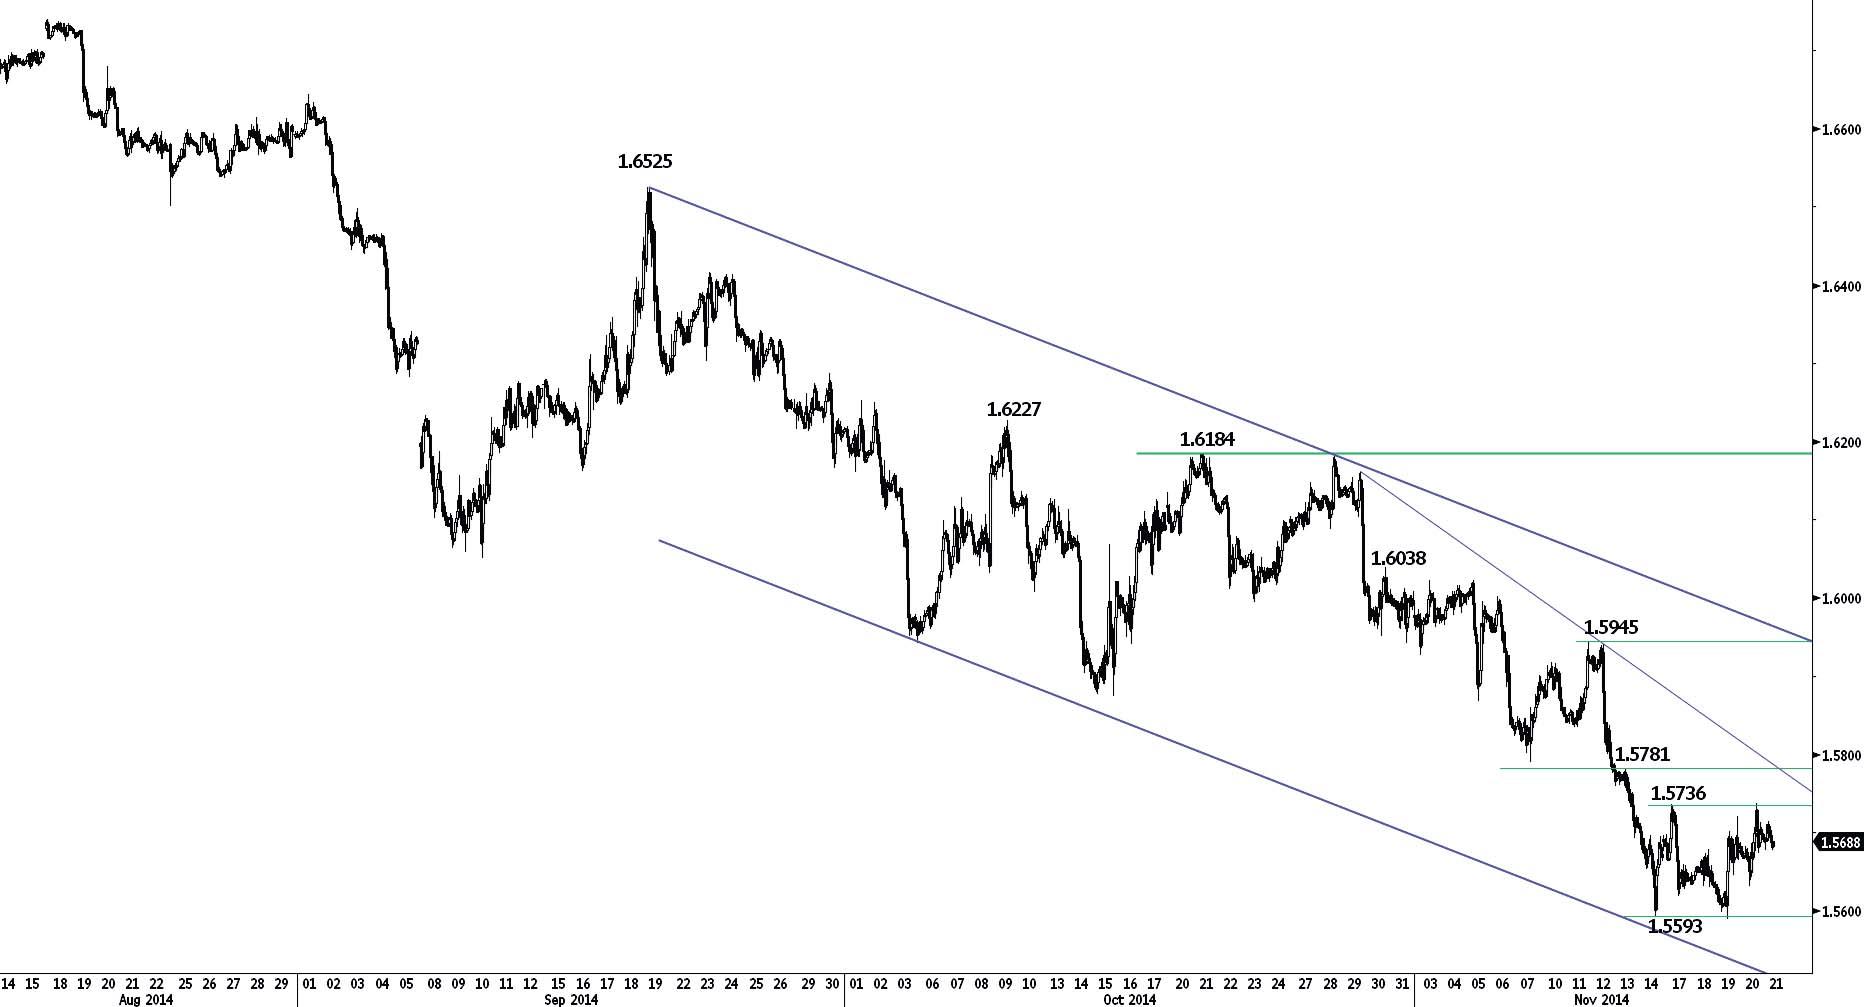
GBP/USD is consolidating within its horizontal range between the support at 1.5593 and the resistance at 1.5736. Another resistance can be found at 1.5781 (see also the declining trendline).
In the longer term, the break of the support at 1.5855 (12/11/2013 low) confirms an underlying bearish trend. A conservative downside risk is given by a test of the support at 1.5423 (14/08/2013 low). Another support can be found at 1.5102 (02/08/2013 low). A key resistance lies at 1.5945 (11/11/2014 high, see also the declining channel).
Await fresh signal.
USD/JPY
Weakening short-term buying interest?
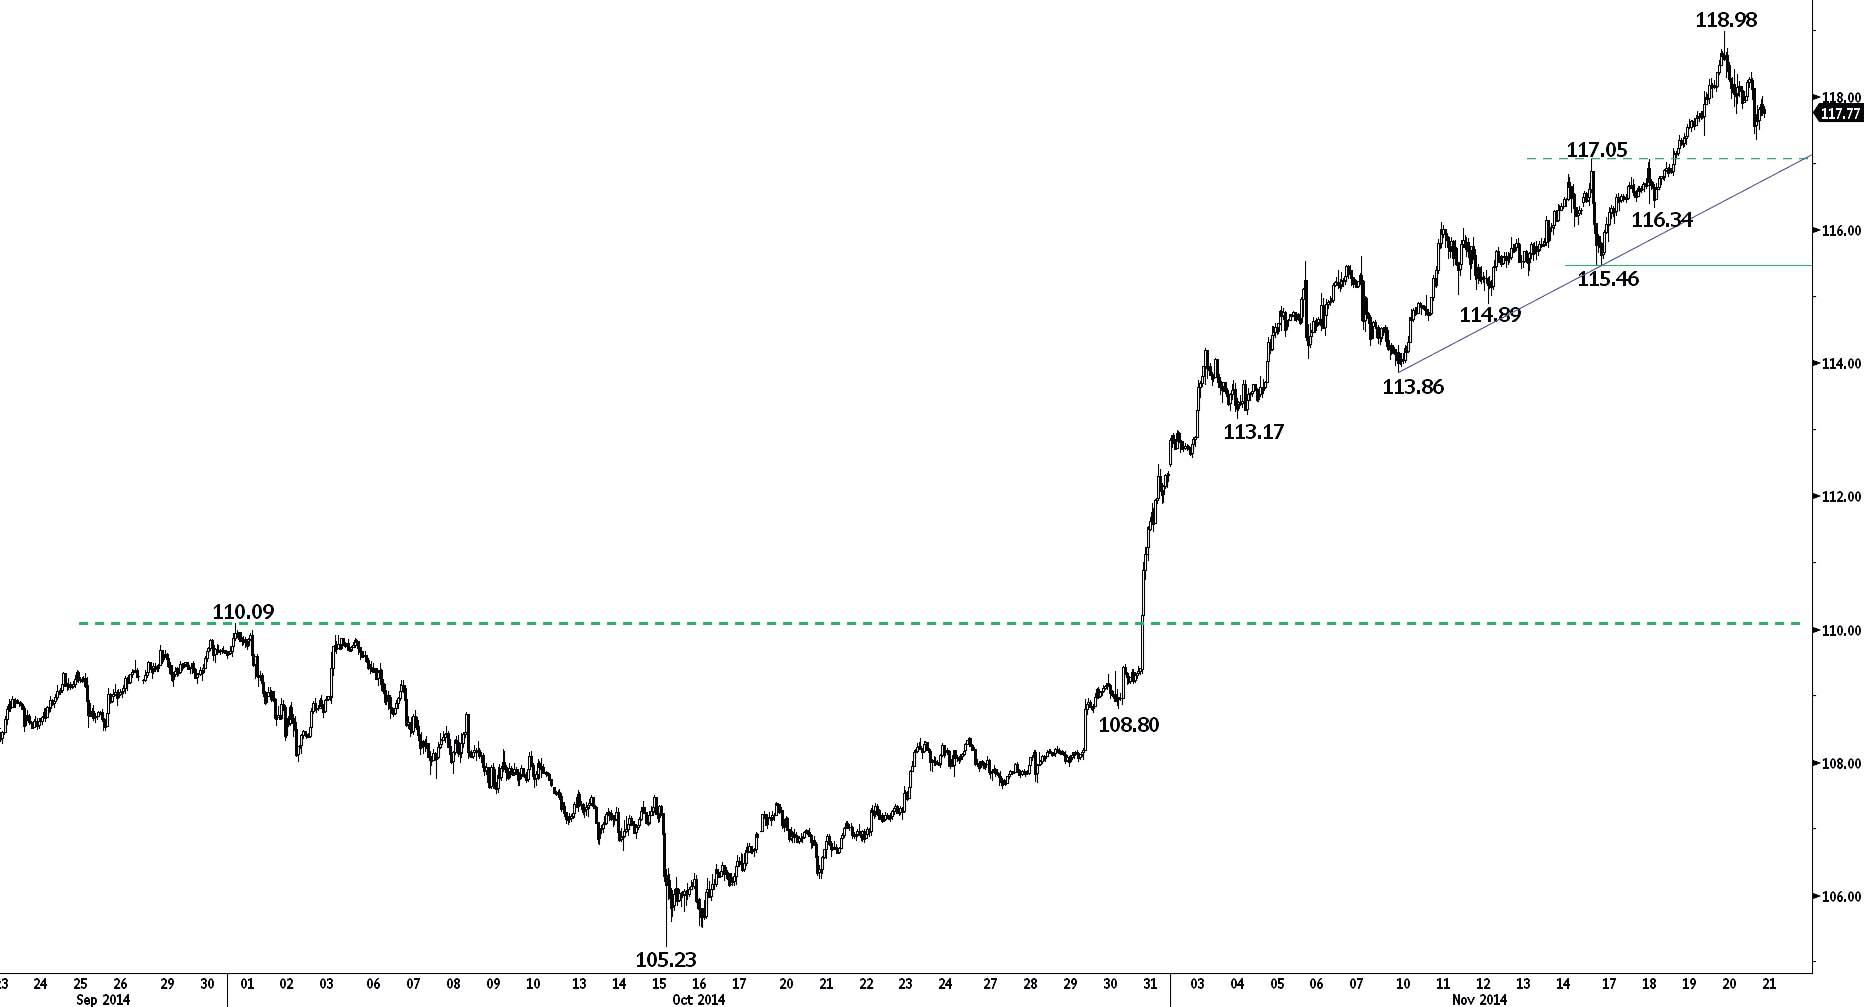
USD/JPY displayed a significant daily upper shadow yesterday, suggesting a weakening short-term buying interest. Hourly supports can be found at 117.05 (previous resistance) and 116.34 (18/11/2014 low).
A long-term bullish bias is favoured as long as the key support 105.23 (15/10/2014 high) holds. The break of the major resistance at 110.66 (15/08/2008 high) opens the way for a further rise towards 120.00 (psychological threshold, see also the 61.8% retracement of the 1998-2011 decline). A major resistance stands at 124.14 (22/06/2007 high).
Await fresh signal.
USD/CHF
Remains in a short-term succession of lower highs.
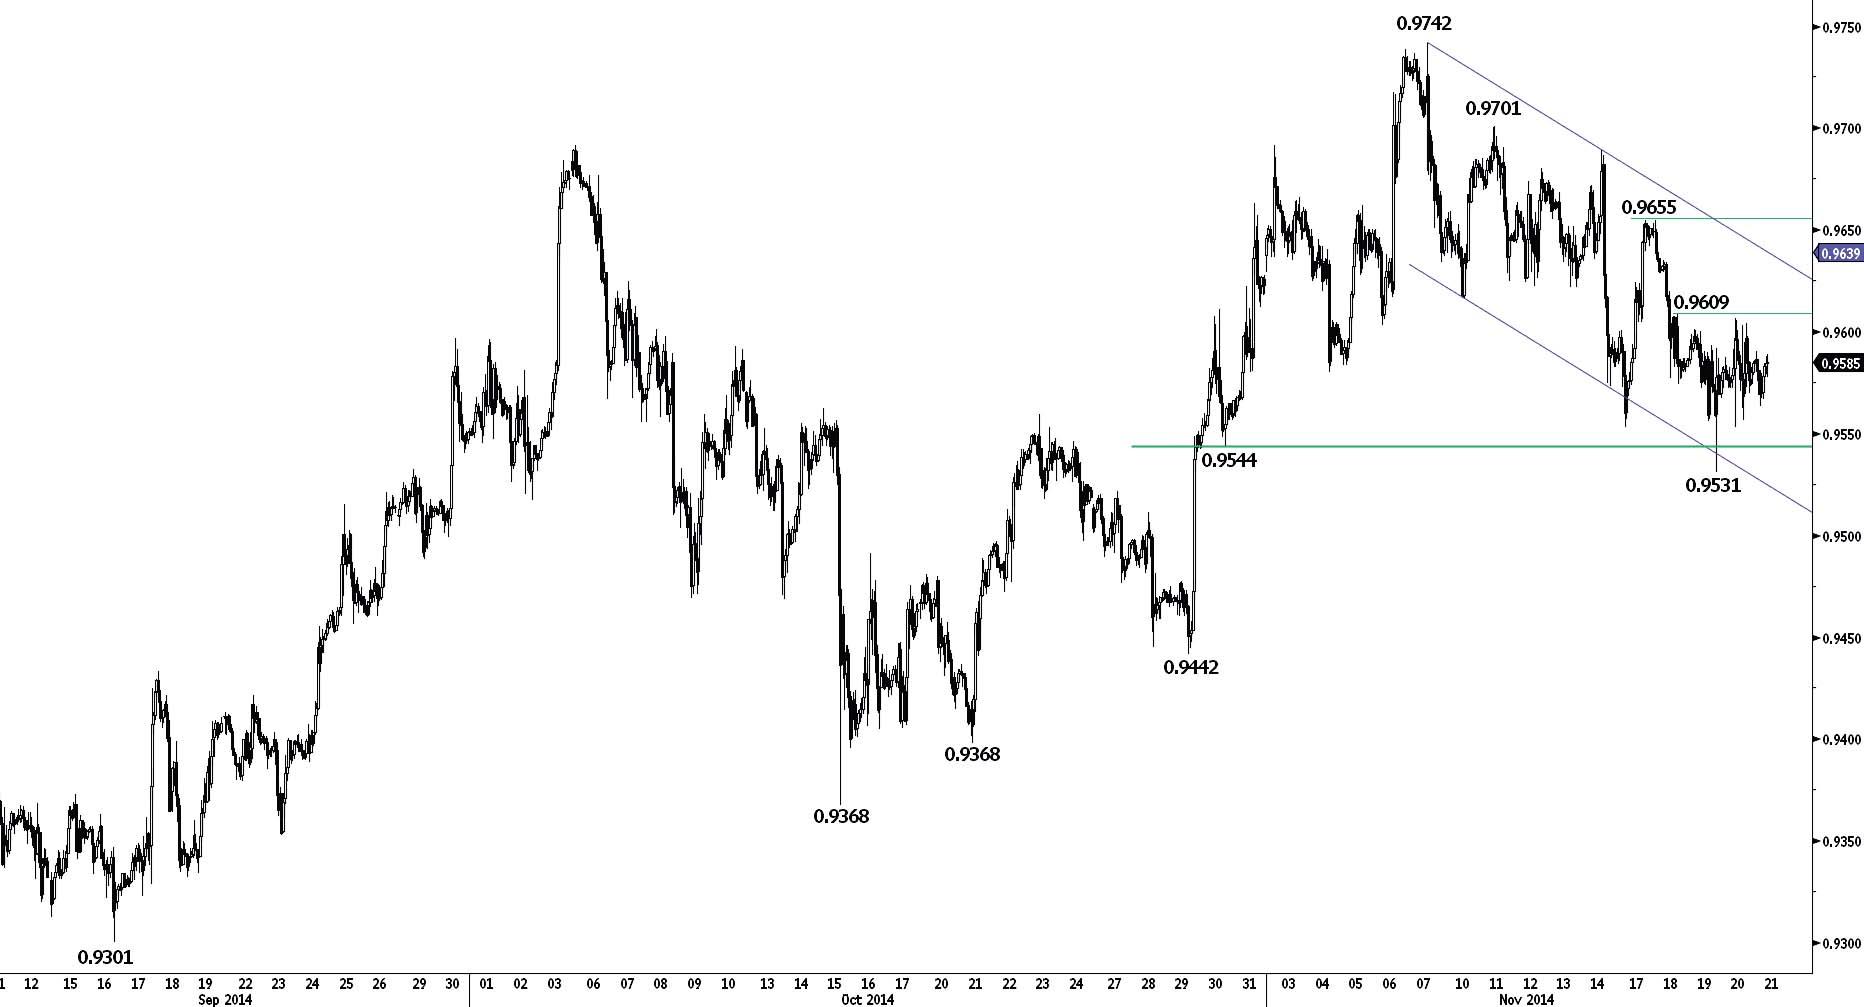
USD/CHF continues to consolidate near the key support at 0.9544. However, prices need to break their declining channel to improve the short-term term technical structure. Resistance can be found at 0.9655 and 0.9701. Another support lies at 0.9442.
From a longer term perspective, the technical structure favours a full retracement of the large corrective phase that started in July 2012. The recent new highs above the key resistance at 0.9691 confirm this outlook. A strong support stands at 0.9368 (15/10/2014 low). A key resistance can be found at 0.9839 (22/05/2013 high).
Long 2 units at 0.9559, Obj: Close unit 1 at 0.9680, remaining at 0.9790, Stop: 0.9521 (Entered: 2014-11-20).
USD/CAD
Remains in its declining channel.
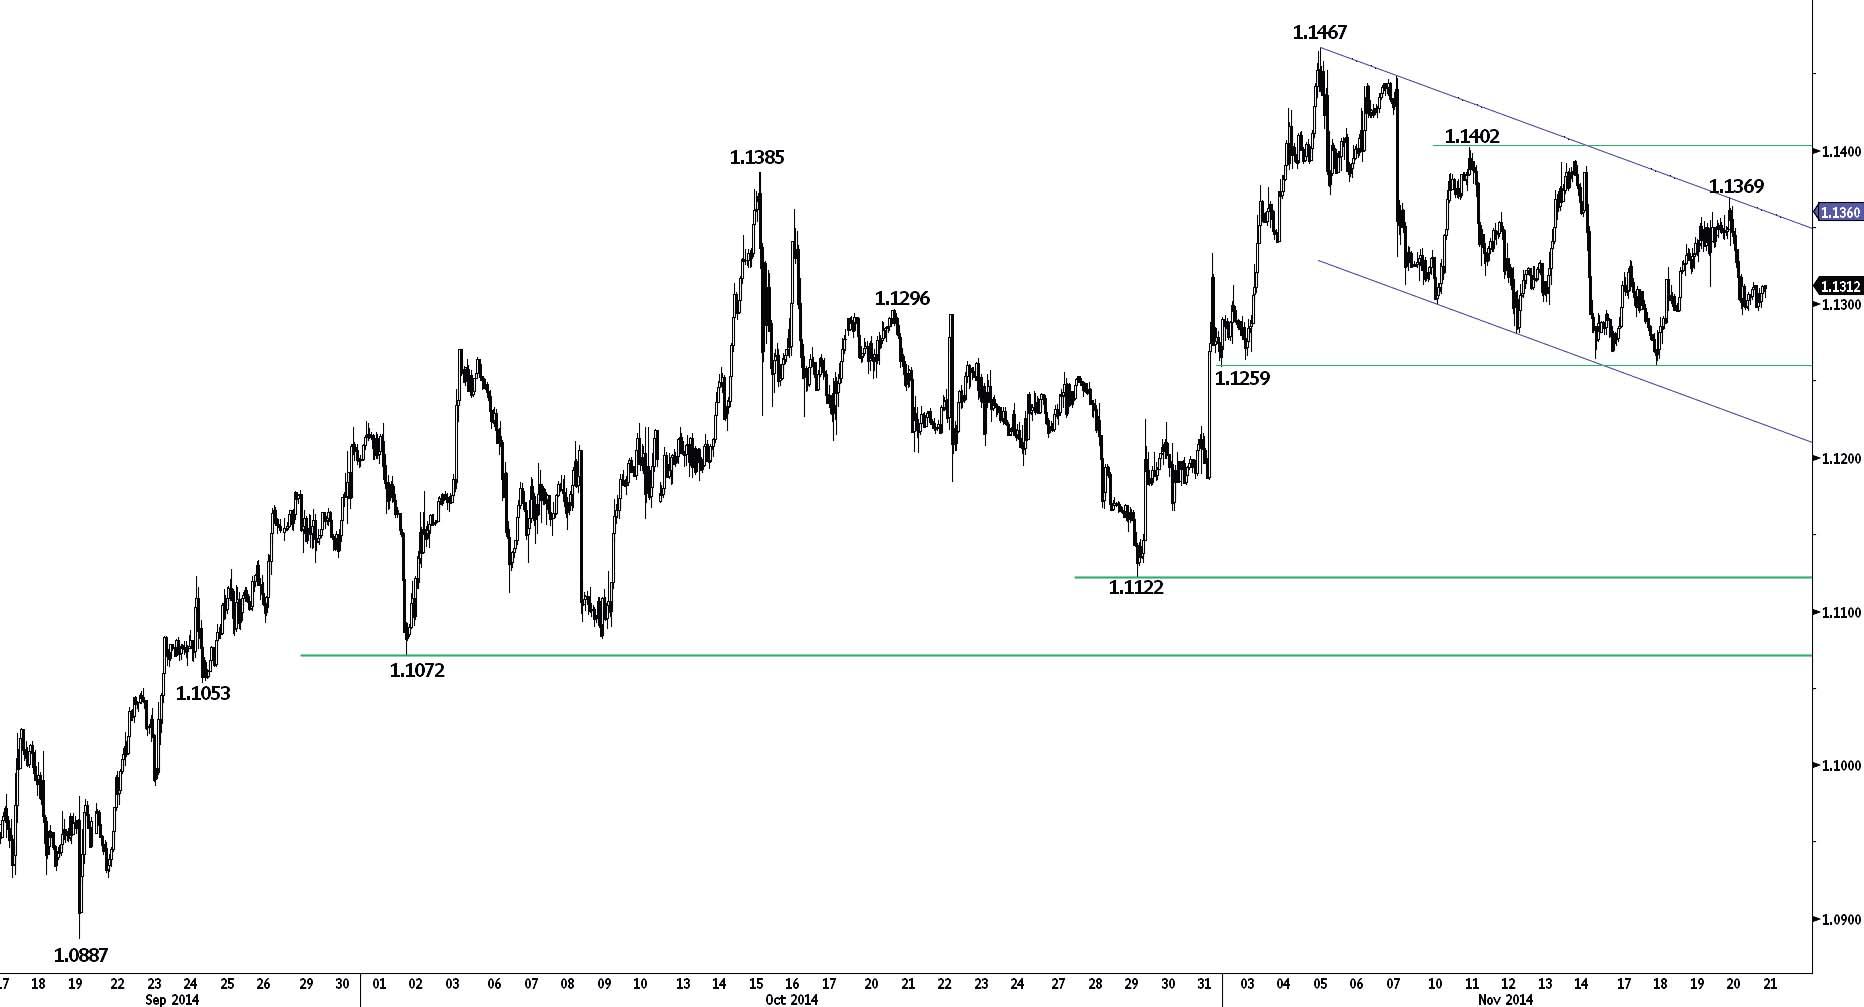
USD/CAD continues to move within its declining channel. An hourly support now lies at 1.1293 (20/11/2014 low), while a key support stands at 1.1259. Resistances can be found at 1.1369 and 1.1402.
In the longer term, the technical structure looks like a rounding bottom whose minimum upside potential is at 1.1725. The recent move above the resistance at 1.1279 (20/03/2014 high) confirms this bullish outlook. A strong support stands at 1.1072 (02/10/2014 low).
Await fresh signal.
AUD/USD
Bouncing.
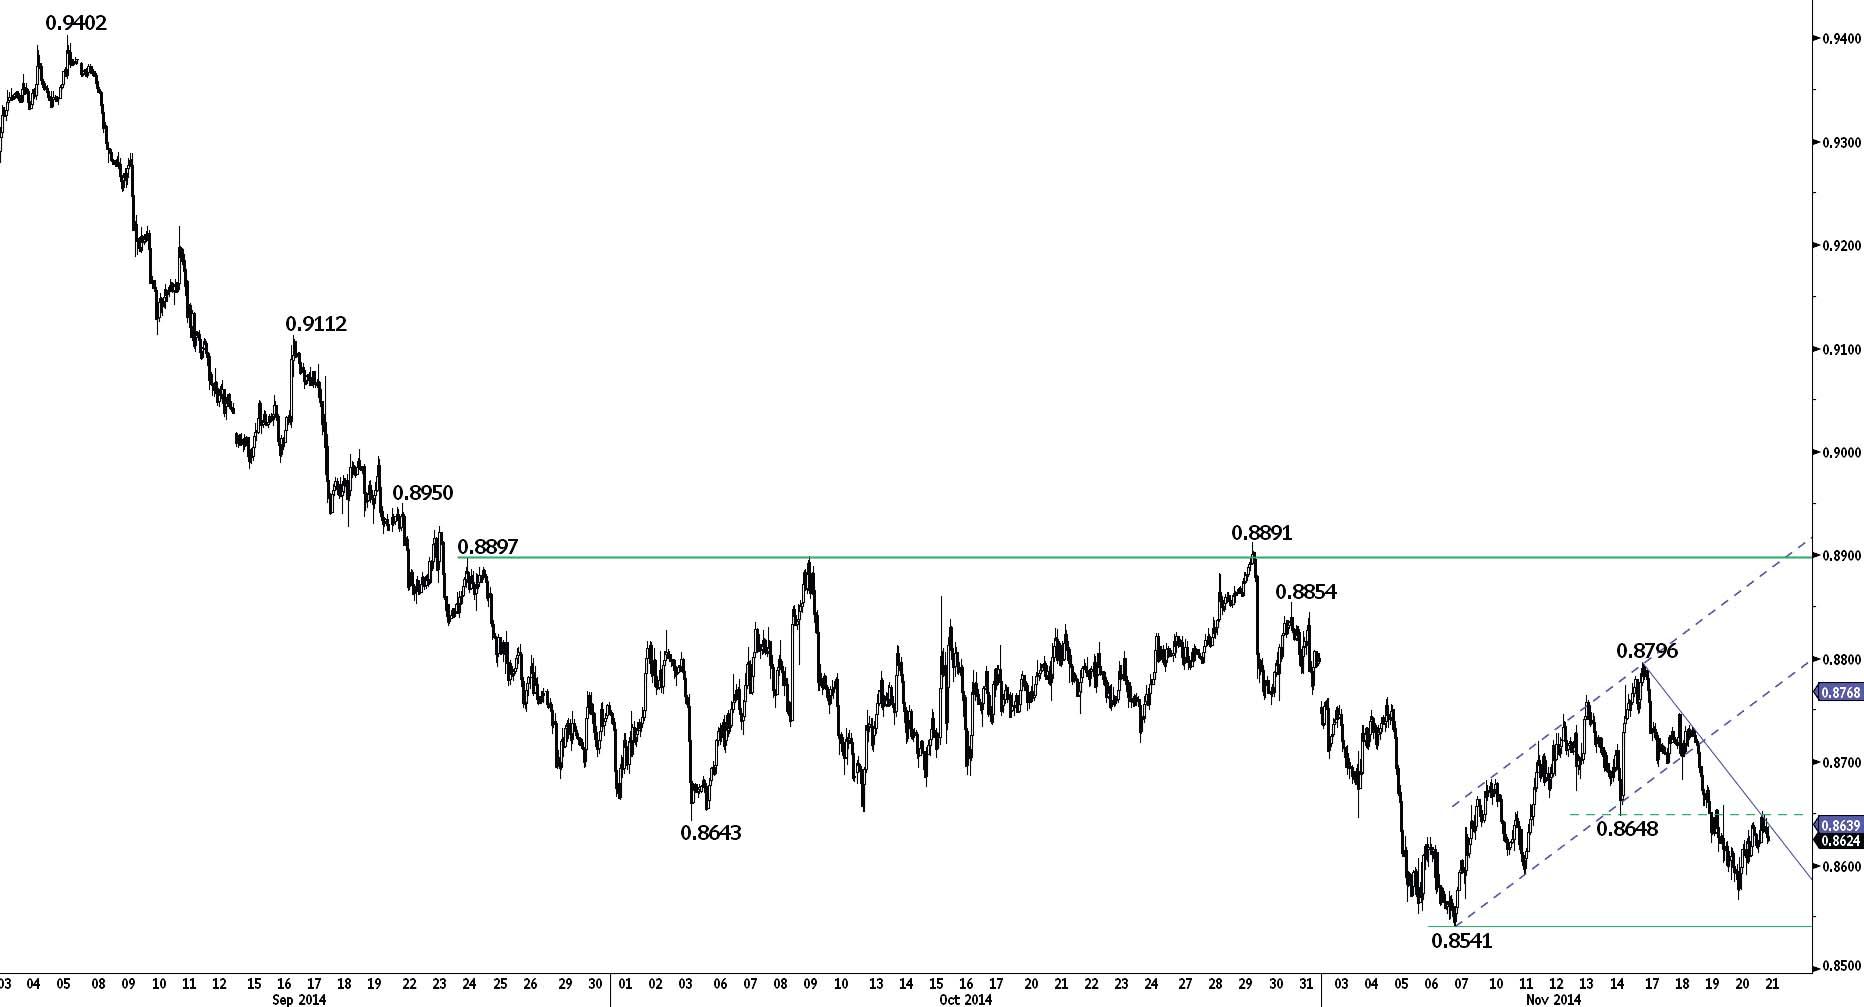
AUD/USD made a large daily lower shadow yesterday, suggesting a short-term pickup in buying interest near the support at 0.8541. An hourly resistance can be found at 0.8657 (intraday high, see also the declining trendline). Another resistance stands at 0.8747 (18/11/2014 high).
In the long-term, the break of the strong support at 0.8660 (24/01/2014 low) confirms the underlying long-term bearish trend and opens the way for further weakness. Supports can be found at 0.8316 (01/07/2010 low) and 0.8067 (25/05/2010 low). A key resistance stands at 0.8911 (29/10/2014 high).
Await fresh signal.
GBP/JPY
Short-term pullback?
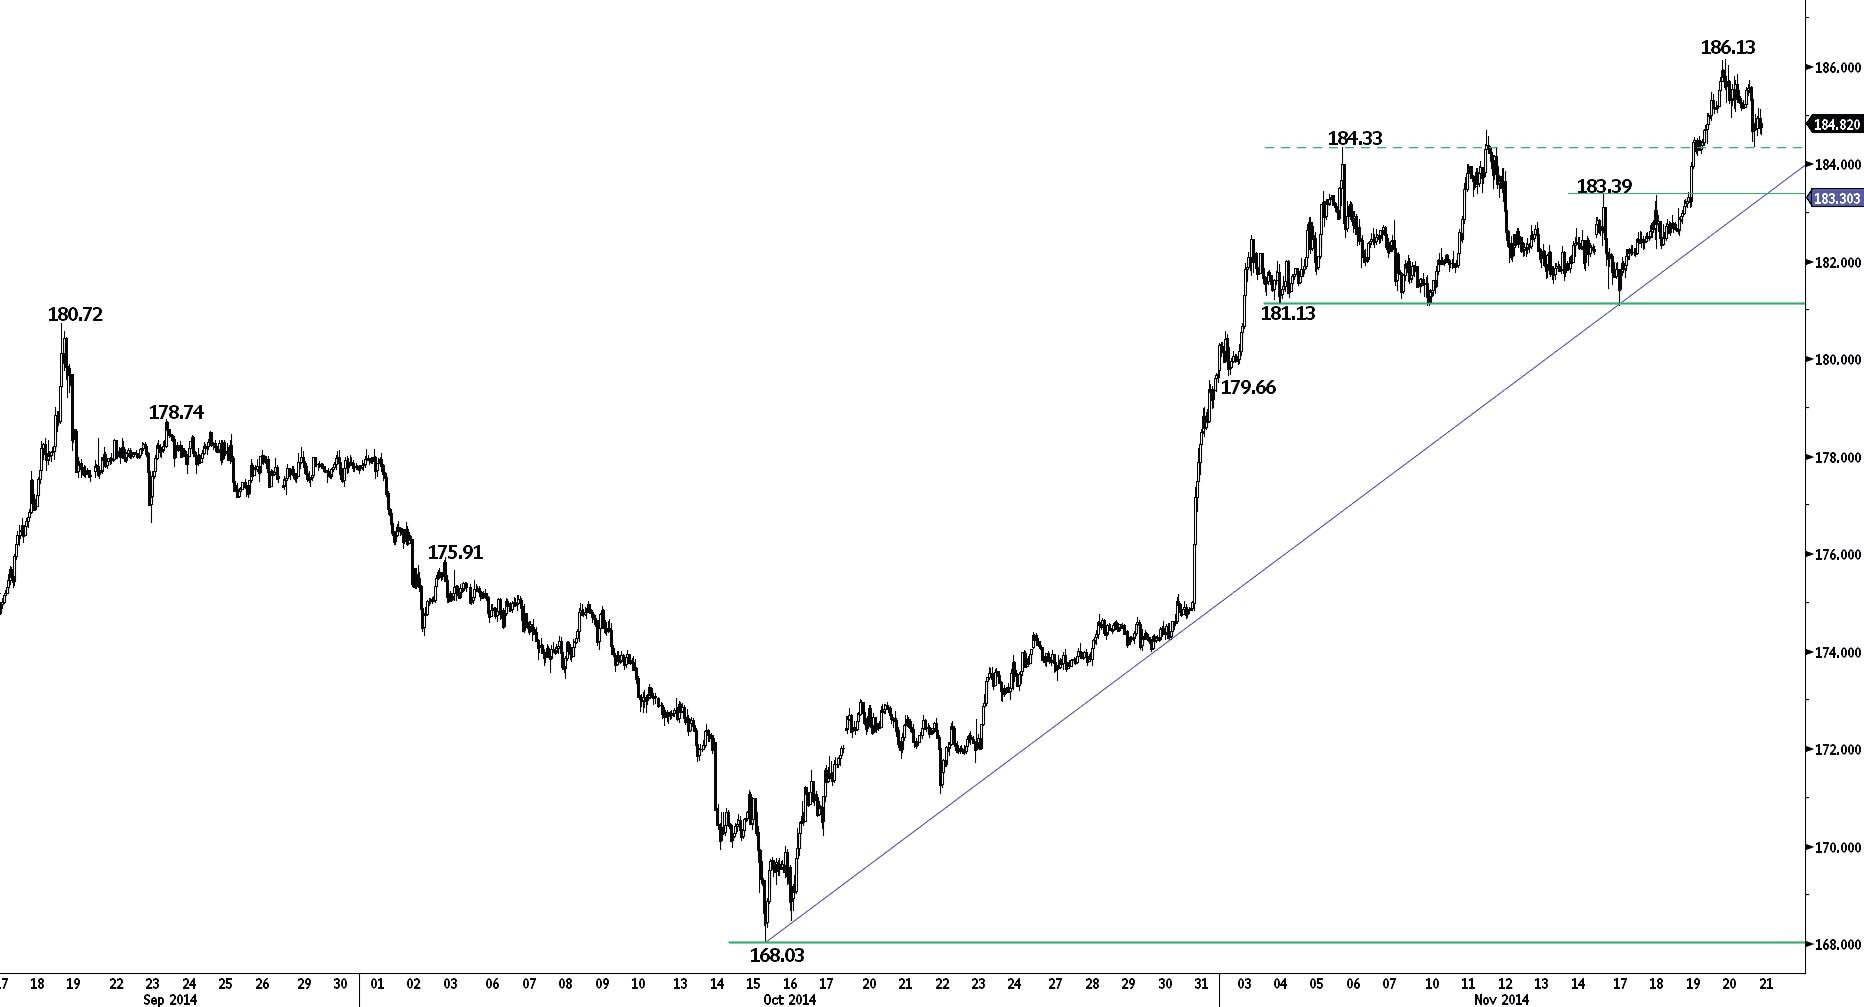
GBP/JPY has broken to the upside out of its recent consolidation. The implied short-term upside potential is given by 187.57. The shortterm technical momentum is positive as long as the hourly support at 184.16 (intraday low) holds. Another support stands at 183.39 (17/11/2014 high). An hourly resistance now lies at 186.13.
In the long-term, the trend is positive as long as the strong support area between 169.51 (11/04/2014 low) and 167.78 (18/03/2014 low) holds. The break of the strong resistance at 180.72 (19/09/2014 high) opens the way for further strength. A key resistance stands at 197.45 (24/09/2008 high).
Await fresh signal.
EUR/JPY
Yesterday's shooting star calls for caution.
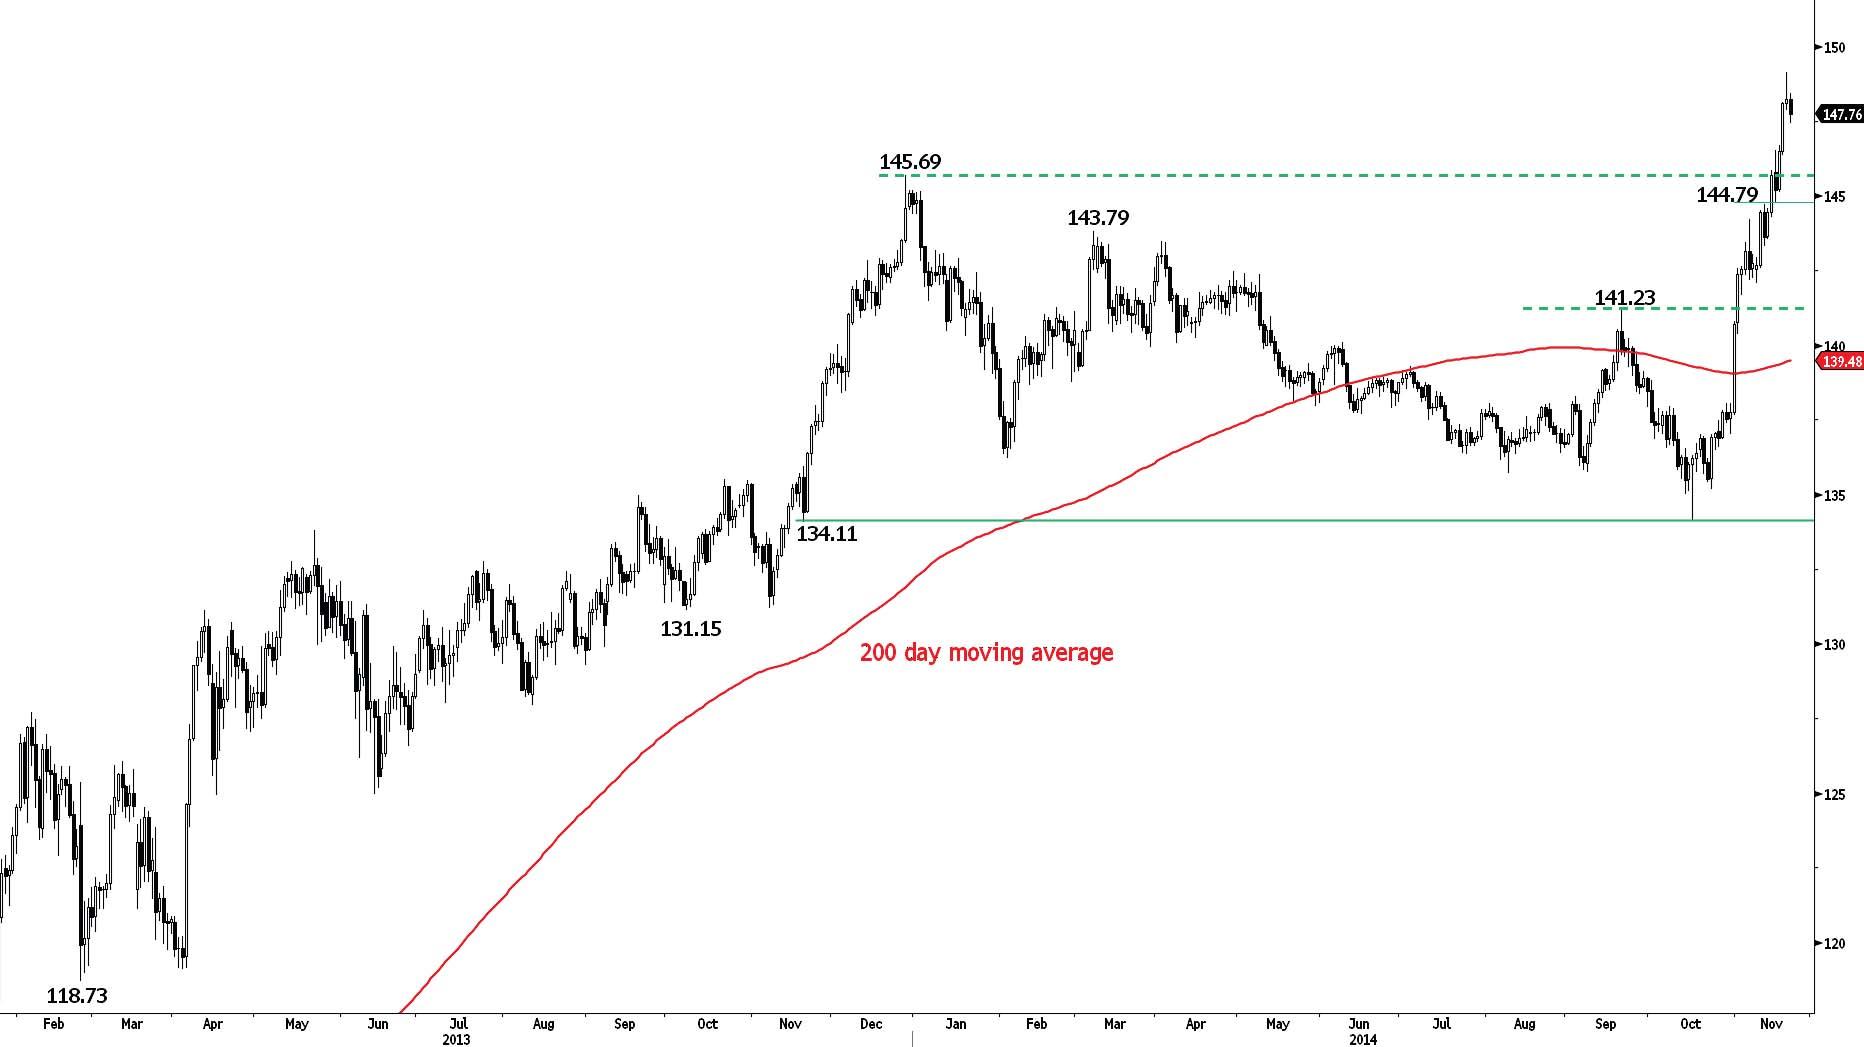
EUR/JPY made a daily shooting star yesterday. Given the overextended rise, this 1-day reversal pattern favours a more cautious stance. A support area can be found between 146.37 (19/11/2014 low) and t 145.74 (intraday low). An hourly resistance now lies at 149.14 (20/11/2014 high).
The long-term technical structure remains positive as long as the key support at 134.11 (20/11/2013 low) holds. The break of the major resistance at 145.69 opens the way for a further rise towards the psychological resistance at 150.00. Another resistance stands at 157.00 (08/09/2008 high).
Await fresh signal.
EUR/GBP
Fading near the key resistance area.
EUR/GBP has thus far failed to break the key resistance area between 0.8047 (15/10/2014 high, see also the declining channel) and 0.8066 (see also the 200-day moving average). Hourly supports can be found at 0.7955 (17/11/2014 low) and 0.7935 (14/11/2014 low).
In the longer term, the major support area between 0.7755 (23/07/2012 low) and 0.7694 (20/10/2008 low) has held thus far. A decisive break of the resistance at 0.8034 (25/06/2014 high, see also the declining channel and the 200- day moving average) would confirm an improving technical structure.
Await fresh signal.
EUR/CHF
Grinding higher.
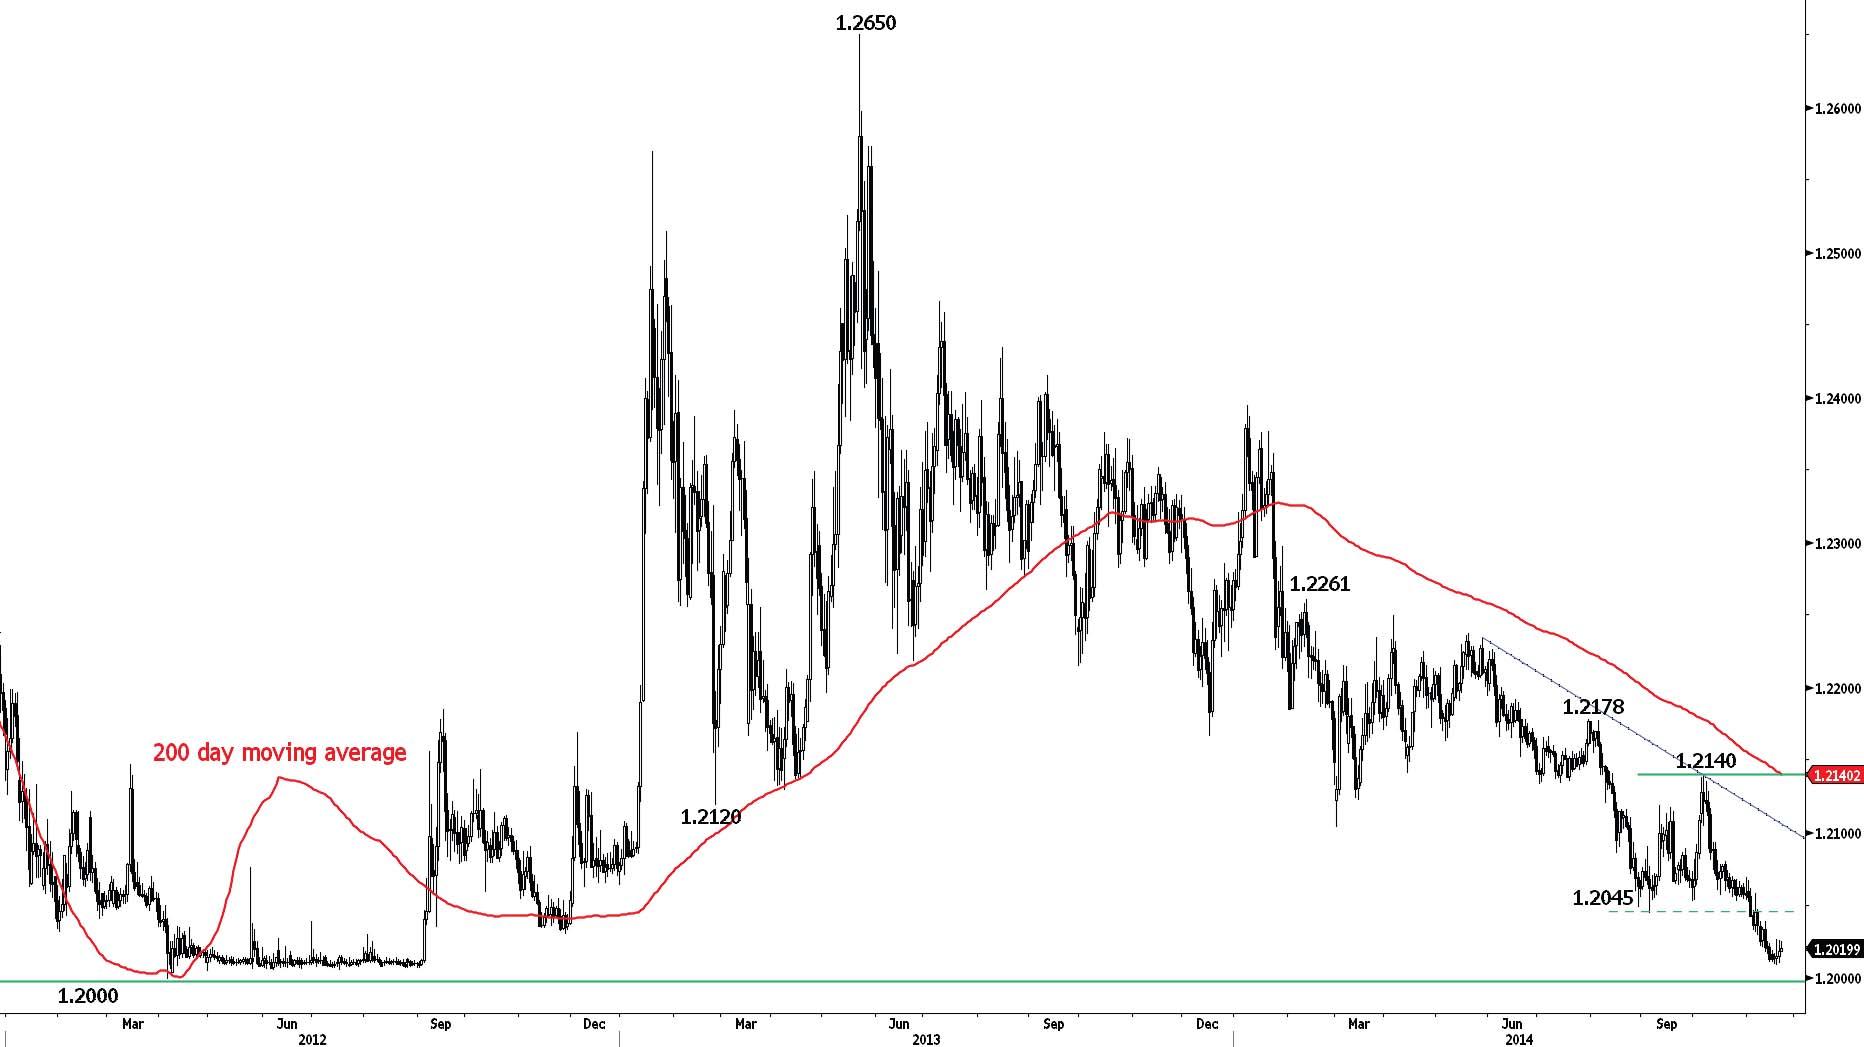
EUR/CHF is showing signs of buying pressures near the SNB's threshold at 1.20. Hourly resistances can be found at 1.2026 (19/11/2014 high) and 1.2039 (12/11/2014 high).
In September 2011, the SNB put a floor at 1.2000 in EUR/CHF, which will be enforced with the "utmost determination". For the time being, a break of this threshold is very unlikely.
Await fresh signal.
GOLD (in USD)
Consolidating.
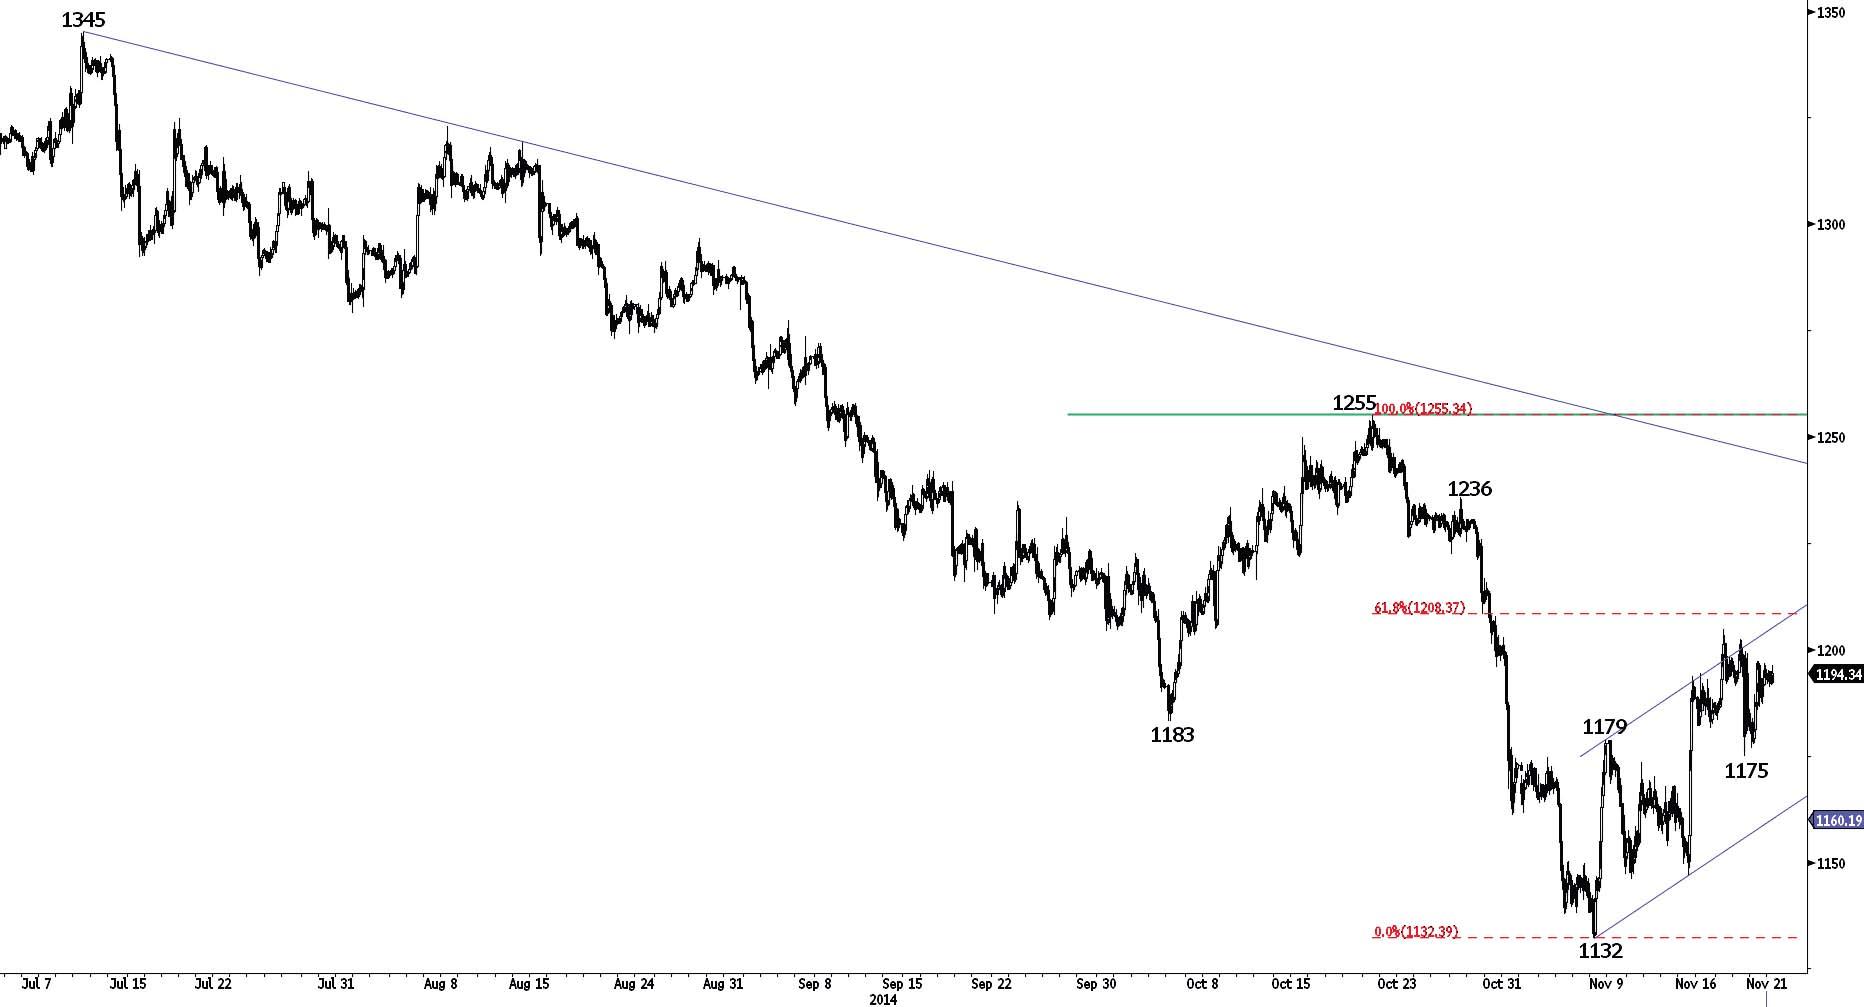
Gold is consolidating near the resistance at 1208 (61.8% retracement). Hourly supports are given by 1175 and by the low of the rising channel (around 1160). Another resistance stands at 1236.
In the long-term, the move below the strong support at 1181 (28/06/2013 low) confirms the underlying downtrend and opens the way for further declines towards the strong support at 1027 (28/10/2009 low). A strong resistance can be found at 1255 (21/10/2014 high).
Await fresh signal.
SILVER (in USD)
Moving sideways.
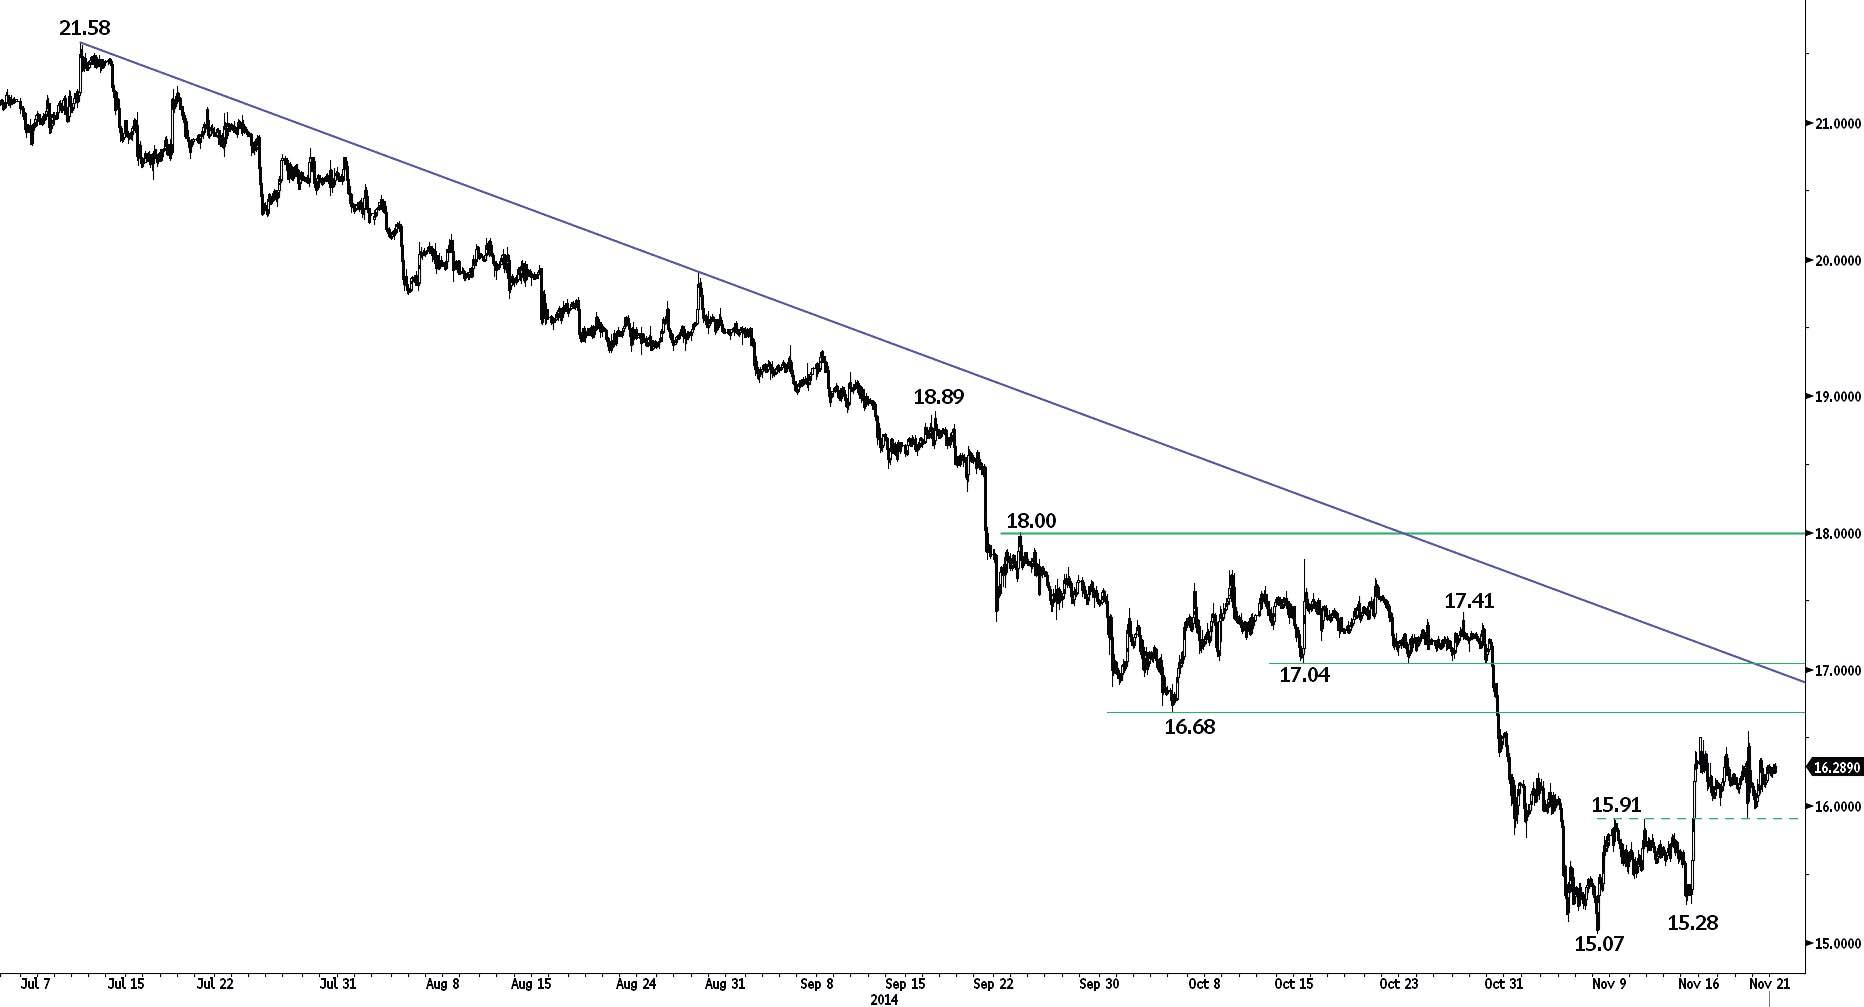
Silver is consolidating after the sharp rise made on 14 November. An hourly support stands at 15.91 (previous resistance), while another support lies at 15.28. Resistances can be found at 16.68 and 17.04.
In the long-term, the break of the major support area between 18.64 (30/05/2014 low) and 18.22 (28/06/2013 low) confirms an underlying downtrend. Although the strong support at 14.64 (05/02/2010 low) has held thus far, the lack of any base formation continues to favour a bearish bias. A resistance lies at 17.80 (15/10/2014 high). Another key support can be found at 11.77 (20/04/2009 low).
Await fresh signal.
This report has been prepared by Swissquote Bank Ltd and is solely been published for informational purposes and is not to be construed as a solicitation or an offer to buy or sell any currency or any other financial instrument. Views expressed in this report may be subject to change without prior notice and may differ or be contrary to opinions expressed by Swissquote Bank Ltd personnel at any given time. Swissquote Bank Ltd is under no obligation to update or keep current the information herein, the report should not be regarded by recipients as a substitute for the exercise of their own judgment.
Recommended Content
Editors’ Picks
EUR/USD holds below 1.0750 ahead of key US data

EUR/USD trades in a tight range below 1.0750 in the European session on Friday. The US Dollar struggles to gather strength ahead of key PCE Price Index data, the Fed's preferred gauge of inflation, and helps the pair hold its ground.
USD/JPY stays firm above 156.00 after BoJ Governor Ueda's comments

USD/JPY stays firm above 156.00 after surging above this level on the Bank of Japan's decision to leave the policy settings unchanged. BoJ Governor said weak Yen was not impacting prices but added that they will watch FX developments closely.
Gold price oscillates in a range as the focus remains glued to the US PCE Price Index

Gold price struggles to attract any meaningful buyers amid the emergence of fresh USD buying. Bets that the Fed will keep rates higher for longer amid sticky inflation help revive the USD demand.
Bitcoin Weekly Forecast: BTC’s next breakout could propel it to $80,000 Premium

Bitcoin’s recent price consolidation could be nearing its end as technical indicators and on-chain metrics suggest a potential upward breakout. However, this move would not be straightforward and could punish impatient investors.
US core PCE inflation set to signal firm price pressures as markets delay Federal Reserve rate cut bets

The core PCE Price Index, which excludes volatile food and energy prices, is seen as the more influential measure of inflation in terms of Fed positioning. The index is forecast to rise 0.3% on a monthly basis in March, matching February’s increase.
