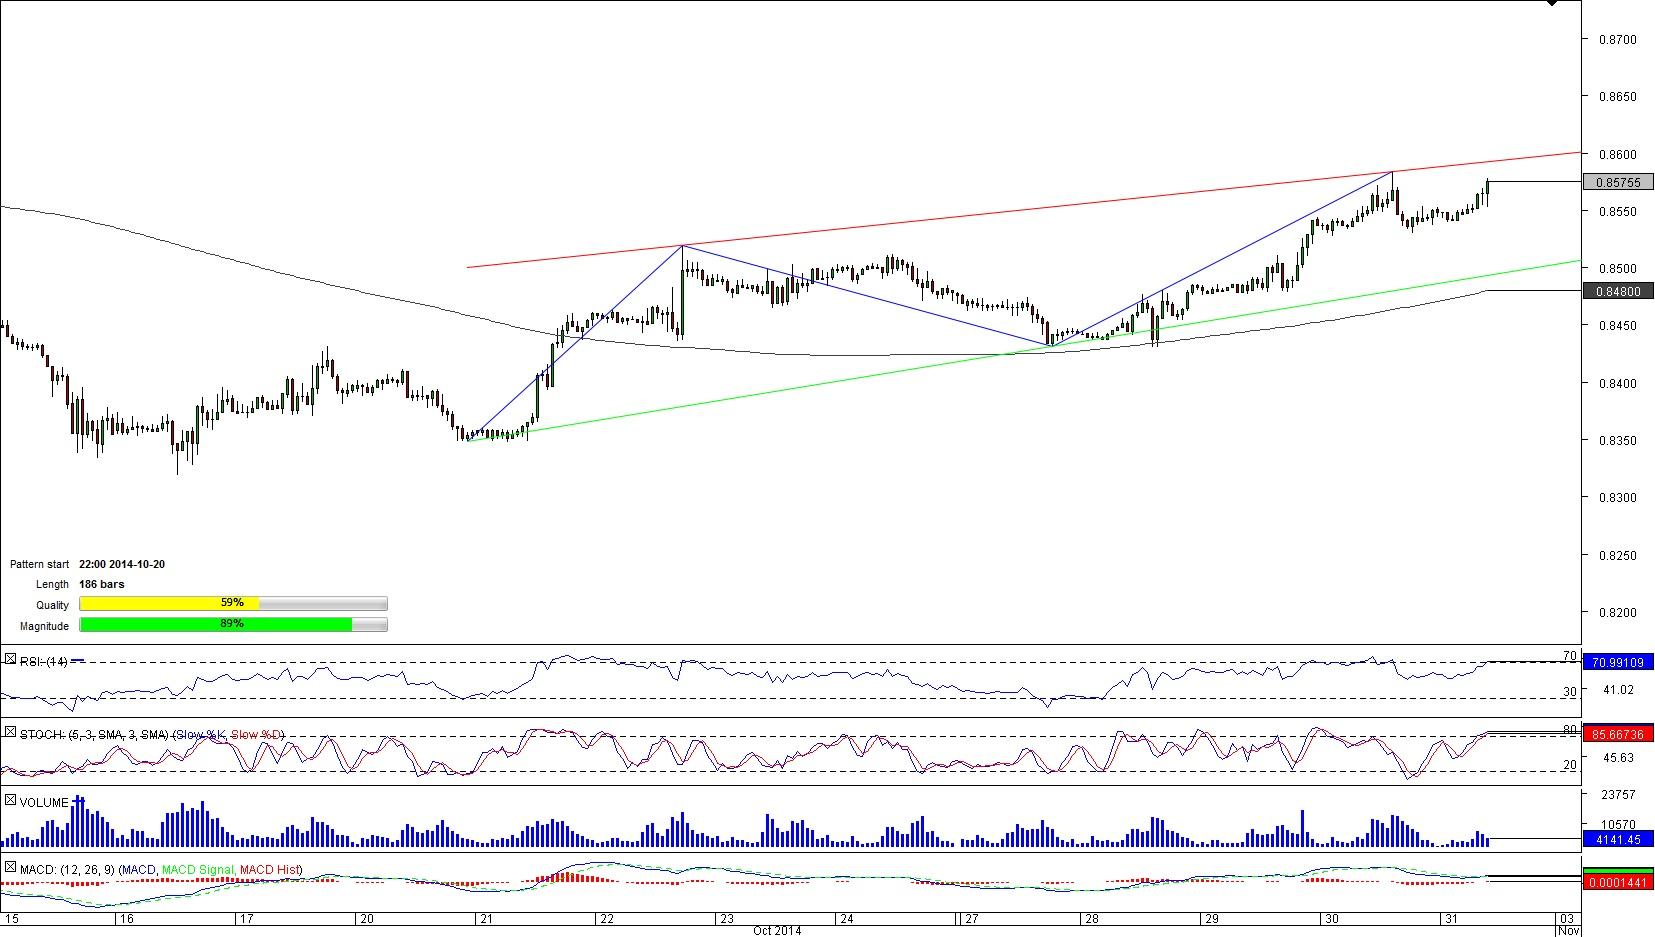
CAD/CHF 1H Chart: Rising Wedge
Comment: After hitting the lowest level since August on 16th of October at 0.8319, CAD/CHF started reversing the recent losses. At the same time the pair was able to form a rising wedge pattern.
The pair is reaching for the highest levels this year that were set at early October, when the Loonie approached 0.8639. The shorter term technical studies, namely 1H and 4H, are strongly bullish. Moreover, also the majority (75%) of the SWFX traders’ are bullish on CAD/CHF. There are certainly more bullish signals for the time being; therefore, with the pair being near the upper trend-line we see a potential for bullish break-out, this year’s high could be the target.
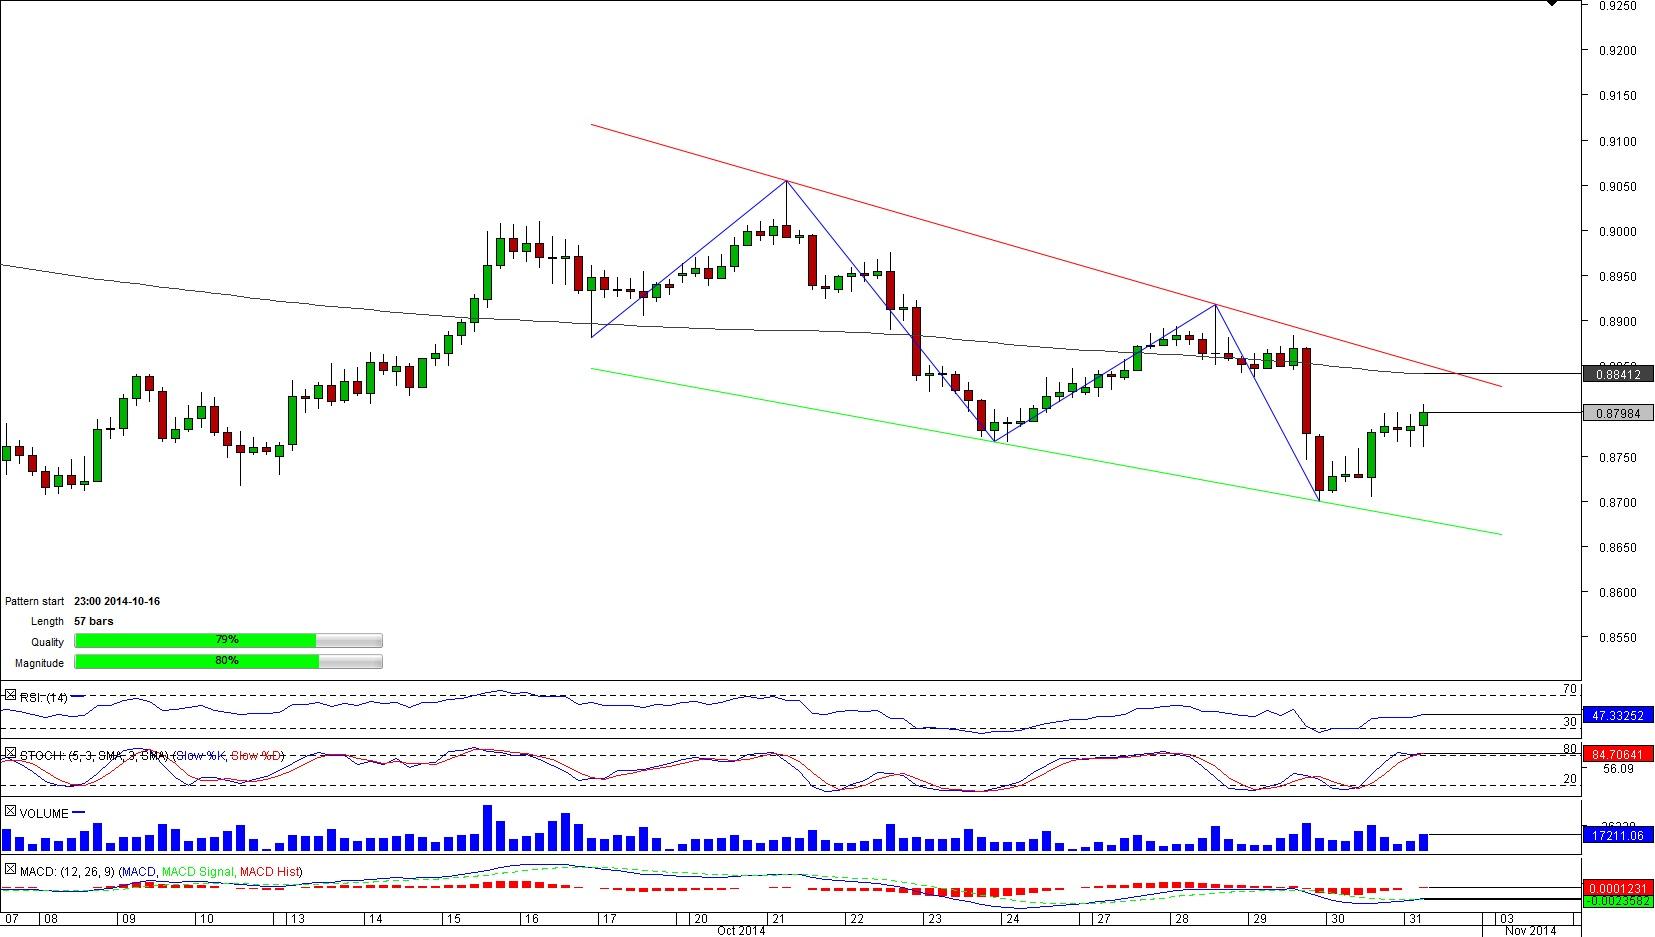
NZD/CAD 4H Chart: Falling Wedge
Comment: Even though the pattern (Falling Wedge) is rather short being 57-bars long, it offers a great quality and magnitude. The pattern started to form, after a failure to consolidate above the psychological level at 0.90.
Clearly, the NZD/CAD cross is still on a bearish bias; however, we already saw a correction in early October, with the pair testing the 0.90 level. The 4H and weekly technical indicators point downwards, proclaiming that there still is high probability of the downtrend to continue. Furthermore, we expect the Kiwi to approach the 100 and 200-period SMAs around 0.8850 mark, before trailing lower. For now this year’s low at 0.8617 remains the target level.
This overview can be used only for informational purposes. Dukascopy SA is not responsible for any losses arising from any investment based on any recommendation, forecast or other information herein contained.
Recommended Content
Editors’ Picks
EUR/USD trades with negative bias, holds above 1.0700 as traders await US PCE Price Index

EUR/USD edges lower during the Asian session on Friday and moves away from a two-week high, around the 1.0740 area touched the previous day. Spot prices trade around the 1.0725-1.0720 region and remain at the mercy of the US Dollar price dynamics ahead of the crucial US data.
USD/JPY jumps above 156.00 on BoJ's steady policy

USD/JPY has come under intense buying pressure, surging past 156.00 after the Bank of Japan kept the key rate unchanged but tweaked its policy statement. The BoJ maintained its fiscal year 2024 and 2025 core inflation forecasts, disappointing the Japanese Yen buyers.
Gold price flatlines as traders look to US PCE Price Index for some meaningful impetus

Gold price lacks any firm intraday direction and is influenced by a combination of diverging forces. The weaker US GDP print and a rise in US inflation benefit the metal amid subdued USD demand. Hawkish Fed expectations cap the upside as traders await the release of the US PCE Price Index.
Sei Price Prediction: SEI is in the zone of interest after a 10% leap

Sei price has been in recovery mode for almost ten days now, following a fall of almost 65% beginning in mid-March. While the SEI bulls continue to show strength, the uptrend could prove premature as massive bearish sentiment hovers above the altcoin’s price.
US economy: Slower growth with stronger inflation

The US Dollar strengthened, and stocks fell after statistical data from the US. The focus was on the preliminary estimate of GDP for the first quarter. Annualised quarterly growth came in at just 1.6%, down from the 2.5% and 3.4% previously forecast.

