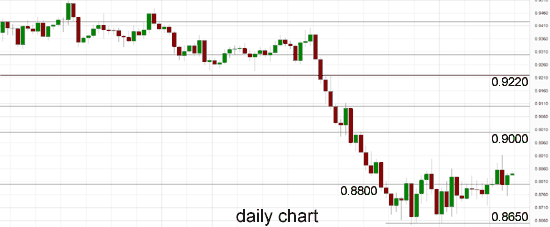
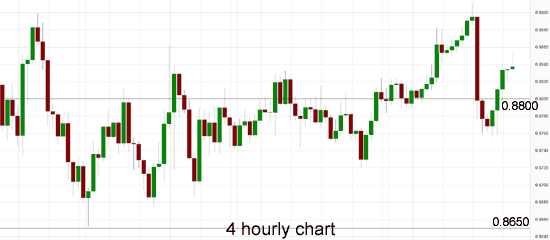
In the last 24 hours or so the Australian dollar has rallied again back up through the resistance level at 0.88 after only recently falling sharply back down through that level in the day prior. It had only just reached a two week high just above 0.89 before the sharp fall. During the last month the Australian dollar has done well to stop the bleeding and trade within a wide range roughly between 0.8650 and 0.88. Prior to that it had experienced a sharp decline throughout September which saw it move from close to 0.94 down to below 0.8650 and an eight month low in the process. The resistance level at 0.88 remains a factor and is continuing to place downwards pressure on price, however more recently all eyes have turned on to the support level at 0.8650 to see if the Australian dollar can remain above it. Several weeks ago the Australian dollar found some much needed support at 0.8950 and rallied back up to just shy of the key 0.90 level before resuming its decline. The long term key level at 0.90 was called upon to desperately provide some much needed support to the Australian dollar, which it did a little a few weeks ago, however it has more recently provided resistance.
Back at the beginning of September the Australian dollar showed some positive signs as it surged higher again bouncing off support below 0.93 and reaching a new four week high around 0.94 however that all now seems a distant memory. The Australian dollar reached a three week high just shy of 0.9480 at the end of July after it enjoyed a solid period which saw it surge higher through the resistance level at 0.9425 to the three week around 0.9480, before easing back towards that level. The Australian dollar enjoyed a solid surge higher reaching a new eight month high above 0.95 at the end of June, only to return most of its gains in very quick time to finish out that week. Since the middle of June the Australian dollar has made repeated attempts to break through the resistance level around 0.9425, however despite its best efforts it was rejected every time as the key level continued to stand tall, even though it has allowed the small excursion to above 0.95.
After the Australian dollar had enjoyed a solid surge in the first couple of weeks of June which returned it to the resistance level around 0.9425, it then fell sharply away from this level back to a one week low around 0.9330 before rallying higher yet again. Its recent surge higher to the resistance level around 0.9425 was after spending a couple of weeks at the end of May trading near and finding support at 0.9220. Throughout April and into May the Australian dollar drifted lower from resistance just below 0.95 after reaching a six month high in that area and down to the recent key level at 0.93 before falling lower. During this similar period the 0.93 level has become very significant as it has provided stiff resistance for some time. The Australian dollar appeared to be well settled around 0.93 which has illustrated the strong resurgence it has experienced throughout this year.
Australia’s terms of trade slide continued in the September quarter. The terms of trade is a measure of Australia’s luck. It’s the ratio of export prices to import prices, so it’s a gauge of whether Australia is having to sell more tonnes of coal or bales of wool in order to buy a given quantity of plasma televisions, cars, dresses or smart phones. And, it turns out, it is. The import price index fell by 0.8 per cent in the September quarter, according to figures from the Australian Bureau of Statistics on Thursday. But the export price index dropped by 3.9 per cent, continuing the pattern seen since mid-2011. Since then, the price of exported goods has fallen by 23 per cent relative to import prices. Or, to put it another way, for every tonne, bale, ounce or bushel of stuff Australia had to export in order to buy a load of imports in 2011, it now has to export 1.3 tonnes, bales, ounces or bushels to pay for the same bundle of imports. The national accounts, the source of estimates of gross domestic product (GDP), have a broader measure of the terms of trade – it includes trade in services like travel and tourism. It’s very likely to show a similar result for the September quarter.
(Daily chart / 4 hourly chart below)
AUD/USD October 30 at 22:10 GMT 0.8836 H: 0.8853 L: 0.8831
AUD/USD Technical

During the early hours of the Asian trading session on Friday, the AUD/USD is trying to hold on to the resistance level at 0.88 after recently falling sharply back down through there. The Australian dollar was in a free-fall for a lot of last year falling close to 20 cents and it has done very well to recover slightly to near 0.95 again earlier this year. Current range: trading right around 0.8830.
Further levels in both directions:
- Below: 0.8650.
- Above: 0.8800, 0.9000, and 0.9100.
Recommended Content
Editors’ Picks
EUR/USD holds above 1.0700 ahead of key US data

EUR/USD trades in a tight range above 1.0700 in the early European session on Friday. The US Dollar struggles to gather strength ahead of key PCE Price Index data, the Fed's preferred gauge of inflation, and helps the pair hold its ground.
USD/JPY stays above 156.00 after BoJ Governor Ueda's comments

USD/JPY holds above 156.00 after surging above this level with the initial reaction to the Bank of Japan's decision to leave the policy settings unchanged. BoJ Governor said weak Yen was not impacting prices but added that they will watch FX developments closely.
Gold price oscillates in a range as the focus remains glued to the US PCE Price Index

Gold price struggles to attract any meaningful buyers amid the emergence of fresh USD buying. Bets that the Fed will keep rates higher for longer amid sticky inflation help revive the USD demand.
Sei Price Prediction: SEI is in the zone of interest after a 10% leap

Sei price has been in recovery mode for almost ten days now, following a fall of almost 65% beginning in mid-March. While the SEI bulls continue to show strength, the uptrend could prove premature as massive bearish sentiment hovers above the altcoin’s price.
US core PCE inflation set to signal firm price pressures as markets delay Federal Reserve rate cut bets

The core PCE Price Index, which excludes volatile food and energy prices, is seen as the more influential measure of inflation in terms of Fed positioning. The index is forecast to rise 0.3% on a monthly basis in March, matching February’s increase.

