![]() HY Markets Research Team
HY Markets Research Team
HY Markets
EUR/USD
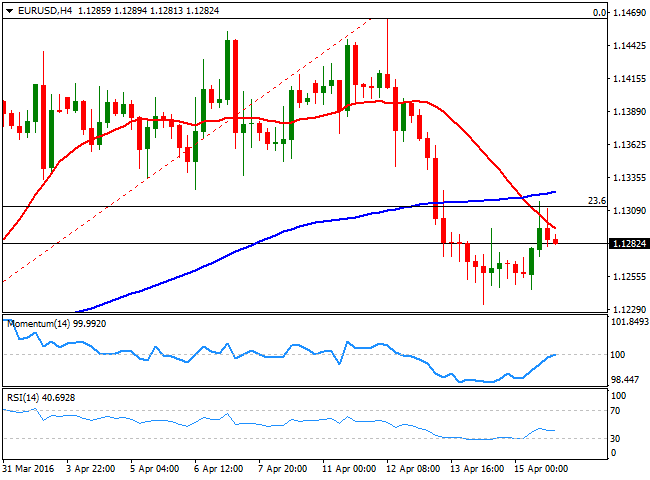
The EUR/USD pair corrected lower by the end of the last week, although the American dollar retains its long term negative tone against all of its major rivals. During this past week, commodity currencies were the biggest winners, fueled by improved market sentiment, as Chinese latest data was overall positive, with industrial production rising the most in almost a year. Industrial output rose 6.8% in March compared to a year earlier, while retail sales also beat market´s expectations, printing at 10.5%y/y in March versus 10.4% median forecast. Finally, China’s GDP for the first quarter printed at 6.7%y/y, matching forecast, but down from 6.8% in the December quarter.On Friday, poor US data put a halt to dollar's advance, as it happened several times over these last few days. US industrial production fell 0.6% in March, compared to February, whilst the University of Michigan index of consumer sentiment for April fell to 89.7 compared to an expected 91.9. The EUR/USD par closed the week at 1.1282 after failing to surpass a major static resistance level, the 1.4160 region, tested at the beginning of the week. On Friday, the price was contained by 1.1315, the 23.6% retracement of the latest daily bullish run between 1.0821, March 3rd low, and the high posted at 1.1461 this April. The weekly decline stalled short from the 38.2% retracement of the same rally, at 1.1220, the level to break to confirm a steeper decline this week. In the meantime, the daily chart presents a limited bearish tone, as the price stands below a bullish 20 SMA whilst the technical indicators have crossed their midlines towards the downside, but lost bearish strength within neutral territory, indicating limited scope for additional declines. In the shorter term, the 4 hours chart maintains a negative tone, as the price remains capped by a bearish 20 SMA whilst the technical indicators have lost upward steam after bouncing from their midlines, and the RSI already turned south, increasing the risk of a new leg south.
Support levels: 1.1235 1.1200 1.1160
Resistance levels: 1.13001.1335 1.1380
GBP/USD
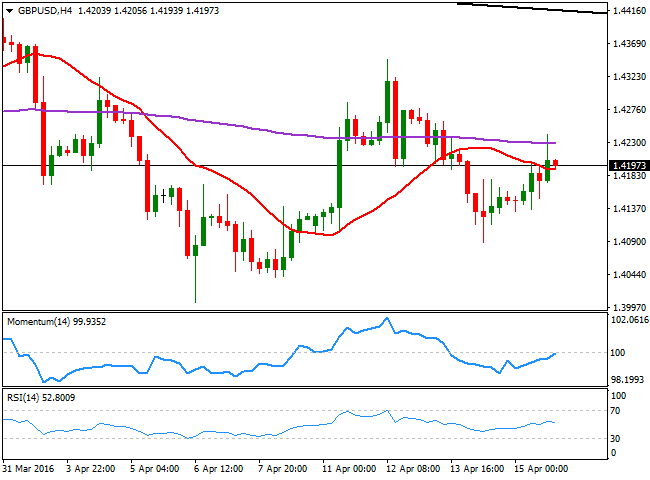
The GBP/USD pair has managed to end the week with some limited gains, but below the 1.4200 after faltering again to sustain gains beyond the 1.4300 figure. The Pound continues being weighed by uncertainty over a possible Brexit, and the underlying risks of leaving the EU. The referendum over a Brexit will take place by the ends of June, and as commented on previous updates, the Sterling will likely remain unattractive until then. In the meantime, the technical stance favors a continued decline, although limited, with buying interest aligned in the 1.4000/50 region. In the daily chart, the pair closed the week around a horizontal 20 SMA, whilst the technical indicators turned slightly higher within negative territory, rather favoring some consolidation than further declines. In the 4 hours chart, the price is around its 20 SMA, but below the 200 EMA, whilst the technical indicators advanced towards their midlines, but remain within negative territory, leaving little room for additional advances.
Support levels: 1.4160 1.4130 1.4090
Resistance levels: 1.4240 1.4285 1.4330
USD/JPY
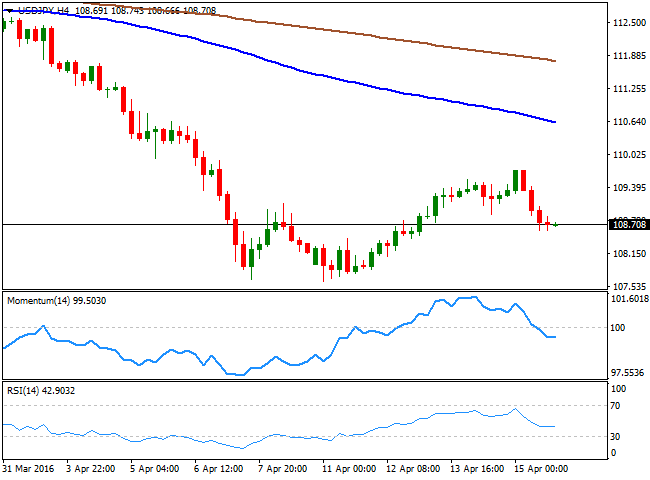
The USD/JPY pair bounced from the multi month low posted at 107.62, but the weekly recovery stalled below the 110.00 figure, and the pair resumed its decline by the end of the week as US data disappointed, with poor retail sales, industrial production, and sentiment indexes missing market's expectations and generally below previous months' readings. The upturn seen mid last week was enough to help the pair correcting extreme oversold readings reached in the daily chart, but have then resumed their declines deep into negative territory, and speculative interest will be now looking for a move below the mentioned 107.60 region, targeting first the 106.20 price zone, and 105.00 then, where the Bank of Japan established its latest line in the sand for Yen's strength. Shorter term, the pair retains the negative tone, with the technical indicators consolidating within bearish territory, and the price developing well below its moving averages.
Support levels: 108.40 107.95 107.60
Resistance levels: 109.20 109.50 110.00
GOLD
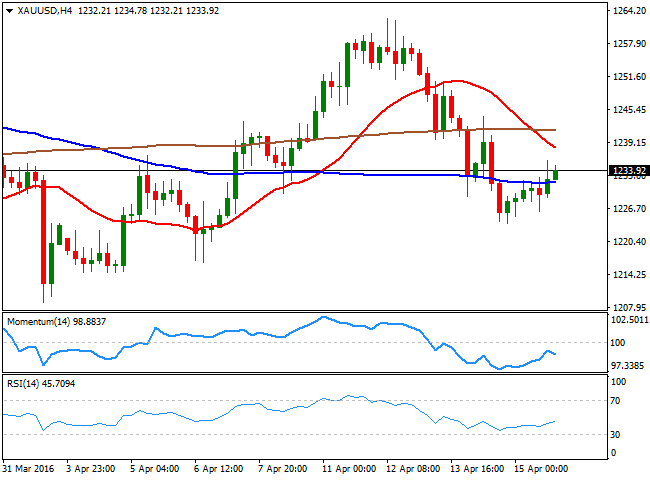
Spot gold rallied up to a fresh 3week high last week of $1,262.62 a troy ounce, but finally closed in the red around 1.234,00, roughly 1% lower. The commodity eased last week as market's sentiment improved following generally strong Chinese data, although the catalyst for the latest decline was a better than expected report on weekly unemployment claims last Thursday, as they dropped to their lowest in over 40 years, putting back in the table an US rate hike. The daily chart for spot shows that the price advanced above a mild bearish 20 SMA, whilst the technical indicators turned slightly higher, but remain stuck in neutral territory, lacking directional strength. In the 4 hours chart, the price is below a strongly bearish 20 SMA, while the Momentum indicator turned lower below its 100 level and the RSI indicator aims slightly higher around 45, not enough to limit chances of additional declines, particularly on a break below 1,223.90, Thursday's low and the immediate support.
Support levels: 1,223.90 1,214.60 1,206.40
Resistance levels: 1,242.60 1,250.50 1,261.80
WTI CRUDE
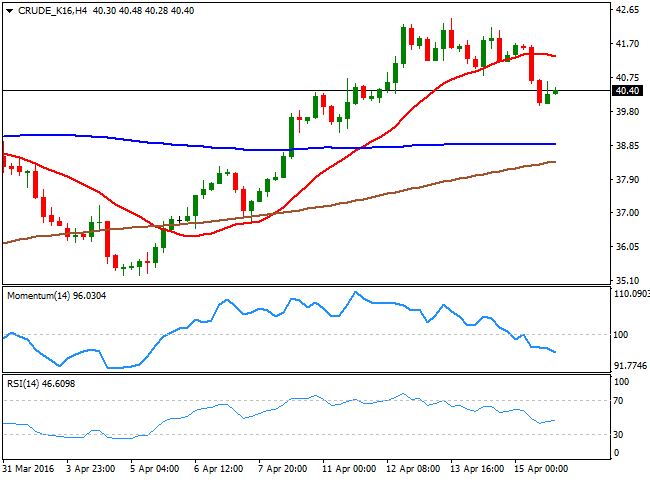
Crude oil prices closed the week with some shallow gains after advancing to fresh yearly highs last Wednesday. West Texas Intermediate futures advanced up to $42.39 a barrel before retreating towards the 40.00 level, as the lack of follow through forced investors into profit taking ahead of the worldwide oil producers' meeting undergoing in Doha, Qatar, this Sunday. So far, no official communication has been released, although there were some rumors that a draft was under way. But Iran, as largely expected, did not attend the meeting, and the general sense is that an agreement won't be reached, as no official news came after 8 hours past the scheduled conclusion. Therefore, oil prices can see some wide moves at the beginning of the week, as investors will adjust positions accordingly to the result. In the meantime, the daily chart for WTI shows that, despite the latest decline, the commodity remains above its moving averages, with the 200 DMA acting as an immediate support around 39.55, whilst the technical indicators have turned south, but remain well above their midlines. In the 4 hours chart, the Momentum indicator heads sharply lower within negative territory, while the price is below a bearish 20 SMA, currently around 41.40.
Support levels: 39.55 38.80 38.20
Resistance levels: 40.80 41.40 42.15
DAX
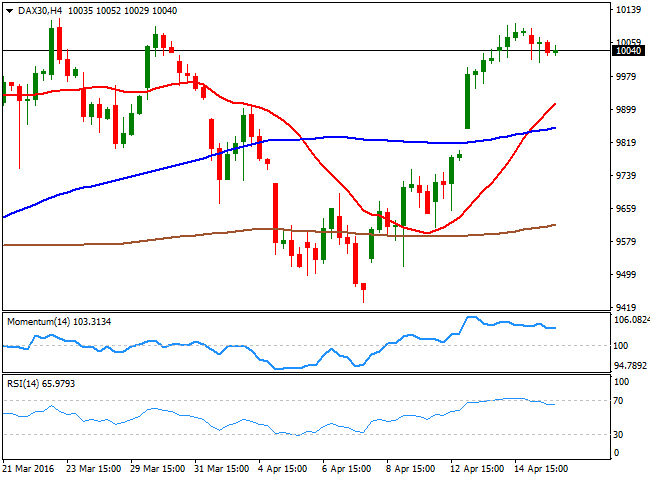
European stocks turned lower on Friday, closing in the red and snapping a fiveday winning streak. The German DAX lost 41 points or 0.42% to end at 10,051.57, strongly up on the week. Friday's decline was led by automakers, with Volkswagen down 2.4%, after data coming from the European Automobile Manufacturers’ Association showed its share of the European market contracted to its lowest in five years. Also, energy related shares pulled back alongside with crude oil prices, ahead of the oil producers' meeting in Qatar. Technically, the German benchmark held around its recent highs on Friday, and despite that in the daily chart the technical indicators have lost upward strength within positive territory, it held above its 100 DMA, something that should keep the downside limited during the upcoming sessions. In the 4 hours chart, the 20 SMA has accelerated its advance and crossed above the 100 SMA below the current price, whilst the technical indicators are consolidating near overbought readings, supporting a new leg higher on a break above 10,106, Thursdays high.
Support levels: 10,012 9,918 9,834
Resistance levels: 10,106 10,168 10,224
DOW JONES
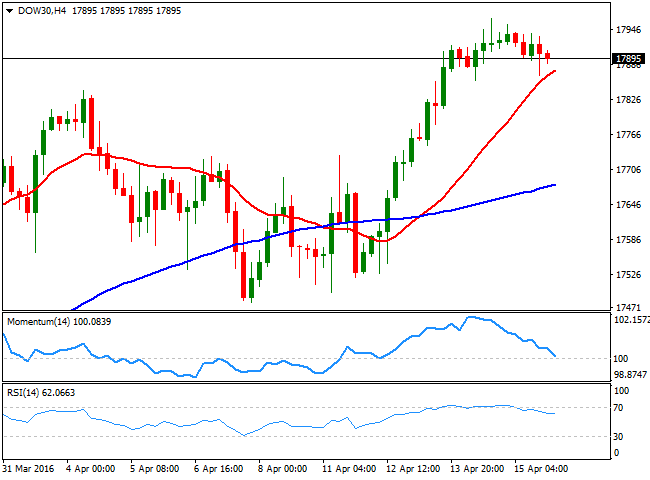
Wall Street edged lower on Friday, with all of the three major indexes closing slightly lower. The Dow Jones Industrial Average lost 28 points or 0.16% to close the week at 17,897.46, the Nasdaq lost 7 points to 4,938.22, while the S and P lost 0.10%, to end at 2,080.73. The limited decline was not enough to revert the strong positive tone in US shares that closed the week strongly up. Nevertheless, investors rushed to take profits out in anticipation to the OPEC and non OPEC producers which ahead of the weekly opening seems to have been a fiasco, and may result in a strong downward gap in oil prices, and therefore in energy related stocks. As for the technical perspective, the DJIA daily chart shows that the index holds near this year high and well above a bullish 20 SMA, whilst the RSI indicator retreated partially form overbought levels and the RSI hovers directionless within neutral territory. In the 4 hours chart, the Momentum indicator heads sharply lower and seems ready to cross its 100 line towards the downside, the index is a few points above a bullish 20 SMA, and the RSI indicator consolidates around 62, all of which increases the risk of a downward move, particularly on a break below 17,866, Friday's low and the immediate support.
Support levels: 17,866 17,814 17,723
Resistance levels: 17,964 18,045 18,105
FTSE 100
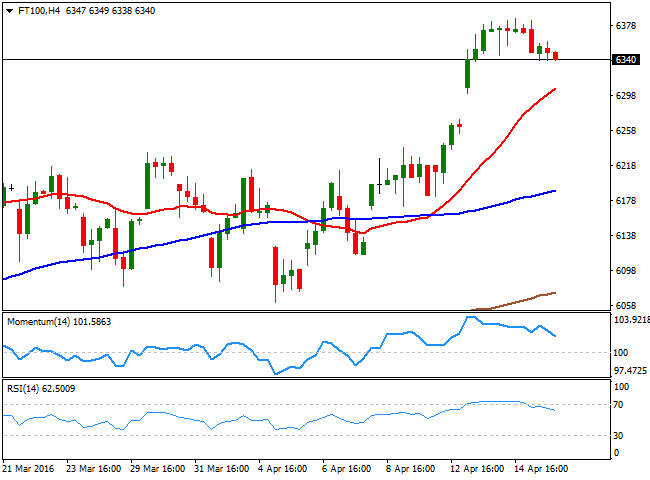
The Footsie lost 20 points to close at 6,343.75 on Friday, trimming part of its weekly gains, but closing the week at its highest for this year. Friday's decline was largely due to slipping oil prices, which weighed in the commodity related sector. Anglo American lost 1.72%, Rio Tinto dropped 0.5%, whilst Tullow Oil shed 5.58% and BP closed 0.73% lower. Given limited chances of an agreement in the Doha meeting, the commodity related block can extend its decline this Monday and lead to further losses in the London benchmark. Still, the daily chart shows that it holds far above its moving averages, whilst the technical indicators hold within positive territory, with no clear directional strength. In the 4 hours chart, the 20 SMA maintains a strong bullish slope below the current level, offering an immediate support around 6,306, whilst the technical indicators head lower within positive territory, indicating the index may fall further, one the mentioned support gives up.
Support levels: 6,306 6,243 6,201
Resistance levels: 6,390 6,447 6,488
The information set forth herein was obtained from sources which we believe to be reliable, but its accuracy cannot be guaranteed. It is not intended to be an offer, or the solicitation of any offer, to buy or sell the products or instruments referred herein. Any person placing reliance on this commentary to undertake trading does so entirely at their own risk.
Recommended Content
Editors’ Picks
EUR/USD holds above 1.0700 ahead of key US data

EUR/USD trades in a tight range above 1.0700 in the early European session on Friday. The US Dollar struggles to gather strength ahead of key PCE Price Index data, the Fed's preferred gauge of inflation, and helps the pair hold its ground.
USD/JPY stays above 156.00 after BoJ Governor Ueda's comments

USD/JPY holds above 156.00 after surging above this level with the initial reaction to the Bank of Japan's decision to leave the policy settings unchanged. BoJ Governor said weak Yen was not impacting prices but added that they will watch FX developments closely.
Gold price oscillates in a range as the focus remains glued to the US PCE Price Index

Gold price struggles to attract any meaningful buyers amid the emergence of fresh USD buying. Bets that the Fed will keep rates higher for longer amid sticky inflation help revive the USD demand.
Sei Price Prediction: SEI is in the zone of interest after a 10% leap

Sei price has been in recovery mode for almost ten days now, following a fall of almost 65% beginning in mid-March. While the SEI bulls continue to show strength, the uptrend could prove premature as massive bearish sentiment hovers above the altcoin’s price.
US core PCE inflation set to signal firm price pressures as markets delay Federal Reserve rate cut bets

The core PCE Price Index, which excludes volatile food and energy prices, is seen as the more influential measure of inflation in terms of Fed positioning. The index is forecast to rise 0.3% on a monthly basis in March, matching February’s increase.