EUR/USD
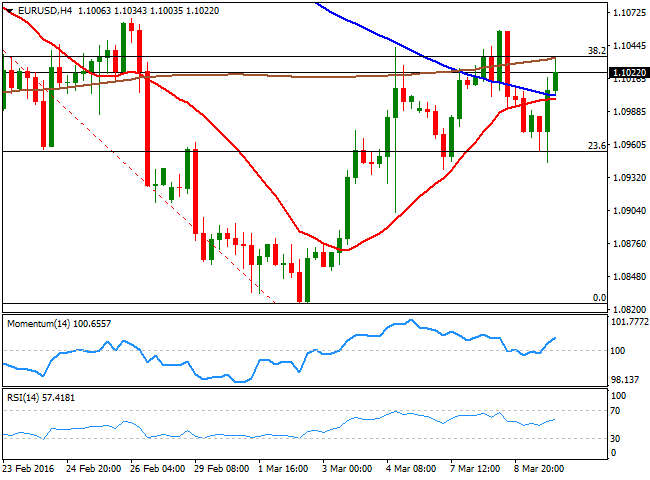
Majors continued trading on sentiment this Wednesday, with little in the macroeconomic calendar to trigger moves, although uncertainty over what the ECB may have to offer this Thursday, kept the EUR/USD pair on the move. As largely expected, the pair traded within its latest range, down to 1.0945 as risk aversion dominated the first half of the day, but then up towards 1.1034, as stocks ended higher in Europe and turned north in the US, pushing the negative sentiment back. All eyes are now on the European Central Bank, largely expected to extend its economic facilities, in light of latest deflationary reading in the EU. According to an initial estimate, inflation fell by 0.2% during February, back into negative territory after four months holding right above zero. Additionally, the Central Bank has suggested they are willing to cut the deposits rate by 10bp, but there's a good chance the decision will be reinforced with another measures. The American dollar traded generally lower across the board, helping the pair to recover ground during the American session. Anyway, upcoming moves well solely depend on how the market "reads" Draghi´s decisions and statement. Technically, the pair has been pretty much stuck around the 1.1000 region this week, with spikes beyond the figure being quickly reversed by profit taking. Nevertheless, strong buying interest surged on dips, generally keeping the risk towards the upside. In the 4 hours chart, the price has now recovered above its 20 SMA while the technical indicators head north within positive territory, although the pair is still in trouble when it comes to overcome the 38.2% retracement of its latest decline around 1.1040. Some follow through beyond the level on a positive outcome, can see the pair rallying up to 1.1120/60, the next strong static resistance area.
Support levels: 1.0940 1.0910 1.0880
Resistance levels: 1.1045 1.1080 1.1120
GBP/USD
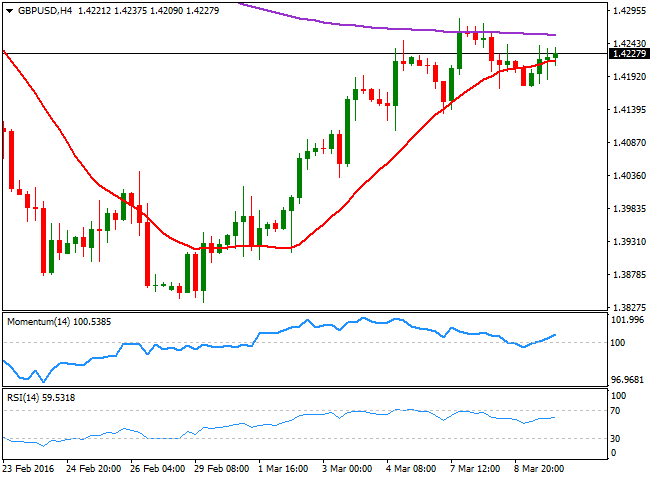
The GBP/USD pair remained confined to a tight range this Wednesday unmotivated by tepid Manufacturing and Industrial Production data. The figures came out mixed, in balance better than expected, but overall reflecting limited growth in the sector. According to the official release, Industrial Production is estimated to have increased by 0.3% monthly basis, below market expectations of 0.5% but reversing the previous 1.1% decline. Manufacturing in the same period rose by 0.7%, against the 0.2% expected and than the previous revised 0.3%. The pair however, wobbled around the 1.4200 figure, having met some buying interest on declines towards the 1.4170 price zone, but unable to advance beyond 1.4240. From a technical point of view, the pair presents a neutral short term stance according to the 1 hour chart, in where the price stands a few pips above a horizontal 20 SMA and the technical indicators hold flat within positive territory. In the 4 hours chart, the pair presents a mild bullish potential with the price also hovering above its 20 SMA, but the technical indicators aiming higher above their midlines.
Support levels: 1.4165 1.4120 1.4070
Resistance levels: 1.4240 1.4290 1.4335
USD/JPY
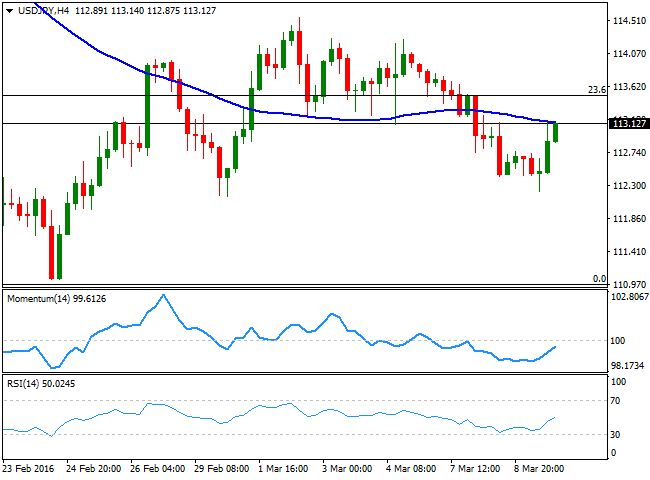
The USD/JPY pair recovered from a daily low of 112.22, stretching higher in the US afternoon, being the yen the only major that's losing ground against a broadly weaker greenback this Wednesday. Higher US yields, with the 10y note yield up to 1.89%, have fueled the advance during the American session, sending the pair back above the 113.00 level. Short term, the pair presents a strong upward potential, as in the 1 hour chart, the technical indicators head sharply higher well above their midlines, although the price is still below its 100 and 200 SMAs, with the shortest now around 113.30. In the 4 hours chart, the technical indicators have extended their recoveries from oversold territory, and keep heading higher, but below their midlines. The pair has a strong resistance around 113.50, the 23.6% retracement of the latest daily slump, and it will take a recovery above it to see a more upward constructive scenario. However, it will take a break above 115.05, the 38.2% retracement of the same rally, to talk about a bullish trend developing in the pair.
Support levels: 112.85 112.50 112.15
Resistance levels: 113.50 114.00 114.60
GOLD
Gold prices eased during the past trading sessions, with spot closing in the red around $ 1,254.00 a troy ounce after being as low as 1,242.90. The commodity corrected lower amid a firmer tone in EU and US stocks and some profit taking ahead of the ECB's decision, after the bright metal failed to break above its recent 2016 highs. The movement can be consider corrective at this point, hardly significant compared to the $200 almost straight advance. Technically, the daily chart shows that the decline was halted well above a bullish 20 SMA, currently around 1,236.00, while the Momentum indicator aims slightly higher well above the 100 level and the RSI indicator having turned south, around 62, all of which shows limited chances of a strong downward move. In the shorter term however, the risk has turned lower, as in the 4 hours chart, the 20 SMA is turning south above the current level, while the technical indicators head firmly lower within bearish territory, in line with a continued decline, particularly on a break below the mentioned daily low.
Support levels: 1,242.90 1,236.00 1,227.30
Resistance levels: 1,258.90 1,265.10 1,271.30
WTI CRUDE
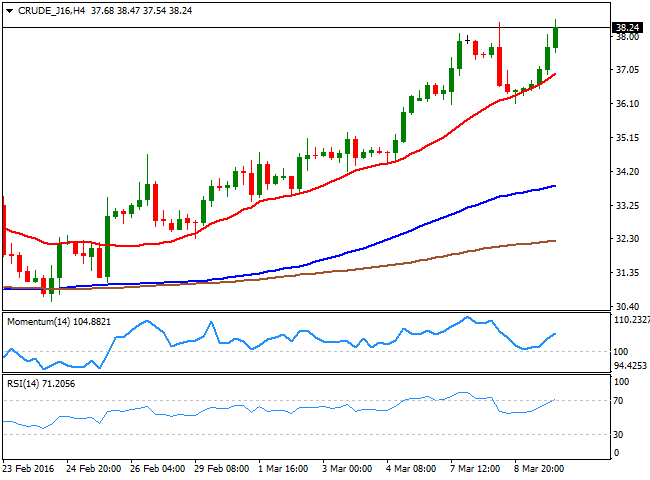
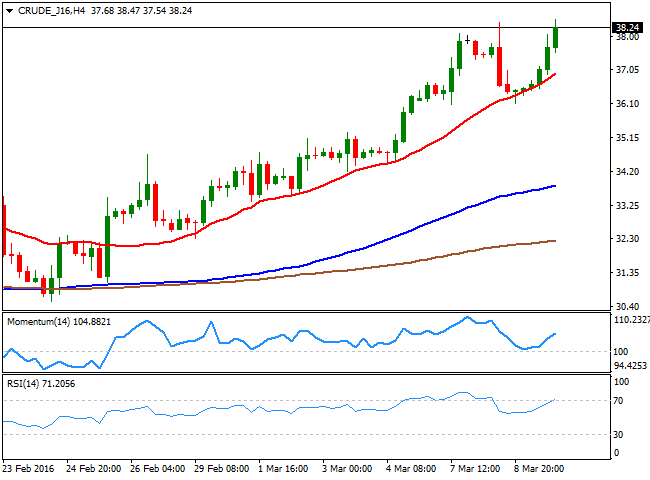
Crude oil prices recovered the ground lost on Tuesday, and even moved to fresh highs on the back of decreasing US stockpiles which boosted hopes of a continued advance in prices. The US EIA reported that crude stockpiles rose by 3.9 million barrels to nearly 522 million barrels. The surprise came from gasoline investors, which fell by 4.5 million barrels, much more than the expected 1.4 million. Also, late Tuesday the American Petroleum Institute reported an oil inventory of 4.4 million barrels for the week, against previous 9.9 million build. West Texas Intermediate crude oil trades above $ 38.00 by the end of the US session, and the daily chart shows that the technical indicators have resumed their advances after a limited downward corrective move near overbought readings, while the price is well above a 100 SMA. In the 4 hours chart, the commodity has met buying interest on dips towards a bullish 20 SMA, whilst the technical indicators have bounced from their midlines, and retain the bullish tone.
Support levels: 37.40 36.60 36.05
Resistance levels: 38.50 39.20 40.00
DAX
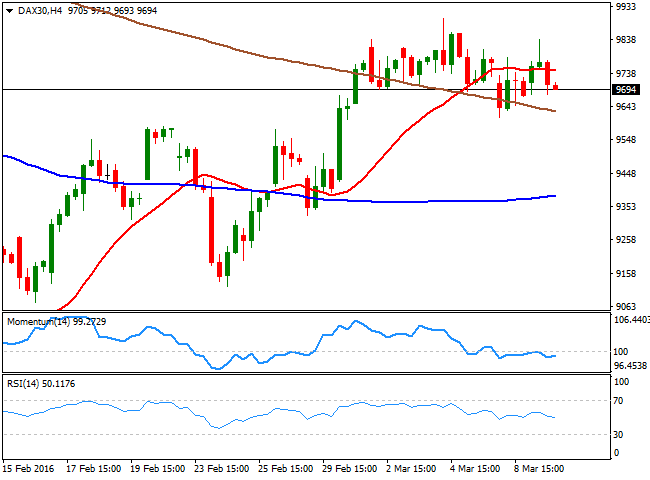
European equities continued oscillating in relative tight ranges, with the German DAX advancing 0.31% to end the day at 9,723.09, trading in a further restricted range ahead of the ECB meeting this Thursday. The positive tone in European share markets was backed by speculation that the ECB will announce some kind of extension of its economic easing program, in another attempt to revive inflation. The DAX, however, gave back its gains in afterhours trading, and hovers below the 9,700 level ahead of Asian opening. Technically, the daily chart shows that the index kept consolidating well above a bullish 20 SMA, while the technical indicators have stalled their declines above their midlines, and are currently flat. In the shorter term, the 4 hours chart presents a neutraltobearish stance, given that the index is being contained by a horizontal 20 SMA, whilst the technical indicators lack directional strength right below their midlines.
Support levels: 9,648 9,575 9,510
Resistance levels: 9,752 9,837 9,924
DOW JONES
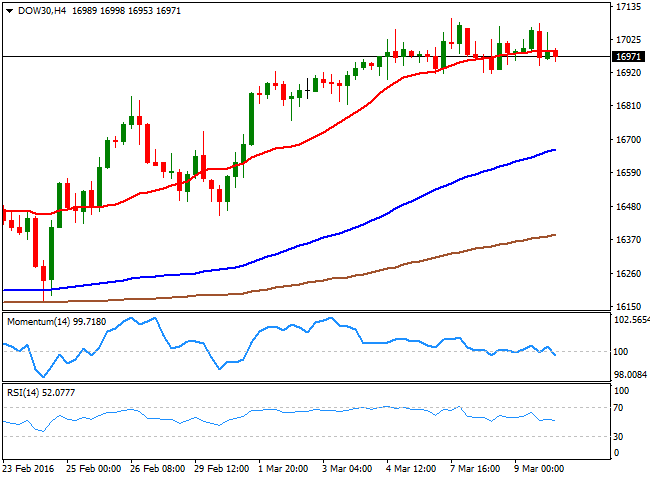
Wall Street managed to close marginally higher, with gains being quite limited amid ongoing uncertainty over the upcoming ECB meeting this Thursday. The Dow Jones Industrial Average added 36 points to end at 17,000.36, the Nasdaq advanced 0.55% to close at 4,674.38, whilst the SandP surged 0.51% to 1,989.26. The Dow closed the day right above its 200 DMA, having reversed an early decline towards the 100 DMA. Nevertheless, a breakout of the critical dynamic levels is not yet confirmed, as the index having hovering around these large moving averages ever since the day started. The daily chart also shows that the 20 SMA maintains its sharp bullish slope well below the current level, although the technical indicators have eased further from overbought levels, still unable to confirm a new leg north. In the shorter term, the 4 hours chart presents a neutral stance, as the index has been moving back and forth around a flat 20 SMA, while the technical indicators keep hovering around their midlines, with no certain directional strength.
Support levels: 16,915 16,835 16,761
Resistance levels: 17,049 17,105 17,174
FTSE 100
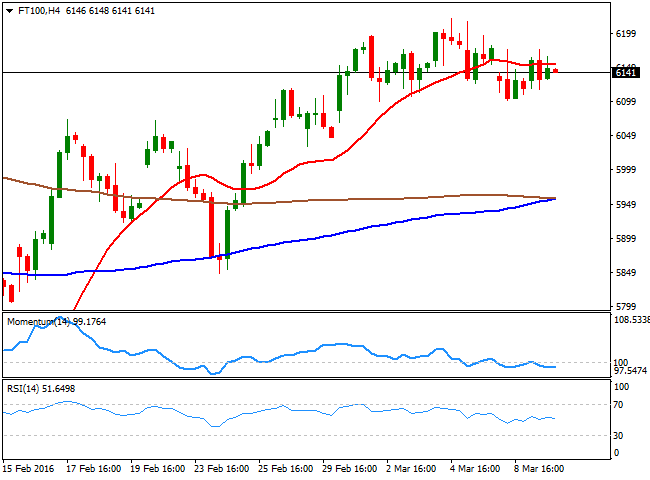
London´s equity market edged lower on Wednesday, with the FTSE 100 ending the day at 6,146.32, up by 20 points. Despite European indexes recovered some ground ahead of ECB's expected easing and oil reversed its latest loses, investors remained in cautious mode. The advance was led by the insurance giant Prudential, up 2.9% after reporting better than expected profits. Also, Brent crude recovered above $40.00 a barrel, although the energy related sector failed to follow through, with only Glencore trading marginally higher. Daily basis, the benchmark managed to recover from a decline towards the 100 DMA, whilst the 20 SMA extended its advance below it, currently around 6,012. In the same chart, the technical indicators have bounced back after erasing all of the overbought conditions, suggesting the index could advance further. In the 4 hours chart, however, the index maintains a neutral stance, with the risk towards the downside, given that the technical indicators head slightly lower right below their midlines.
Support levels: 6,110 6,058 6,012
Resistance levels: 6,221 6,286 6,332
The information set forth herein was obtained from sources which we believe to be reliable, but its accuracy cannot be guaranteed. It is not intended to be an offer, or the solicitation of any offer, to buy or sell the products or instruments referred herein. Any person placing reliance on this commentary to undertake trading does so entirely at their own risk.
Recommended Content
Editors’ Picks
EUR/USD holds below 1.0750 ahead of key US data

EUR/USD trades in a tight range below 1.0750 in the European session on Friday. The US Dollar struggles to gather strength ahead of key PCE Price Index data, the Fed's preferred gauge of inflation, and helps the pair hold its ground.
USD/JPY stays firm above 156.00 after BoJ Governor Ueda's comments

USD/JPY stays firm above 156.00 after surging above this level on the Bank of Japan's decision to leave the policy settings unchanged. BoJ Governor said weak Yen was not impacting prices but added that they will watch FX developments closely.
Gold price oscillates in a range as the focus remains glued to the US PCE Price Index

Gold price struggles to attract any meaningful buyers amid the emergence of fresh USD buying. Bets that the Fed will keep rates higher for longer amid sticky inflation help revive the USD demand.
Bitcoin Weekly Forecast: BTC’s next breakout could propel it to $80,000 Premium

Bitcoin’s recent price consolidation could be nearing its end as technical indicators and on-chain metrics suggest a potential upward breakout. However, this move would not be straightforward and could punish impatient investors.
US core PCE inflation set to signal firm price pressures as markets delay Federal Reserve rate cut bets

The core PCE Price Index, which excludes volatile food and energy prices, is seen as the more influential measure of inflation in terms of Fed positioning. The index is forecast to rise 0.3% on a monthly basis in March, matching February’s increase.
