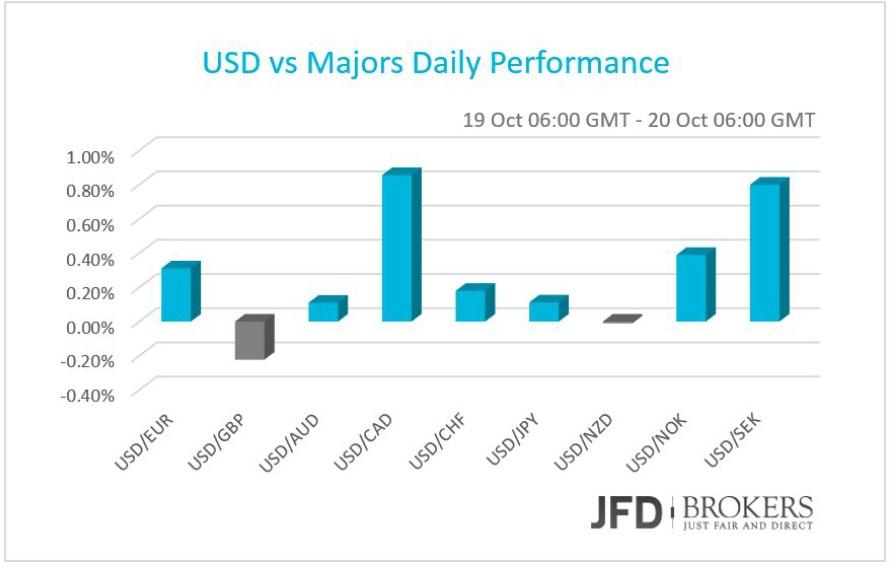
The dollar rose against almost all of the major currencies on Monday and early Tuesday, with impressive gains against the Canadian dollar and the Swedish krone. The Canadian dollar plunged amid the decreased commodity prices and raw materials as China’s news of the macroeconomic front disappointed the investors. China’s data were mixed, the third quarter’s GDP growth, on a yearly basis, has slowed slightly and the industrial production dropped to 5.7% growth versus 6.0% expected. Furthermore, the Urban Investment, year‐to‐date for October, an index refers to the total amount money of the activities in construction and purchase of fixed assets, softened significantly conversely to September’s retail sales than picked up marginally.
Overall the direction of the USD/CAD remains unclear as the pair is moving in a range the last 2 months between 1.45 – 1.55. The instrument has a 50 – 50 chance of a recovery above 1.4900 or a fall towards 1.4600 in the coming session.
Euro gave up gains as ECB meeting approaches
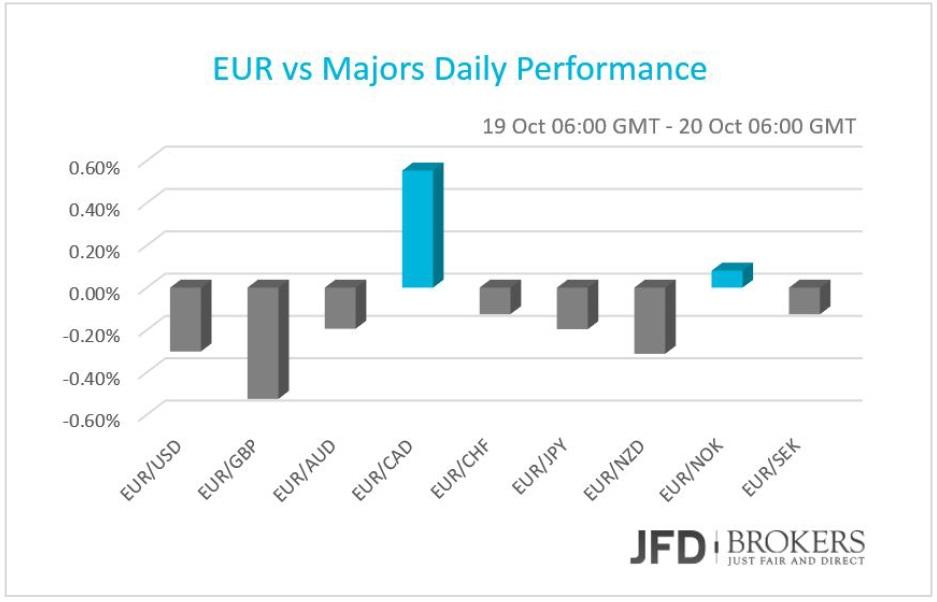
Euro was broadly lower as the ECB meeting on Thursday is approaching and the investors boost their opinion for some additional stimulus later in this year. The Euro Area is under deflationary pressure and the central bank is expected to expand or extend its QE program. However, the adjustment of the asset purchasing program may be postponed for December, in order to use for forecasting the third quarter’s economic data and whether they will meet forecasts or disappoint further the market.
Nothing changed to the EUR/USD pair as it remained trapped in a tight range, roughly around the key level of 1.1350. Technically speaking, what we now have on the daily chart is a symmetrical triangle formation. Given the fact that we have already seen one fake‐out, I would prefer to see some confirmation of the move, preferably a 4‐hour close above the trend line or the 1.1530 level. The pair fell for a fourth consecutive session, following a failed attempt above the 1.1500 to break higher a few days ago. A push through 1.1300 would head on towards the daily 50‐SMA, around 1.1250. Further declines take the pair onwards to rising trendline and lower boundary of the triangle, around 1.1120, where it coincides with the daily 200‐SMA.
GBP broadly higher ahead despite the absence of economic news
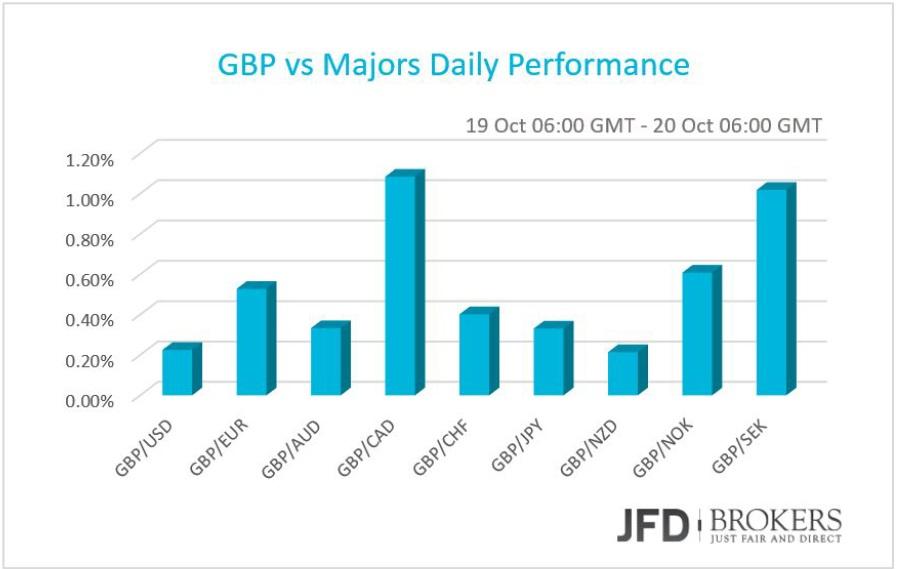
The sterling was broadly higher against all of the other G10 counterparts as the GBP traders further to the BoE Governor speech later in the day, they expect two important economic news in the week, both of them are forecasted to show improvement in the economy. The public sector net borrowing in September will come out tomorrow and is predicted to have shrunk at £9.100B from £11.305B. The other important economic indicator is the retail sales for September which is expected to have grown by the steepest pace in the last half year, on a yearly basis, coming out on Thursday.
After a successful upward run from the psychological level of 1.5200, where the pair added more than 250 pips in a day, the GBP/USD pair trapped in a trading range between the psychological level of 1.5400 and the key resistance level of 1.5500. The falling trendline which started back in mid‐ August and the 1.5500 level, both will be the key developments to watch during this week. Except the BoE Governor Mark Caney’s speech and Thursday’s UK Retail Sales release, we do not have any other significant event that could move the pound. Therefore, I would expect the bull to maintain the price above the 1.5400 level and to increase their attempts to break above the psychological level of 1.5500. In fact, any bullish move will have to break through the descending trend line, as well as the latter level.
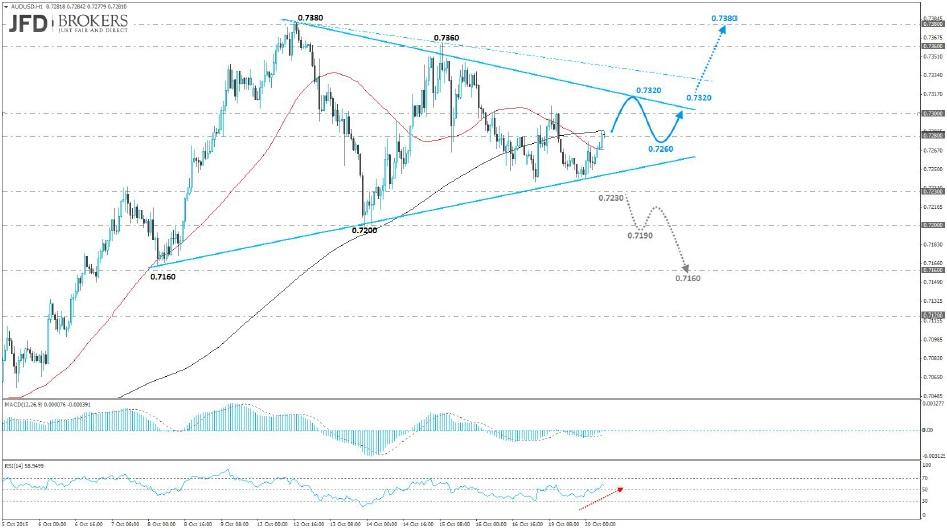
AUD/USD after the release of the RBA minutes
The AUD/USD remained unchanged, roughly around the 0.7280 area, on early Tuesday, following the release of the Reserve Bank of Australia's minutes from its October 6 meeting. The central bank continues to see a period of weak economic activity ahead, meaning monetary policy is likely to stay on hold for some time, according to the minutes of the bank's latest meeting. The RBA meeting minutes suggest the bank is not currently expecting to decrease rates again, particularly as the economy's rebalancing evolves. The monthly chart provides a solid opportunity for the long‐term bulls with a minimal risk involved. Such positions are loved by the traders due to their high profitability expectations and the low risk involved in the trade. Switching to the biggest possible time‐frame we spot very harmonies cycles that have been in play since the currency pair has been tradable. Currently, we believe that the pair is in front of a major cycle/trend reversal and there are a lot of patterns pointing in our favour. From a technical perspective, the potential is enormous. We can spot that the pair has tested successfully a main ascending trend line support and we observe a bullish price action pattern showing that the downtrend has been stopped. In a medium‐term perspective, the prices are likely to rally towards the levels around 0.7500 where the main resistance zone is located. On the other hand, the loss potential of such position is very limited because if we see the prices below 0.6900, technically the downtrend will continue, prompting a more aggressive move towards the 0.6300 level.
USD/JPY – Technical Outlook
The USD/JPY pair is still traded in a perfect triangle pattern that has not been completed by a breakout. For the moment, we expect the prices to be traded in a tight range between the key support level of 118.50 and the 121.75 barrier. Both the MACD and the Momentum lie near their neutral levels confirming the validity of the formation, while the stochastic is moving near the 50 level, reaffirming the disagreement between investors. Following Thursday’s false break out below the 118.50 level, there is little real change to the outlook and for the time being, with the short term charts giving a little hint in either direction, a neutral stance is required.
Gold – Technical Outlook
The precious metal dropped for a fourth straight session on Monday as the U.S. dollar resumed its rebound against its major counterparts. The rally in the gold since breaking above the key level of $1,150 has been very strong, adding almost $40 in less than a month. A retracement was always likely to come, it was just a case of when. We saw a brief pullback last week before a continuation of the move higher on Friday. With the pair finding resistance around $1,185, it didn’t come as a surprise the move below the intraday key level of $1,180. For now, it will be interesting to see if this is in the early stages of a flag formation (4‐hour chart) and the reaction to the 50‐SMA, which is currently providing support, around the $1,167 barrier. If the yellow metal respects these levels, then this could just be a short‐term retracement of the move from $1,100.
U.S. Indices extend their gains
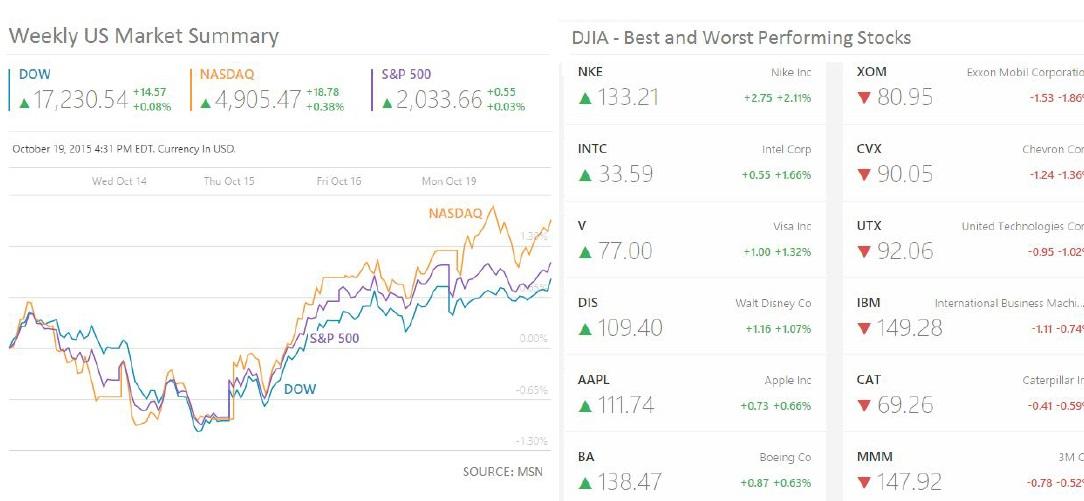
The U.S. indices extended their gains for the third consecutive day. The tech‐heavy index rose by +0.38% while the S&P500 has edged higher marginally by +0.03%. Morgan Stanley (NYSE: MS) was one of the worst perform stocks, more than 5.0% down. The Dow Jones industrial average up ticked by +0.08% with best‐performing stocks Nike (NYSE: NKE), Intel (NASDAQ: INTC), Visa (NYSE: V) and Walt Disney (NYSE: DIS), more than 1% up. Meanwhile, the Exxon‐Mobil (NYSE: XOM), Chevron Corp (NYSE: CVX) and United Technologies (NYSE: UTX) suffered losses more than 1%.
Earnings Reports Schedule
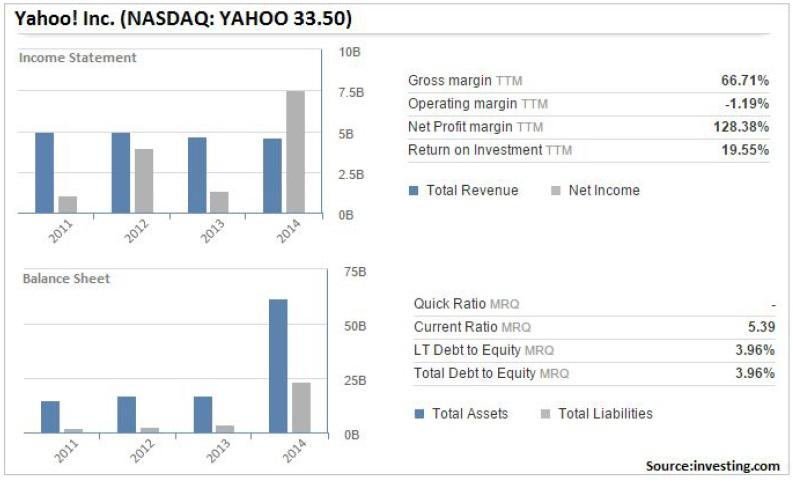
Most of the corporate earnings have been below expectations early in this third quarter earnings season. Today, Harley‐Davidson Inc. (NYSE: HOG 56.05) is scheduled to report its earnings. Harley‐ Davidson 1 year return is ‐4.4% while for the six months ended 28 June 2015, Harley‐Davidson Inc. revenues decreased 6% to $3.5B. On the other hand, dividend per share (DPS) increased from $0.55 to $0.62. Furthermore, the stock is set to deliver a positive month, currently +2.09 so far this month, following a negative September ‐2.05% and a red August ‐3.86%. Bellwether companies scheduled to report their earnings next week include: Yahoo! Inc. (NASDAQ: YAHOO 33.50) and Verizon Communications Inc. (NYSE: VZ 44.81). Yahoo’s revenues increased 11% to $2.47B for the six months ended 30 June 2015 while net loss reflects Earnings in equity interest decrease 65% to $195.5M.
Economic Indicators
In Eurozone, the current account for August will be released. A while later the Bank of England Governor Mark Carney will give a speech. Across the Atlantic, the U.S. September’s figures for housing starts and building permits are scheduled to be published. Canadian wholesale sales in August are expected to come out. Overnight, the Australian CB leading economic indicator for August will be out as well as the Westpac leading index for September. In Japan, the all industry activity index will be eyed.
The content we produce does not constitute investment advice or investment recommendation (should not be considered as such) and does not in any way constitute an invitation to acquire any financial instrument or product. JFD Group, its affiliates, agents, directors, officers or employees are not liable for any damages that may be caused by individual comments or statements by JFD Group analysts and assumes no liability with respect to the completeness and correctness of the content presented. The investor is solely responsible for the risk of his investment decisions. Accordingly, you should seek, if you consider appropriate, relevant independent professional advice on the investment considered. The analyses and comments presented do not include any consideration of your personal investment objectives, financial circumstances or needs. The content has not been prepared in accordance with the legal requirements for financial analyses and must therefore be viewed by the reader as marketing information. JFD Group prohibits the duplication or publication without explicit approval.
72,99% of the retail investor accounts lose money when trading CFDs with this provider. You should consider whether you can afford to take the high risk of losing your money. Please read the full Risk Disclosure: https://www.jfdbank.com/en/legal/risk-disclosure
Recommended Content
Editors’ Picks
EUR/USD holds above 1.0700 ahead of key US data

EUR/USD trades in a tight range above 1.0700 in the early European session on Friday. The US Dollar struggles to gather strength ahead of key PCE Price Index data, the Fed's preferred gauge of inflation, and helps the pair hold its ground.
USD/JPY stays above 156.00 after BoJ Governor Ueda's comments

USD/JPY holds above 156.00 after surging above this level with the initial reaction to the Bank of Japan's decision to leave the policy settings unchanged. BoJ Governor said weak Yen was not impacting prices but added that they will watch FX developments closely.
Gold price oscillates in a range as the focus remains glued to the US PCE Price Index

Gold price struggles to attract any meaningful buyers amid the emergence of fresh USD buying. Bets that the Fed will keep rates higher for longer amid sticky inflation help revive the USD demand.
Sei Price Prediction: SEI is in the zone of interest after a 10% leap

Sei price has been in recovery mode for almost ten days now, following a fall of almost 65% beginning in mid-March. While the SEI bulls continue to show strength, the uptrend could prove premature as massive bearish sentiment hovers above the altcoin’s price.
US core PCE inflation set to signal firm price pressures as markets delay Federal Reserve rate cut bets

The core PCE Price Index, which excludes volatile food and energy prices, is seen as the more influential measure of inflation in terms of Fed positioning. The index is forecast to rise 0.3% on a monthly basis in March, matching February’s increase.
